. 2021 Apr 6;118(14):e1811725118.
doi: 10.1073/pnas.1811725118.

Nanoanalytical analysis of bisphosphonate-driven alterations of microcalcifications using a 3D hydrogel system and in vivo mouse model

Affiliations

Nanoanalytical analysis of bisphosphonate-driven alterations of microcalcifications using a 3D hydrogel system and in vivo mouse model

Jessica L Ruiz et al. Proc Natl Acad Sci U S A. .

Abstract

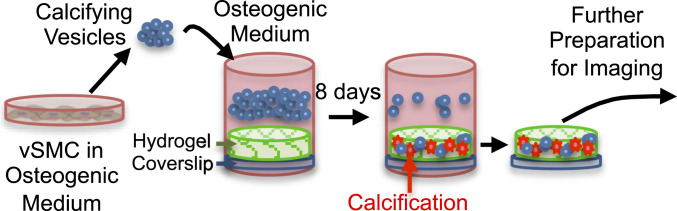
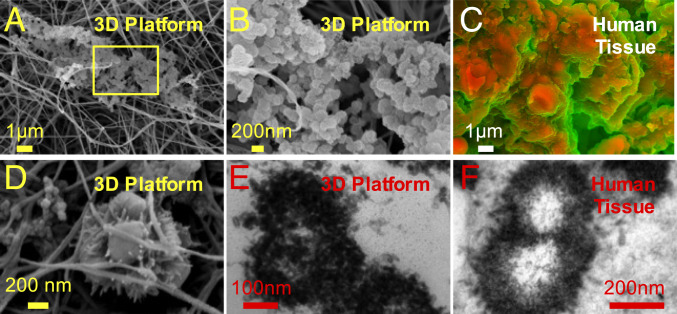
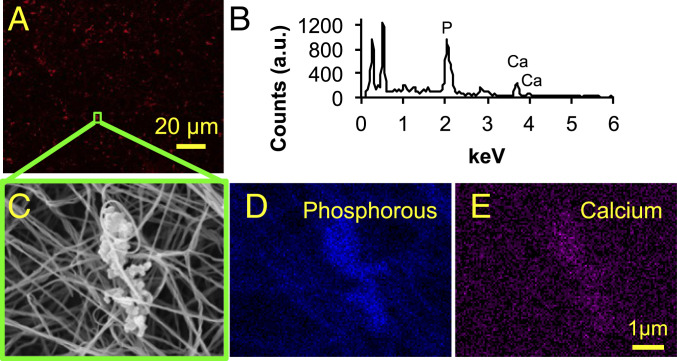
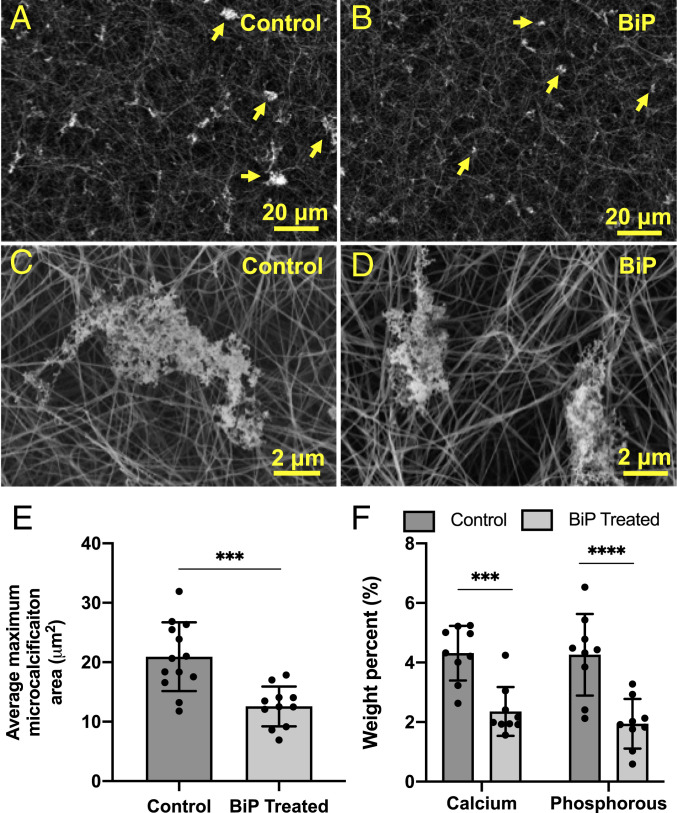
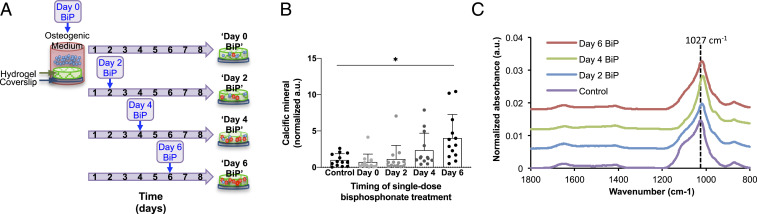
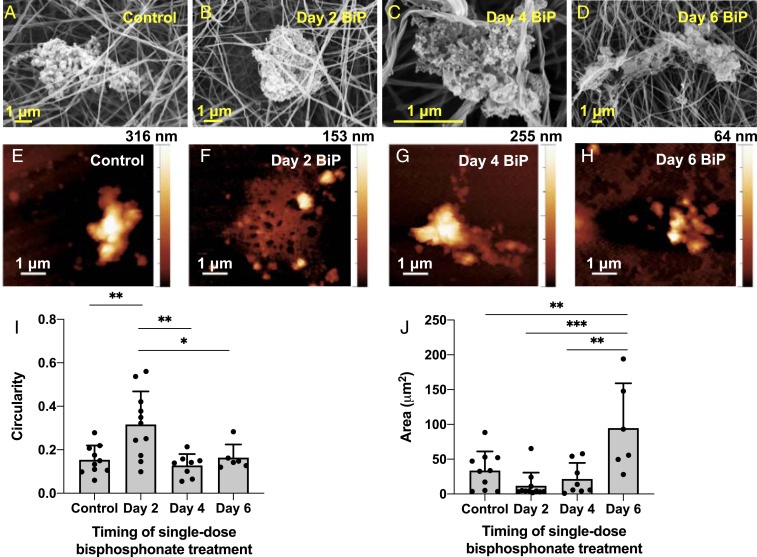
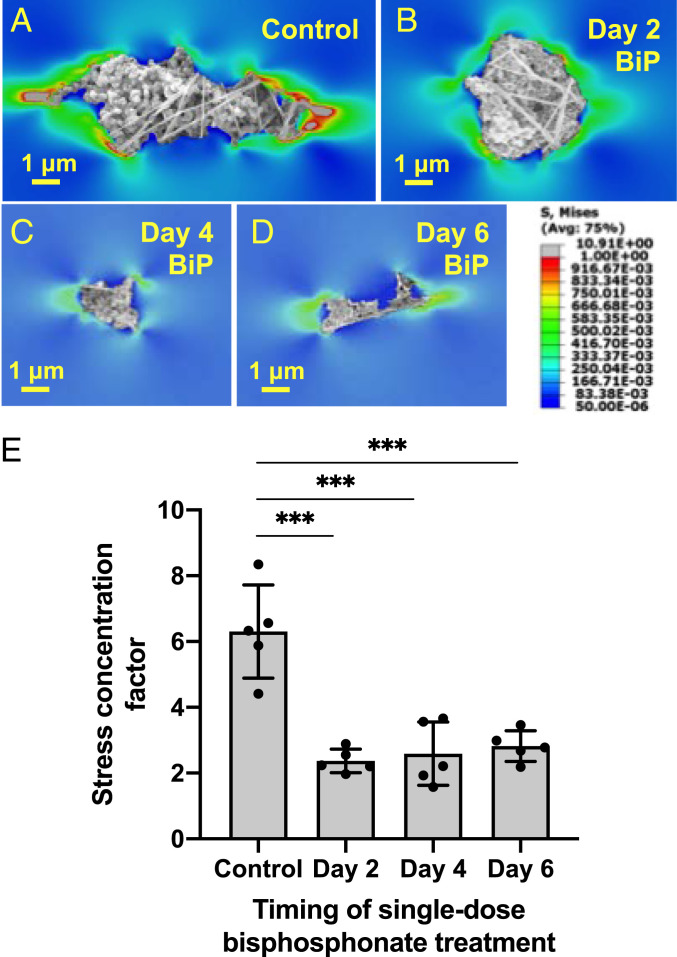
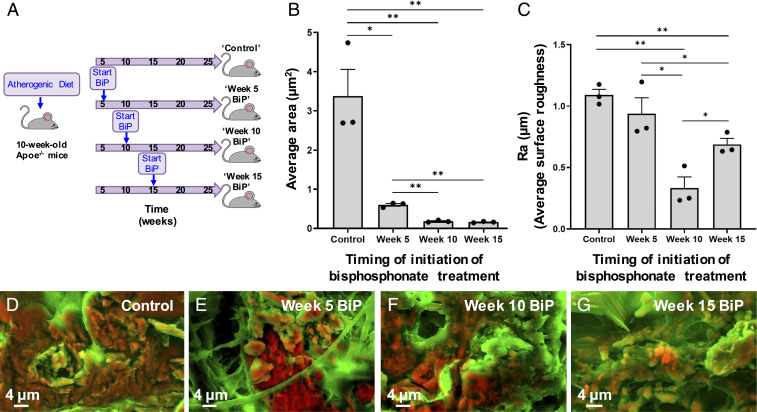
Vascular calcification predicts atherosclerotic plaque rupture and cardiovascular events. Retrospective studies of women taking bisphosphonates (BiPs), a proposed therapy for vascular calcification, showed that BiPs paradoxically increased morbidity in patients with prior acute cardiovascular events but decreased mortality in event-free patients. Calcifying extracellular vesicles (EVs), released by cells within atherosclerotic plaques, aggregate and nucleate calcification. We hypothesized that BiPs block EV aggregation and modify existing mineral growth, potentially altering microcalcification morphology and the risk of plaque rupture. Three-dimensional (3D) collagen hydrogels incubated with calcifying EVs were used to mimic fibrous cap calcification in vitro, while an ApoE-/- mouse was used as a model of atherosclerosis in vivo. EV aggregation and formation of stress-inducing microcalcifications was imaged via scanning electron microscopy (SEM) and atomic force microscopy (AFM). In both models, BiP (ibandronate) treatment resulted in time-dependent changes in microcalcification size and mineral morphology, dependent on whether BiP treatment was initiated before or after the expected onset of microcalcification formation. Following BiP treatment at any time, microcalcifications formed in vitro were predicted to have an associated threefold decrease in fibrous cap tensile stress compared to untreated controls, estimated using finite element analysis (FEA). These findings support our hypothesis that BiPs alter EV-driven calcification. The study also confirmed that our 3D hydrogel is a viable platform to study EV-mediated mineral nucleation and evaluate potential therapies for cardiovascular calcification.

Keywords: atherosclerosis; bisphosphonate; extracellular vesicles; microcalcification.


Figures

Fig. 1.
Fig. 1.
Schematic of assembly and use of 3D collagen platform.
Fig. 2.
Fig. 2.
The 3D collagen-EV platform recapitulated microcalcifications seen in human atheroma. (A) SEM image of a microcalcification formed in the 3D collagen platform after 8 d of incubation with calcifying EVs. (B) Higher magnification view of yellow-outlined region in B. (C) DDC-SEM image of calcified atherosclerotic plaque from a human carotid endarterectomy sample. (D) Higher magnification SEM image of EVs aggregating in the 3D collagen platform. (E) TEM image of a microcalcification formed in the 3D collagen platform. (F) TEM image of calcified atherosclerotic plaque from human tissue sample.
Fig. 3.
Fig. 3.
The 3D collagen-EV platform mediated the deposition of calcium phosphate mineral. (A) Collagen hydrogel following 8 d of incubation with calcifying EVs, stained with a near-infrared fluorescent calcium tracer, and imaged using confocal microscopy. (B) Representative EDS spectrum of a microcalcification in the 3D collagen platform. (C) Microcalcification imaged in the 3D collagen platform using SEM. EDS was conducted for this microcalcification, yielding elemental maps of phosphorous (D) and calcium (E).
Fig. 4.
Fig. 4.
BiP reduced the maximum size of calcific EV aggregates visualized via SEM. Changes in microcalcification size can be seen at low magnification (A vs. B) and high magnification (C vs. D). The average cross-sectional area of the five largest microcalcifications per high-powered field was significantly lower in the BiP-treated group versus the control group (E, n = 3 biological replicates). Elemental calcium and phosphorous composition of control and BiP-treated microcalcifications measured via EDS (F, nine technical replicates per group, n = 1 biological replicates, ***P < 0.001, ****P < 0.0001, error bars represent SD).
Fig. 5.
Fig. 5.
The formation of microcalcifications varied significantly with single-dose BiP treatment in a time-dependent manner. Schematic depicting the experimental setup for treating samples with a single dose of BiP at different times (A). The amount of calcium phosphate mineral formed in each sample was measured using a fluorescent-based assay and varied significantly across treatment groups (B, P = 0.0025 via one-way ANOVA; n = 5 biological replicates), with a significant difference between control and day 6 groups (*P = 0.027, error bars represent SD). The chemical composition of microcalcifications formed in each sample was measured using FTIR, with a representative spectrum shown for each group (C).
Fig. 6.
Fig. 6.
BiP treatment altered microcalcification morphology in a time-dependent manner. SEM (AD) and AFM (EH) were used to image microcalcifications formed in 3D collagen hydrogels that were treated at different times with a single dose of BiP. Microcalcification circularity (I) and size (J) significantly varied across time points (n = 4 biological replicates for control, day 2, day 4 groups, n = 2 biological replicates for day 6 group; *P < 0.05, **P < 0.01, ***P < 0.001, error bars represent SD).
Fig. 7.
Fig. 7.
BiP treatment altered the predicted fibrous cap tensile stress attributed to single microcalcifications, in a time-dependent manner. AD demonstrate FEA analysis of representative microcalcifications treated with BiP at different time points. E quantifies the average stress concentration factor for five representative microcalcifications from each BiP-treated group, as compared to untreated microcalcifications (control), (n = 3 biological replicates per group, except day 6 group, which reflects n = 2 biological replicates, error bars represent SD, ***P < 0.0001).
Fig. 8.
Fig. 8.
BiP treatment altered atherosclerotic plaque-associated calcification morphology in a time-dependent manner. ApoE−/− mice were fed an atherogenic diet and started on twice weekly BiP (ibandronate) treatment at various stages of atherosclerotic plaque development and calcification (A). Histological sections of aortic tissue were imaged using DDC-SEM. Quantitative image analysis was performed to measure the average area per individual calcification in each image (B) and the average surface roughness of calcific mineral in each image (C, n = 3 biological replicates per group; *P < 0.05, **P < 0.01, error bars represent SE of mean). Representative DDC-SEM images from each treatment group are shown (DG).

References

    1. Lloyd-Jones D.et al. .; American Heart Association Statistics Committee and Stroke Statistics Subcommittee , Executive summary: Heart disease and stroke statistics–2010 update: A report from the American heart association. Circulation 121, 948–954 (2010). - PubMed
    1. Go A. S.et al. .; American Heart Association Statistics Committee and Stroke Statistics Subcommittee , Executive summary: Heart disease and stroke statistics–2013 update: A report from the American heart association. Circulation 127, 143–152 (2013). - PubMed
    1. Vliegenthart R., et al. ., Coronary calcification improves cardiovascular risk prediction in the elderly. Circulation 112, 572–577 (2005). - PubMed
    1. Martin S. S., et al. ., Dyslipidemia, coronary artery calcium, and incident atherosclerotic cardiovascular disease: Implications for statin therapy from the multi-ethnic study of atherosclerosis. Circulation 129, 77–86 (2014). - PMC - PubMed
    1. Ferencik M., et al. ., A computed tomography-based coronary lesion score to predict acute coronary syndrome among patients with acute chest pain and significant coronary stenosis on coronary computed tomographic angiogram. Am. J. Cardiol. 110, 183–189 (2012). - PMC - PubMed

Publication types