. 2021 Apr 1;12(4):342.
doi: 10.1038/s41419-021-03643-6.

Growth hormone induces mitotic catastrophe of glomerular podocytes and contributes to proteinuria

Affiliations

Growth hormone induces mitotic catastrophe of glomerular podocytes and contributes to proteinuria

Rajkishor Nishad et al. Cell Death Dis. .

Abstract

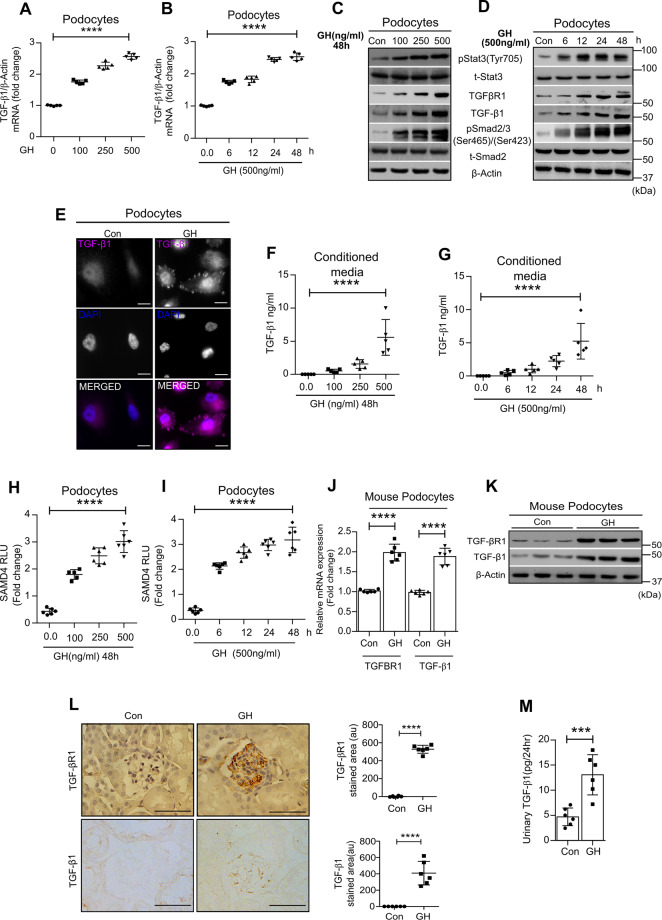
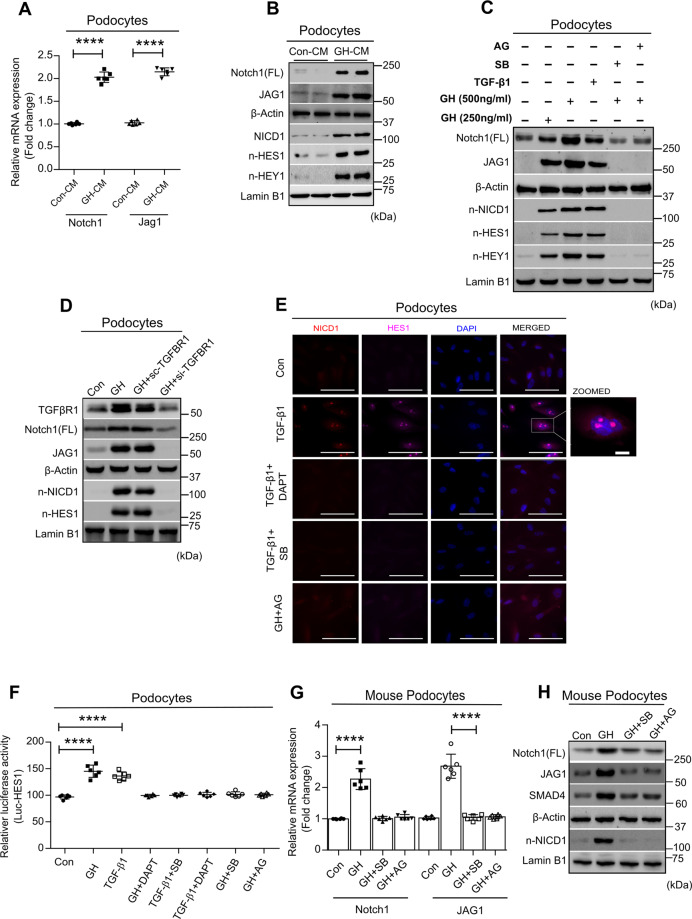
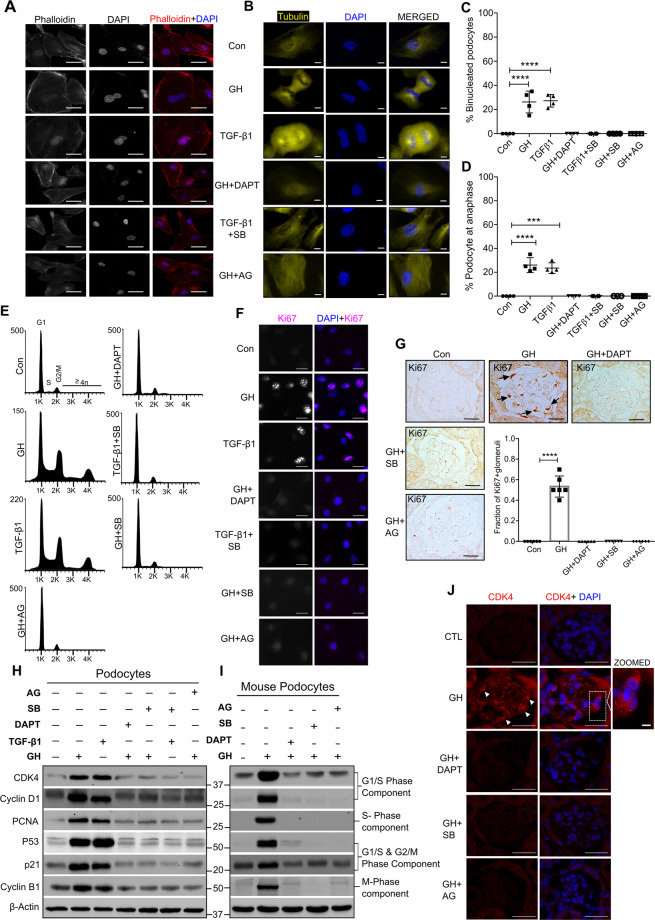
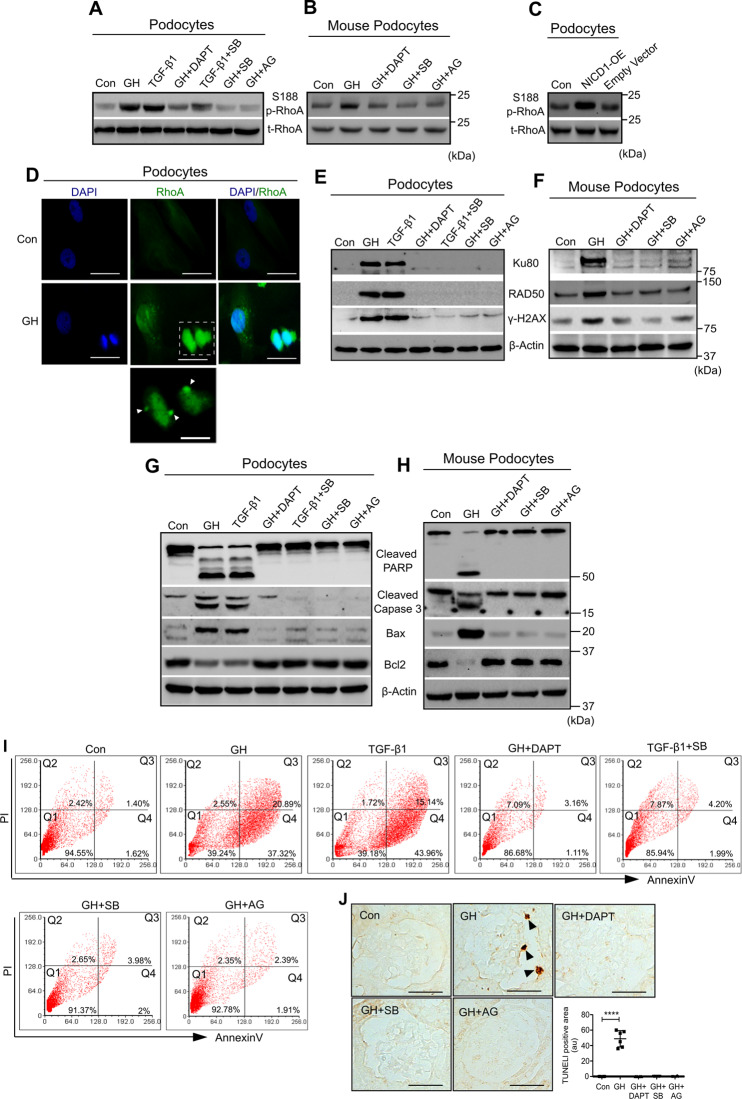
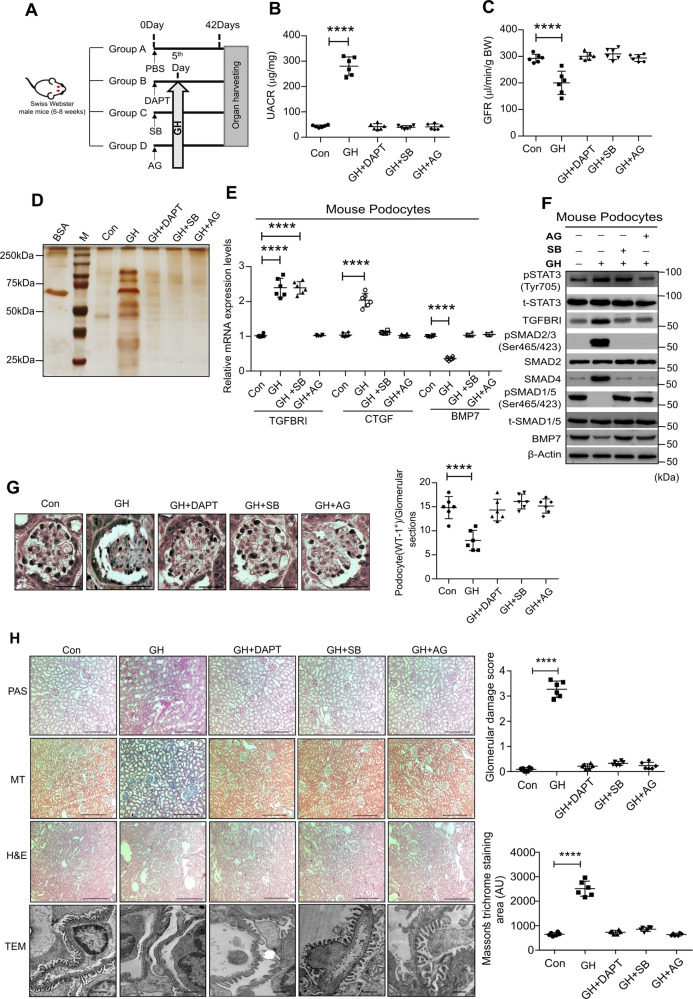
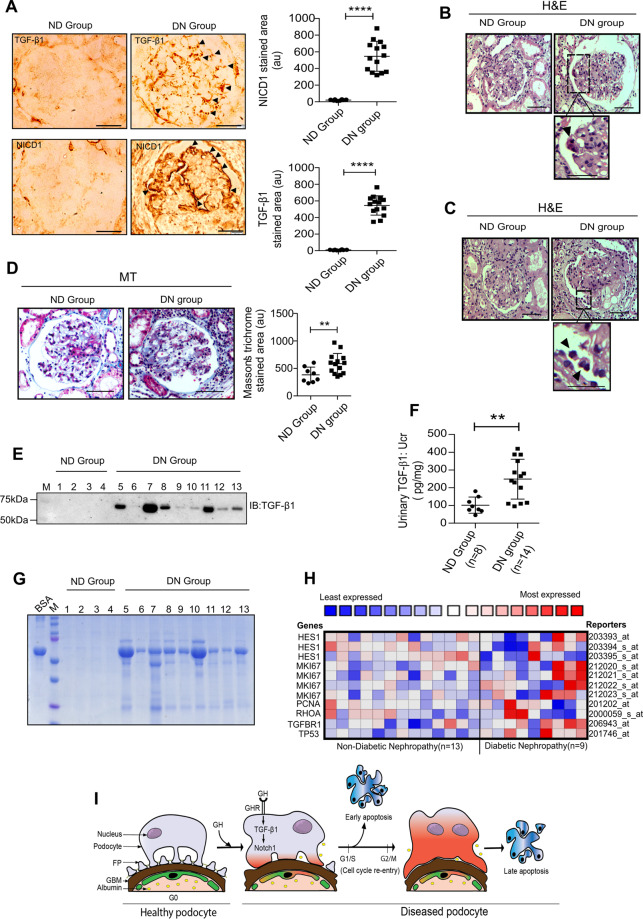
Glomerular podocytes are integral members of the glomerular filtration barrier in the kidney and are crucial for glomerular permselectivity. These highly differentiated cells are vulnerable to an array of noxious stimuli that prevail in several glomerular diseases. Elevated circulating growth hormone (GH) levels are associated with podocyte injury and proteinuria in diabetes. However, the precise mechanism(s) by which excess GH elicits podocytopathy remains to be elucidated. Previous studies have shown that podocytes express GH receptor (GHR) and induce Notch signaling when exposed to GH. In the present study, we demonstrated that GH induces TGF-β1 signaling and provokes cell cycle reentry of otherwise quiescent podocytes. Though differentiated podocytes reenter the cell cycle in response to GH and TGF-β1, they cannot accomplish cytokinesis, despite karyokinesis. Owing to this aberrant cell cycle event, GH- or TGF-β1-treated cells remain binucleated and undergo mitotic catastrophe. Importantly, inhibition of JAK2, TGFBR1 (TGF-β receptor 1), or Notch prevented cell cycle reentry of podocytes and protected them from mitotic catastrophe associated with cell death. Inhibition of Notch activation prevents GH-dependent podocyte injury and proteinuria. Similarly, attenuation of GHR expression abated Notch activation in podocytes. Kidney biopsy sections from patients with diabetic nephropathy (DN) show activation of Notch signaling and binucleated podocytes. These data indicate that excess GH induced TGF-β1-dependent Notch1 signaling contributes to the mitotic catastrophe of podocytes. This study highlights the role of aberrant GH signaling in podocytopathy and the potential application of TGF-β1 or Notch inhibitors, as a therapeutic agent for DN.


Conflict of interest statement

The authors declare no competing interests.

Figures

Fig. 1
Fig. 1. GH induces TGF-β/SMAD pathway in podocytes.
A, B qRT-PCR analysis showing the expression of TGF-β1 in human podocytes treated with or without GH in concentration (100–500 ng/ml) and time- (up to 48 h) dependent manner. mRNA levels were normalized to β-actin and presented as fold change on the y-axis. Mean ± SD. (n = 5). ****p < 0.0001 by one-way ANOVA post hoc Dunnett test. C, D Immunoblotting analysis for indicated genes from podocytes treated with GH in concentration (100–500 ng/ml) and time- (up to 48 h) dependent manner. (n = 3). E Immunofluorescence analysis for TGF-β1 (purple color) and counterstained with DAPI [4′,6-diamidino-2-phenylindole (blue color)] in podocytes treated with or without GH (500 ng/ml, 48 h). Scale bar = 50 μm, magnification ×500. F, G Estimation of TGF-β1 in conditioned media (CM) from podocytes treated with GH in concentration (100–500 ng/ml) and time- (up to 48 h) dependent manner. Mean ± SD. (n = 5). H, I SMAD4 luciferase activity in podocytes treated with GH in concentration (100–500 ng/ml) and time- (up to 48 h) dependent manner. Mean ± SD. (n = 6). FI ****p < 0.0001 by one-way ANOVA post hoc Dunnet test. J, K qRT-PCR and immunoblotting analysis show TGFBR1 and TGF-β1 in mice podocytes treated with or without GH (1.5 mg/kg b.w). Mean ± SD. (n = 3). ****p < 0.0001 by Student’s t test. Each data point represents the average value of mice from each group. n = 6. L Representative images for TGFBR1 and TGF-β1 expression assessed by 3,3′-diaminobenzidine (DAB) staining in mice glomerular sections treated with GH. Scale bar = 100 μm, magnification ×200. (n = 3). Quantification of TGF-βR1 and TGF-β1 staining area in the glomerulus (right panel) represented as a dot plot. Mean ± SD. (n = 6). ****p < 0.0001 by Student’s t test. M Quantification of TGF-β1 in urine from mice administered with GH. Mean ± SD. (n = 6). ****p < 0.0001 by Student’s t test. Each data point represents the average value of a single mouse from each group.
Fig. 2
Fig. 2. GH induces TGF-β/SMAD pathway-mediated Notch signaling in podocytes.
A qRT-PCR analysis showing the expression of Notch1 and Jag1 in human podocytes treated with or without a conditioned medium (CM; 50%) from podocytes treated with or without GH for 48 h. Mean ± SD. (n = 6). ****p < 0.0001 by Student’s t test. mRNA levels were normalized to β-actin and presented as fold change on the y-axis. B Immunoblotting analysis of podocytes treated with CM (50%) from podocytes treated with or without GH for 48 h. (n = 3). C Immunoblotting analysis for indicated genes in podocytes treated with or without GH (250 and 500 ng/ml), TGFβ-1 (5 ng/ml), GH (500 ng/ml) + SB431542 (100 nM/ml), and GH (500 ng/ml) + AG490 (10 μM/ml) for 48 h. (n = 3). n-NICD1 (nuclear-NICD1), n-HES1 (nuclear HES1), and n-HEY1(nuclear HEY1). D Podocytes transfected with siRNA targeting TGFBR1 or scramble RNA (Scr-RNA) were subjected to immunoblotting for indicated genes. (n = 3). E Immunofluorescence for the nuclear colocalization of NICD1 (red color), HES1 (purple color), and counterstained with DAPI (blue color) in podocytes treated with or without GH for 48 h. Magnification ×630. Scale bar = 20 μm. (n = 3). F HES1 reporter activity was measured in podocytes exposed to GH for 48 h. Mean ± SD. G qRT-PCR analysis for Notch1 and JAG1 in podocytes isolated from a mouse treated with or without GH (1.5 mg/kg b.w), GH + SB431542 (1 mg/kg b.w), and GH + AG490 (1 mg/kg b.w). Mean ± SD. (n = 6). F, G ****p < 0.0001 by one-way ANOVA post hoc Dunnett test (n = 6). H Representative immunoblots for indicated genes in podocytes isolated from mice treated with or without GH. (n = 3). β-Actin and lamin-B1 served as an internal control.
Fig. 3
Fig. 3. GH stimulates cell cycle reentry and binucleation in podocytes.
A, B Representative images of F-actin (green color), α-tubulin (yellow color), and counterstained with DAPI (blue color) staining in human podocytes treated with or without treatment for 48 h. Magnification ×630. Scale bar = 20 μm. (n = 3). C The graph represents the % of binucleated podocytes from the above experimental conditions. Mean ± SD. (n = 4). Each data point represents the average value of fifty cells. D The graph represents the % of podocytes accumulated in anaphase from the above experimental conditions. Mean ± SD. (n = 4). C, D ***p < 0.001 and ****p < 0.0001 by one-way ANOVA post hoc Dunnett test. Each data point represents the average value of fifty cells. E Cell cycle phases of podocytes from indicated experimental conditions (n = 4). F Immunofluorescence for the Ki67 (red color) and counterstained with DAPI (blue color). Magnification ×630. Scale bar = 20 μm. (n = 3). G Representative images of immunohistochemistry for anti-Ki67 expression by DAB staining in mice glomerular sections. Quantification of Ki67-postive glomeruli (right panel) where each dot represents the average value of ten glomeruli from each mouse. Black arrow indicates specific expression of Ki67 in podocytes. Magnification ×630. Scale bar = 20 μm. (n = 3). ****p < 0.0001 by one-way ANOVA post hoc Dunnett test. H, I Immunoblotting analysis in human podocytes and mice primary podocytes. (n = 3). J Representative images of immunostaining for CDK4 (red color) and counterstained with DAPI (blue color) in mice glomeruli. Magnification ×630. Scale bar = 20 μm. (n = 3). White arrowhead indicates specific expression of CDK4 in the podocyte.
Fig. 4
Fig. 4. GH-induced TGF-β leads to podocyte DNA damage and apoptosis.
A, B Immunoblotting analysis in human podocytes (treated for 48 h) and from mouse podocytes (n = 3). C Immunoblotting analysis in human podocytes ectopically expressing NICD1 (NICD1-OE). (n = 3). D Immunofluorescence for the RhoA (green color) and counterstained with DAPI (blue color) in human podocytes treated with GH for 48 h. Magnification ×630. Scale bar = 20 μm. (n = 3). White arrowhead indicates the delocalization of RhoA from midbody. EH Immunoblotting analysis in human podocytes (E, G) and mouse podocytes (F, H). (n = 3). I Human podocytes stained with FITC-Annexin V and PI and analyzed by flow cytometry. (n = 4). The values of the representative histograms indicate the percentage of podocytes in the lower left quadrant (live cells), lower right quadrant (early apoptosis), upper right quadrant (late apoptosis), and upper left quadrant (necrotic cells). (n = 3). J Representative TUNEL (terminal deoxynucleotidyl transferase dUTP nick-end labeling) staining by DAB in mice glomerular sections. Quantification of TUNEL-postive glomeruli (right panel), where each dot represents the average value of ten glomeruli from each mouse. Magnification ×630, Scale bar = 20 μm. (n = 3). ****p < 0.0001 by one-way ANOVA post hoc Dunnett test. β-Actin served as an internal control.
Fig. 5
Fig. 5. Blockade of GHR and TGFβR1 protects mice from GH-induced proteinuria.
A Schematic presentation of mouse experimentation. B Urinary albumin creatinine ratio (UACR) and C glomerular filtration rate (GFR) was estimated in the experimental mice. Mean ± SD. ****p < 0.0001 by one-way ANOVA post hoc Dunnett test. Each dot represents the average value of three independent experiments from a single mouse. D Silver staining was performed to the urine samples from the mice. n = 3. BSA bovine serum albumin, M protein standard marker. E qRT-PCR analysis in mouse podocytes from control and treatment groups. Mean ± SD. ****p < 0.0001 by one-way ANOVA post hoc Dunnett test. Each data point represents the average value of three independent analysis from each mouse (n = 6). F Immunoblotting analysis in mouse podocytes from control and treatment groups. (n = 3). G Representative images of immunohistochemical staining for anti-WT1 (podocytes) by DAB in the glomerulus sections from control and treatment groups. Magnification ×630, Scale bar = 20 μm. (n = 3). The average number of WT1 + cells (right panel) in the mice glomerulus was quantified using ImageJ (NIH). Mean ± SD. ****p < 0.0001 by one-way ANOVA post hoc Dunnett test. Each data point represents the average value of three independent experiments from each mouse (n = 6). H Representative image of PAS (periodic acid–Schiff), MT (Masson’s trichrome), and H&E (hematoxylin and eosin) staining of glomeruli, and TEM (transmission electron microscopy) imaging of podocytes. Magnification ×100. Scale bar = 100 μm, TEM scale bar 1 μm. Glomerular damage score and MT-stained area (right panel) were quantified using ImageJ (NIH) and prepesnted as a dot plot, where each dot represents the average value of ten glomeruli from each mouse (n = 6). Mean ± SD. ****p < 0.0001 by one-way ANOVA post hoc Dunnett test.
Fig. 6
Fig. 6. Elevated TGF-β1 signaling and proteinuria correlated in people with DN.
A Representative images of immunohistochemical staining for TGFβ-1 and NICD1 by DAB in the glomerulus sections from nondiabetic (ND; n = 8) and diabetic nephropathy (DN; n = 14) patients. Magnification ×630. Scale bar = 20 μm. (n = 3). NICD1 and TGF-β1-stained area in glomerulus (right panel) were quantified using ImageJ (NIH) and presented as a dot plot. Mean ± SD. ****p < 0.0001 by Student’s t test. B, C Representative image of H&E stain in glomerular sections from ND and DN groups. Black arrowhead indicates binucleated and detached podocyte. Magnification ×630. Scale bar = 20 μm. Zoomed picture emphasizes a binucleated and detached podocyte. D Representative image of MT stain in glomerular sections from ND and DN groups. Magnification ×630. Scale bar = 20 μm. MT-stained area in glomerulus was quantified using ImageJ (NIH) and presented as a dot plot. Mean ± SD. ****p < 0.0001 by Student’s t test. E Immunoblotting analysis for TGF-β1 in the urine samples from ND (n = 4) and DN groups (n = 9). IB immunoblot. F Quantification of TGF-β1 in the urine samples from ND (n = 8) and DN (n = 14) groups. Mean ± SD. **p < 0.001 by Student’s t test. G Urine samples from ND (n = 4) and DN (n = 9) were resolved on SDS–PAGE and stained with Coomassie Blue. BSA bovine serum albumin, M protein standard marker. H Nephroseq (www.nephroseq.org) analysis comparing HES1, MIKI67, PCNA, RHOA, TGFBR1, and TP53 expression levels in ND (n = 13) versus DN (N = 9) in Woroniecka diabetes of glomerular tissue. Data indicate that the expression of these genes increased >1.5-fold in the DN. I Schematic illustration of GH action on podocyte cell cycle entry and apoptosis via TGF-β1-mediated Notch1 activation.

Similar articles

Cited by

References

    1. Kriz W, Hahnel B, Hosser H, Rosener S, Waldherr R. Structural analysis of how podocytes detach from the glomerular basement membrane under hypertrophic stress. Front. Endocrinol. 2014;5:207. doi: 10.3389/fendo.2014.00207. - DOI - PMC - PubMed
    1. Andeen NK, Nguyen TQ, Steegh F, Hudkins KL, Najafian B, Alpers CE. The phenotypes of podocytes and parietal epithelial cells may overlap in diabetic nephropathy. Kidney Int. 2015;88:1099–1107. doi: 10.1038/ki.2015.273. - DOI - PMC - PubMed
    1. Marshall CB, Shankland SJ. Cell cycle and glomerular disease: a minireview. Nephron Exp. Nephrol. 2006;102:e39–48. doi: 10.1159/000088400. - DOI - PubMed
    1. Pavenstadt H, Kriz W, Kretzler M. Cell biology of the glomerular podocyte. Physiol. Rev. 2003;83:253–307. doi: 10.1152/physrev.00020.2002. - DOI - PubMed
    1. Herlihy OM, Perros P. Elevated serum growth hormone in a patient with type 1 diabetes: a diagnostic dilemma. Diabetes Metab. Res. Rev. 2000;16:211–216. doi: 10.1002/1520-7560(200005/06)16:3<211::AID-DMRR118>3.0.CO;2-S. - DOI - PubMed

Publication types

MeSH terms