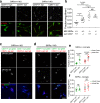
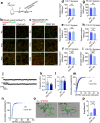
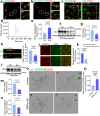
. 2021 Apr 1;12(1):2030.
doi: 10.1038/s41467-021-22301-1.

Loss of microglial SIRPα promotes synaptic pruning in preclinical models of neurodegeneration

Affiliations

Loss of microglial SIRPα promotes synaptic pruning in preclinical models of neurodegeneration

Xin Ding et al. Nat Commun. .

Abstract

Microglia play a key role in regulating synaptic remodeling in the central nervous system. Activation of classical complement pathway promotes microglia-mediated synaptic pruning during development and disease. CD47 protects synapses from excessive pruning during development, implicating microglial SIRPα, a CD47 receptor, in synaptic remodeling. However, the role of microglial SIRPα in synaptic pruning in disease remains unclear. Here, using conditional knock-out mice, we show that microglia-specific deletion of SIRPα results in decreased synaptic density. In human tissue, we observe that microglial SIRPα expression declines alongside the progression of Alzheimer's disease. To investigate the role of SIRPα in neurodegeneration, we modulate the expression of microglial SIRPα in mouse models of Alzheimer's disease. Loss of microglial SIRPα results in increased synaptic loss mediated by microglia engulfment and enhanced cognitive impairment. Together, these results suggest that microglial SIRPα regulates synaptic pruning in neurodegeneration.


Conflict of interest statement

The authors declare no competing interests.

Figures
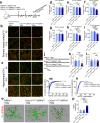
Fig. 1
Fig. 1. Synaptic density in microglial SIRPα deficient mice is lower on account of increased microglial engulfment of synaptic structures.
a Schematics of the experimental procedures. IF immunofluorescence, mEPSC miniature excitatory postsynaptic current, TAM tamoxifen, P postnatal. Neonatal mice were injected 50 μg tamoxifen at P1, P2, and P3. b, c Representative confocal images depict synaptic staining for presynaptic marker Vglut1 (green) and postsynaptic marker Homer1 (red) in primary visual cortex (V1) (b) or hippocampal CA1 stratum radiatum (c) in SIRPαfl/fl (+TAM), Cx3cr1CreERT2:SIRPαfl/fl (−TAM), and Cx3cr1CreERT2:SIRPαfl/fl (+TAM) mice at different time points. Synaptic number was quantified as colocalized pre- and postsynaptic puncta. Scale bar, 10 μm. di Histograms depict synaptic density in V1 (df) or hippocampal CA1 (gi) in those mice. n = 5 mice/group; average of 10–12 fields from each mouse. One-way ANOVA analysis with Dunnett’s multiple comparisons test. j Example traces of mEPSCs (miniature excitatory postsynaptic currents) from SIRPαfl/fl (+TAM), Cx3cr1CreERT2:SIRPαfl/fl (−TAM), and Cx3cr1CreERT2:SIRPαfl/fl (+TAM) mice. k, l Histogram shows average mEPSC frequency (k) and amplitude (l) of SIRPαfl/fl (+TAM), Cx3cr1CreERT2:SIRPαfl/fl (−TAM), and Cx3cr1CreERT2:SIRPαfl/fl (+TAM) mice. n = 14, 12, 13 cells/group from 4 to 5 mice. One-way ANOVA analysis with Dunnett’s multiple comparisons test. m, n Cumulative probability distributions of mEPSC inter-event intervals (m) and amplitude (n) of SIRPαfl/fl (+TAM), Cx3cr1CreERT2:SIRPαfl/fl (−TAM) and Cx3cr1CreERT2:SIRPαfl/fl (+TAM) mice. o, p Three-dimensional reconstruction and surface rendering demonstrate larger volumes of PSD95 puncta inside Iba-1 positive microglia in V1 from P28 Cx3cr1CreERT2:SIRPαfl/fl (+TAM) mice. n = 7 mice/group, average of 8–9 microglia from each mouse, one-way ANOVA analysis with Dunnett’s multiple comparisons test. Grid line increments = 5 μm. Data are mean ± s.e.m. **P < 0.01, ***P < 0.001, NS not significant. Detailed statistical information was listed in Supplementary Statistical Data. Source data are provided as a Source Data file.
Fig. 2
Fig. 2. Primary cultured SIRPα deficient microglia engulf more synaptic elements.
a Diagrams show neuron-microglia co-cultures (a′ and a″) and Sholl analyses (a″′) that quantifies synaptic puncta around microglia. Green cells in diagrams represent neurons (MAP2+), red puncta represent synaptic marker (SPH/PSD95), and blue cells represent microglia (Iba-1+). bd Confocal images (b) show the presence of synaptic puncta (SPH+/PSD95+) around SIRPα+/+ or SIRPα−/− microglia (Iba1+). Scale bar, 50 μm. Statistical analysis for Syanptophysin (c) or PSD95 density (d) is obtained by two-way ANOVA; n = 5 independent experiments. eg 3D reconstruction and surface rendering demonstrate that SIRPα−/− microglia engulf more synaptic elements. Grid line increments = 5 μm. Histograms depict the statistics of synaptic engulfment. Two-tailed unpaired t-test, n = 5 independent experiments, average of 3–4 microglia from each experiment. SPH synaptophysin, MG microglia. Data are mean ± s.e.m. ***P < 0.001. Detailed statistical information was listed in Supplementary Statistical Data. Source data are provided as a Source Data file.
Fig. 3
Fig. 3. SIRPα deficient microglia show increased phagocytic activity.
a Representative images show that primary cultured microglia (SIRPα+/+, SIRPα−/−) phagocytosed pHrodo red-conjugated synaptosomes (CD47+/+, CD47−/−). Scale bar, 50 μm. b Graph depicts the fraction of synaptosomes engulfed by microglia of different genotypes. n = 9 wells; average of 5–6 fields from each well. One-way ANOVA analyses followed by Tukey’s multiple comparison test. c, d Representative images show that CX3CR1 labeled SIRPα+/+ (c) or SIRPα−/− (d) microglia engulfed a mixture of synaptosomes (CD47+/+:CD47−/− = 1:1) conjugated with pHrodo-red or pHrodo-green respectively. Scale bar, 50 μm. e, f Graph depicts the fraction of synaptosomes engulfed by SIRPα+/+ (e) or SIRPα−/− (f) microglia for each combination of pHrodo color. n = 10 wells; average of 5–6 fields from each well. Data were analyzed by two-way ANOVA analysis via Sidak’s multiple comparisons test. Data are mean ± s.e.m. *P < 0.05, ***P < 0.001, NS not significant. Detailed statistical information was listed in Supplementary Statistical Data. Source data are provided as a Source Data file.
Fig. 4
Fig. 4. Synaptic density in CD47-KO mice is lower on account of enhanced microglial engulfment of synaptic structures.
a Schematics of the experimental procedures. IF immunofluorescence, mEPSC miniature excitatory postsynaptic current. b, c Representative confocal images depict synaptic staining for presynaptic marker Vglut1 (green) and postsynaptic marker Homer1 (red) in primary visual cortex (V1) (b) and hippocampal CA1 stratum radiatum (c) in WT and CD47-KO mice at different time points. Synaptic number was quantified as colocalized pre- and postsynaptic puncta. Scale bars, 10 μm. di Histograms depict the relative level of synaptic density in V1 (df) or hippocampal CA1 (gi) in those mice. n = 5 mice/group; average of 10–12 fields from each mouse, two-tailed unpaired t test. j Example traces of mEPSCs from WT and CD47-KO mice. k, l Histogram shows average mEPSC frequency (k) and amplitude (l) of WT and CD47-KO mice. n = 18, 15 cells from 6 to 8 mice, two-tailed unpaired t test. m, n Cumulative probability distributions of mEPSC inter-event intervals (m) and amplitude (n) of WT and CD47-KO mice. o, p 3D reconstruction and surface rendering demonstrate larger volumes of PSD95 puncta inside Iba-1 positive microglia in V1 from P28 CD47-KO mice versus WT mice. n = 6 mice/group, average of 8–9 microglia from each mouse, two-tailed unpaired t test. Grid line increments = 5 μm. Data are mean ± s.e.m. **P < 0.01, ***P < 0.001, NS not significant. Detailed statistical information was listed in Supplementary Statistical Data. Source data are provided as a Source Data file.
Fig. 5
Fig. 5. CD47 is expressed in synapses and regulated by neural activity.
a, b Confocal images show CD47 co-expression with presynaptic marker (synaptophysin, SPH) or postsynaptic marker (PSD95) in primary neurons. (a″) CD47+/PSD95+ puncta are marked by circle; (a′″) CD47/PSD95+ puncta are marked by dashed circle; (b′) CD47+/SPH95+ puncta are marked by circle; (b″) CD47+/SPH95+ puncta are marked by dashed circle; Scale bars, (a′, b′) 20 μm; (a′″, b′″) 5 μm. This experiment was repeated independently for three times. c Orthogonal views of CD47/PSD95 (postsynaptic marker) or CD47/Vglut1 (presynaptic marker) double staining in brain section in P28 mice, CD47+ or CD47 synaptic elements were marked by circleor dashed circle. Scale bar, 1 μm. This experiment was repeated independently for three times. d Nanosight shows size range of synaptosomes passed through membrane filters (pore size 0.45 μm). e Synaptosomes conjugated with CD47-FITC antibody are quantified by Nanosight and the relative level of CD47+ synaptosomes in adult mice is significantly increased compared to that in newborn mice. n = 6 mice/group, two-tailed unpaired t test. f, g Western blot analysis of primary neurons shows that neuronal CD47 expression was downregulated after TTX treatment (1 μM for 48 h). n = 3 independent experiments, two-tailed unpaired t test. h, i Representative images and statistical analysis show the percentage of CD47+ synaptic structures (CD47+ PSD95 puncta/total PSD95 puncta) was reduced in TTX (tetrodotoxin) treated neurons. Scale bar, 20 μm. n = 3 independent experiments, average 6–7 fields from each assay; two-tailed unpaired t test. j, k Representative images and statistical analysis demonstrate that CD47 level decreased in neuron expressing the inhibitory DREADD-hM4Di in response to CNO stimulation. AAV-hSyn-hM4D(Gi)-mCherry or control virus (100 nL, 1.25 × 1013 GC/mL) was injected into mouse primary visual cortex, 4 weeks later mice were subjected to Clozapine-N-oxide (CNO) administration for 3 consecutive days. Scale bar, 20 μm; n = 5 mice/group, average of 8–10 fields from each mouse, two-tailed unpaired t test. l, m Western blot analysis of synaptosomes isolated from isoflurane (iso) treated mice also shows reduction of CD47 compared to control mice, n = 3 mice/group, two-tailed unpaired t test. n Nanosight detection reveals that relative level of CD47+ synaptosomes isolated from isoflurane (iso) treated mice is significantly reduced. n = 7 mice/group, unpaired t test. o Left panels show CD47+ or PSD95+ signal inside microglia from SIRPα-cKO and control mice (i and iii); right panels (ii and iv) show CD47 and PSD95 colocalized puncta inside cells. Insets are enlarged images with orthogonal plane of typical CD47+/PSD95+ puncta. Grid line increments = 5 μm. p Histogram shows volume ratio of CD47+/PSD95+ puncta to total synaptic structures, n = 6, 7 mice/group, average of 8–9 cell from each mouse, two-tailed unpaired t test. Data are mean ± s.e.m. *P < 0.05, **P < 0.01, ***P < 0.001, NS not significant. Detailed statistical information was listed in Supplementary Statistical Data. Source data are provided as a Source Data file.
Fig. 6
Fig. 6. Microglial SIRPα is downregulated in AD pathology.
a, b Western blot and statistical analysis show SIRPα expression decreased remarkably in the cortex of AD patients. Non-AD = 4, AD patients=5. Two-tailed unpaired t test. Detailed sample information is listed in the Table 1 in Methods section. c, d Flow cytometry analysis displays SIRPα expression of acute isolated microglia from 2-months, 5-months, and 8-months old WT and AD mice. Histograms represent quantification of geometric mean fluorescent intensity (gMFI) of SIRPα. n = 5 mice/group, average of three tests from each mouse, two-way ANOVA via Sidak’s multiple comparisons test. e, f Immunostaining and quantification of SIRPα with microglial marker (Iba-1) in cortex of WT and AD mice (5 months old). Scale bar, 25 μm, n = 5 mice/group; average of 6–8 fields from each mouse, two-tailed unpaired t test. g, h Western blot and statistical analysis of SIRPα protein level in primary cultured microglia after Aβ42 monomer (Aβm) or Aβ42 oligomer (Aβo) treatment. Cells were treated with 0.2 µM Aβ for 24 h before protein analysis. n = 5 experiments, one-way ANOVA, Dunnett’s multiple comparisons test. i, j Flow cytometry analysis shows microglial SIRPα decreased 3 days after intracerebroventricular (ICV) injection of Aβo (2 μg/mouse). Histogram shows the gMFI quantification of microglial SIRPα. n = 5 mice/group (WT male, 3 months age), average of three tests from each mouse. One-way ANOVA analysis with Dunnett’s multiple comparisons test. Data are mean ± s.e.m. *P < 0.05, ***P < 0.001, NS not significant. Detailed statistical information was listed in Supplementary Statistical Data. Source data are provided as a Source Data file.
Fig. 7
Fig. 7. SIRPα deficiency enhanced cognitive impairment and synaptic loss without modifying Aβ plaque depositions.
a Schematics of the experimental procedures, Cx3cr1CreERT2:SIRPαfl/fl (-TAM) mice are used as normal control. TAM tamoxifen. b Histograms depict that total distance mice traveled in open filed experiment has no significant difference. 5 M: n = 13, 14, 15, 15 mice/group; 8M: n = 10, 12, 10, 12 mice/group, one-way ANOVA, by Dunnett’s multiple comparisons test. c Histograms depict escape latency of four different groups of mice in visible platform test (time to find the visible platform) before plaque deposition (5 months old) and after plaque deposition (8 months old). 5M: n = 13, 14, 15, 15 mice/group; 8 M: n = 10, 12, 10,12 mice/group, one-way ANOVA, by Dunnett’s multiple comparisons test. d Line charts show Morris Water Maze escape latency (time to find the hidden platform) in five consecutive days of four different genotypic mice at the age of 5 months old and 8 months old respectively. 5M: n = 13, 14, 15, 15 mice/group; 8M: n = 10, 12, 10, 12 mice/group, two-way RM ANOVA, via Tukey’s multiple comparisons test. e Histograms depict the time spent in target quadrant in Morris Water Maze probe trial of four different genotypic mice at the age of 5 months old or 8 months old. 5M: n = 13, 14, 15, 15 mice/group, Kruskal–Wallis test via Dunn’s multiple comparisons test; 8M: n = 10, 12, 10, 12 mice/group, one-way ANOVA via Dunnett’s multiple comparisons test. f, g Representative immunostaining images exhibit 6E10 positive plaques in cortex and hippocampus of 8-months-old AD and AD/SIRPα-cKO mice. Scale bar, 200 μm. Quantification analyses show that 6E10 positive plaques in AD and AD/SIRPα-cKO mice were equivalent. n = 5, 7 mice/group; average of 5–6 fields from each mouse, two-tailed unpaired t-test. h, i ELISA analyses of both soluble and insoluble Aβ42 in 5-months-old and 8-months-old AD and AD/SIRPα-cKO mice brain. n = 8 mice/group, two-tailed unpaired t-test. j, k Representative images of 6E10 immunoreactive plaques (diameter 20–50 μm as small groups; 50–80 μm as big group) surrounded by microglia in 8-months-old AD and AD/SIRPα KO mice. Scale bar, 25 μm. Histograms show the area ratio of Iba-1/6E10 are comparable in AD and AD/SIRPα-cKO mice. n = 5, 7 mice/group. Average of 3–4 plaques from each mouse, two-tailed unpaired t-test. l, m Representative confocal images depict synaptic staining for presynaptic marker Synapsin I (green) and postsynaptic marker PSD95 (red) in cortex of 5-months-old and 8-months-old mice. Synaptic number was determined as colocalized pre- and postsynaptic puncta. Scale bars, 10 μm. n = 5, 5, 7, 7 mice/group, average of 10–12 fields from each mouse, one-way ANOVA via Dunnett’s multiple comparisons test. n, o Golgi staining images of apical dendritic spine in cortex of 5-months-old and 8-months-old mice. Scale bars, 20 μm. n = 5, 5, 7, 7 mice/group, average of 10 dendrites from each mouse; one-way ANOVA via Dunnett’s multiple comparisons test. Data are mean ± s.e.m. *P < 0.05, **P < 0.01, ***P < 0.001, NS not significant. Detailed statistical information was listed in Supplementary Statistical Data. Source data are provided as a Source Data file.
Fig. 8
Fig. 8. Inhibition of microglial SIRPα increased Aβo-induced synapse loss by promoting microglia-mediated synaptic elimination.
a Schematics of the experimental procedures, Cx3cr1CreERT2:SIRPαfl/fl (-TAM) mice are used as normal control. ICV intracerebroventricular, FC flow cytometry, TAM tamoxifen. b, c Representative confocal images (b) depict synaptic staining for presynaptic marker Synapsin I (red) and postsynaptic marker PSD95 (green) in cortex, Scale bars, 10 μm. Aβm, Aβ42 monomer; Aβo, Aβ42 oligomer. The histogram c displays the quantification of synaptic density in these mice. n = 5 mice/group (male, 3 months age), average of 6–8 fields from each mouse. One-way ANOVA, by Tukey’s multiple comparison test. d, e 3D reconstruction and surface rendering demonstrate larger volumes of PSD95+ puncta inside Iba-1+ microglia in cortex from SIRPα-cKO mice versus control mice after Aβo stimulation (2 μg/mouse), Grid line increments = 5 μm. n = 8 mice/group, average of 8–9 microglia from each mouse, two-tailed unpaired t test. f, g Flow cytometry analysis of synaptic material (PSD95+) engulfed by microglia in SIRPα-cKO or control mice after Aβo injection. n = 3 mice/group, average of three tests from each mouse, two-tailed unpaired t test. Data are mean ± s.e.m. *P < 0.05, **P < 0.01, ***P < 0.001, NS not significant. Detailed statistical information was listed in Supplementary Statistical Data. Source data are provided as a Source Data file.

References

    1. Kettenmann H, Kirchhoff F, Verkhratsky A. Microglia: new roles for the synaptic stripper. Neuron. 2013;77:10–18. doi: 10.1016/j.neuron.2012.12.023. - DOI - PubMed
    1. Paolicelli RC, et al. Synaptic pruning by microglia is necessary for normal brain development. Science. 2011;333:1456–1458. doi: 10.1126/science.1202529. - DOI - PubMed
    1. Schafer DP, et al. Microglia sculpt postnatal neural circuits in an activity and complement-dependent manner. Neuron. 2012;74:691–705. doi: 10.1016/j.neuron.2012.03.026. - DOI - PMC - PubMed
    1. Kim HJ, et al. Deficient autophagy in microglia impairs synaptic pruning and causes social behavioral defects. Mol. Psychiatry. 2017;22:1576–1584. doi: 10.1038/mp.2016.103. - DOI - PMC - PubMed
    1. Zhan Y, et al. Deficient neuron-microglia signaling results in impaired functional brain connectivity and social behavior. Nat. Neurosci. 2014;17:400–406. doi: 10.1038/nn.3641. - DOI - PubMed

Publication types

MeSH terms

Substances