. 2021 Apr 1;12(1):2037.
doi: 10.1038/s41467-021-22236-7.

Systems serology detects functionally distinct coronavirus antibody features in children and elderly

Affiliations

Systems serology detects functionally distinct coronavirus antibody features in children and elderly

Kevin J Selva et al. Nat Commun. .

Abstract

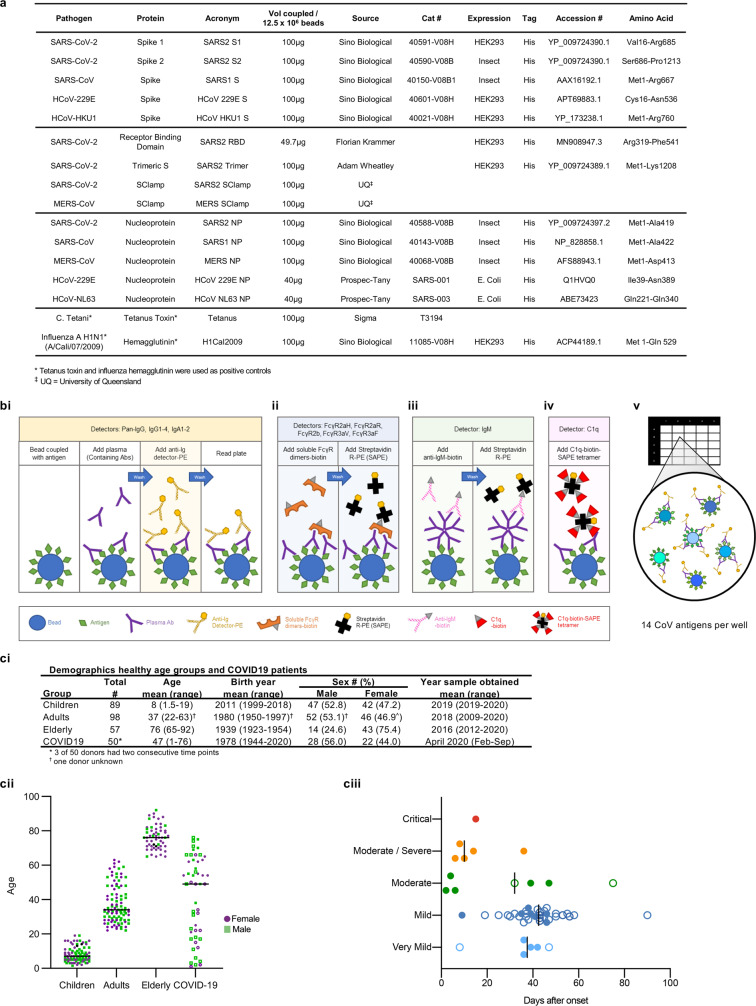
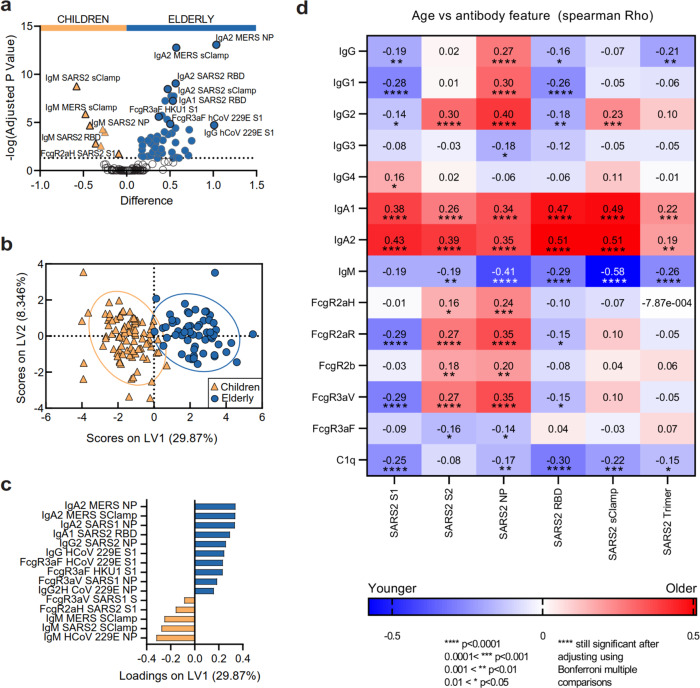
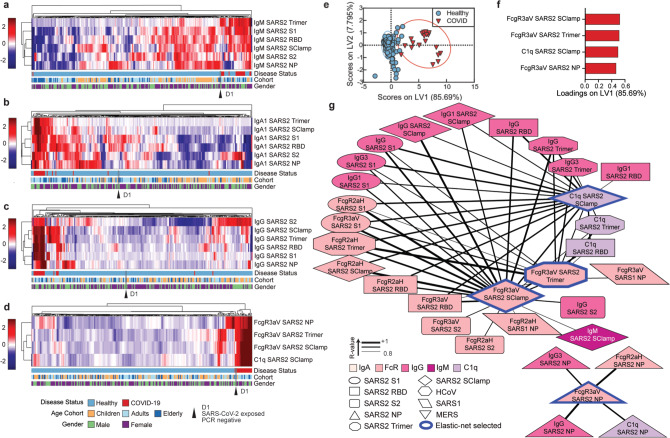
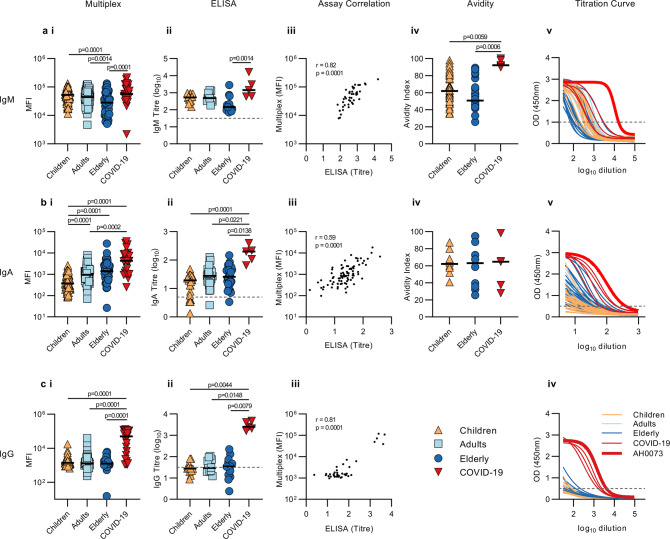
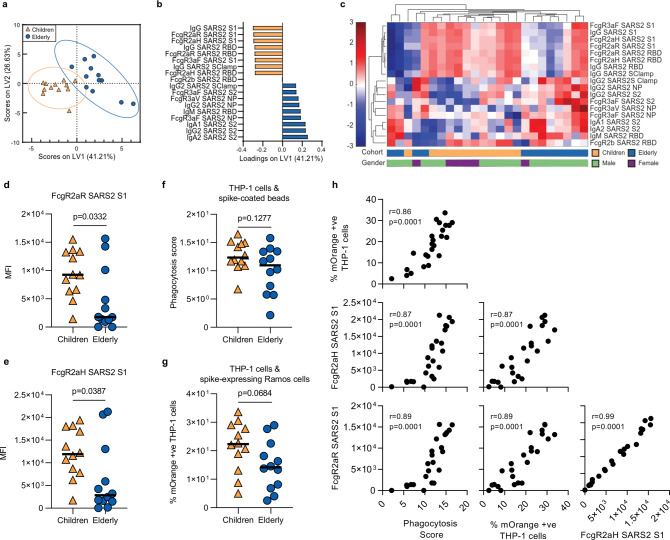
The hallmarks of COVID-19 are higher pathogenicity and mortality in the elderly compared to children. Examining baseline SARS-CoV-2 cross-reactive immunological responses, induced by circulating human coronaviruses (hCoVs), is needed to understand such divergent clinical outcomes. Here we show analysis of coronavirus antibody responses of pre-pandemic healthy children (n = 89), adults (n = 98), elderly (n = 57), and COVID-19 patients (n = 50) by systems serology. Moderate levels of cross-reactive, but non-neutralizing, SARS-CoV-2 antibodies are detected in pre-pandemic healthy individuals. SARS-CoV-2 antigen-specific Fcγ receptor binding accurately distinguishes COVID-19 patients from healthy individuals, suggesting that SARS-CoV-2 infection induces qualitative changes to antibody Fc, enhancing Fcγ receptor engagement. Higher cross-reactive SARS-CoV-2 IgA and IgG are observed in healthy elderly, while healthy children display elevated SARS-CoV-2 IgM, suggesting that children have fewer hCoV exposures, resulting in less-experienced but more polyreactive humoral immunity. Age-dependent analysis of COVID-19 patients, confirms elevated class-switched antibodies in elderly, while children have stronger Fc responses which we demonstrate are functionally different. These insights will inform COVID-19 vaccination strategies, improved serological diagnostics and therapeutics.


Conflict of interest statement

The authors declare no competing interests.

Figures

Fig. 1
Fig. 1. Cohort information and setup of the custom CoV multiplex.
a Details of antigens included in the assay. b Overview of bead-based multiplex assay. Assay setup for detectors Pan-IgG, IgG1-4, IgA1-2 (b-i), FcγR2aH, FcγR2aR, FcγR2b, FcγR3aV, FcγR3aF (b-ii), IgM (b-iii) and C1q (b-iv). FcγR2aH and FcγR3aV are the high-affinity variants of the dimers, while FcγR2aR and FcγR3aF are the respective low-affinity dimer variants. (b-v) Beads coupled to respective CoV antigens are added together into wells of a 384-well plate for multiplexing. c Overview of the demographics in the healthy donors per age group and COVID-19 patients.
Fig. 2
Fig. 2. Vastly different SARS-CoV-2 serological signatures between healthy children and elderly.
a Volcano plot of healthy children (orange) versus elderly (dark blue), open circles are not significantly different between two groups. Data were z-scored prior to analysis. b PCA of all 196 Ab features for healthy children, adults (light-blue square) and elderly. PLSDA scores (c) and loadings plots (d). Two-tailed Spearman correlation was performed to associate age with the strength of Ab features against the six SARS-CoV-2 antigens. Multiplex assays were repeated in duplicates.
Fig. 3
Fig. 3. Healthy children and elderly have differing correlation networks.
Correlation network analyses for healthy children (a) and elderly (b) identify features associated with the Elastic-Net-selected features (blue outline). Coded by Ab feature type (colour), antigen (shape) and correlation coefficient (line thickness).
Fig. 4
Fig. 4. Healthy versus COVID-19 serological signatures.
Hierarchical clustering of all SARS-CoV-2 antigens for IgM (a), IgA1 (b) and IgG (c). Levels are coloured from low (dark blue) to high (dark red). Hierarchical clustering (d) and PLSDA model scores (e) and loadings (f) were performed using the four-feature Elastic-Net-selected SARS-CoV-2 antigen signature (98.51% calibration accuracy, 98.51% cross-validation accuracy). Variance explained by each LV is in parentheses. g Correlation network analysis for COVID-19 patients was performed to identify features significantly associated with the Elastic-Net-selected features (blue outline). Coded by Ab feature type (colour), antigen (shape) and correlation coefficient (line thickness). Data were z-scored prior to analysis. Multiplex assays were repeated in duplicates.
Fig. 5
Fig. 5. Receptor binding domain Abs in healthy versus COVID-19 patients.
Multiplex MFI data for IgM (a-i), IgA (b-i) and IgG (c-i); ELISA endpoint titres for IgM (a-ii), IgA (b-ii) and IgG (c-ii); and their respective correlations (ac iii). Avidity index following urea dissociation for IgM (a-iv) and IgA (b-iv). Children (orange), adults (light blue), elderly (dark blue) and COVID-19 patients (red). Bar indicates the median response of each group. Statistical significance was determined using one-way ANOVA (Kruskal-Wallis with Dunn’s multiple comparisons), exact p-values were provided. Serial dilutions of plasma from healthy children (n = 14) (orange), 12 adults (n = 12) (light blue), 14 elderly (n = 14) (dark blue) and 5 COVID-19 patients (red) tested in IgM (a-v), IgA (b-v) and IgG (c-iv) ELISA. Bold red line represents COVID-19 patient AH0073 who was used as a positive control in all multiplex and ELISA plates. Dashed lines represent cut-offs (15% of positive control for IgA and IgG; 30% for IgM) used to interpolate endpoint titres by non-linear regression analysis. ELISA and multiplex assays were repeated in duplicates.
Fig. 6
Fig. 6. COVID-19 Ab responses in COVID-19-positive children and elderly.
PLSDA scores (a) and loadings (b) plots for the children (n = 12) (orange) and elderly (n = 12) (dark blue) with an Elastic-Net-selected 18-feature signature (100.00% calibration accuracy, 91.37% cross-validation accuracy). Hierarchical clustering was performed using the 18-feature signature for the children and elderly cohorts (c). S1-specific antibody engagement of FcγRIIaR (d) and FcγRIIaR (e) were amongst the strongest features in the PLSDA loadings plot (b) and are significantly elevated in children (Supplementary Data 5 describes all comparisons between children and elderly). THP-1 monocyte cell line antibody-mediated uptake of spike-coated bead assay (f) and spike-expressing target cell assay (g). Statistical significance was calculated using the two-tailed Mann-Whitney U test and exact p-values were reported. S1-specific antibody engagement of FcγRIIaR, FcγRIIaR and the two THP-1 SARS-CoV2 spike Fc effector assays highly correlate with each other, as measured by two-tailed Spearman correlation (h). Multiplex assays were repeated in duplicates.

References

    1. Li Q, et al. Early transmission dynamics in Wuhan, China, of novel coronavirus-infected pneumonia. N. Engl. J. Med. 2020;382:1199–1207. doi: 10.1056/NEJMoa2001316. - DOI - PMC - PubMed
    1. Center for Systems Science and Engineering at Johns Hookins University. COVID-19 Dashboard. https://coronavirus.jhu.edu/map.html. Accessed 01 Jun 2020.
    1. Wu Z, McGoogan JM. Characteristics of and important lessons from the coronavirus disease 2019 (COVID-19) outbreak in China: summary of a report of 72314 cases from the Chinese Center for Disease Control and Prevention. JAMA. 2020;323:1239–1242. doi: 10.1001/jama.2020.2648. - DOI - PubMed
    1. Team, C.C.-R. Severe outcomes among patients with coronavirus disease 2019 (COVID-19)—United States, February 12–March 16, 2020. MMWR Morb. Mortal. Wkly Rep. 2020;69:343–346. doi: 10.15585/mmwr.mm6912e2. - DOI - PMC - PubMed
    1. Short KR, Kedzierska K, van de Sandt CE. Back to the future: lessons learned from the 1918 influenza pandemic. Front. Cell Infect. Microbiol. 2018;8:343. doi: 10.3389/fcimb.2018.00343. - DOI - PMC - PubMed

Publication types

MeSH terms

LinkOut - more resources