. 2021 Apr 1;11(1):7325.
doi: 10.1038/s41598-021-86843-6.

A cell-specific regulatory region of the human ABO blood group gene regulates the neighborhood gene encoding odorant binding protein 2B

Affiliations

A cell-specific regulatory region of the human ABO blood group gene regulates the neighborhood gene encoding odorant binding protein 2B

Rie Sano et al. Sci Rep. .

Abstract

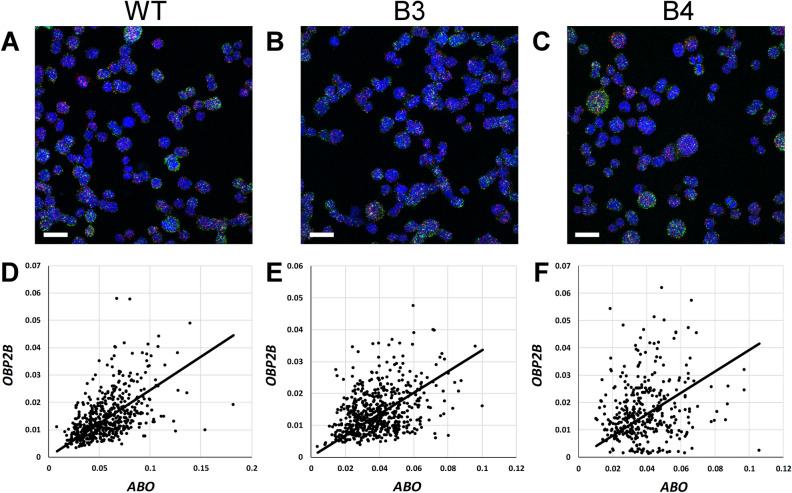
The human ABO blood group system is of great importance in blood transfusion and organ transplantation. ABO transcription is known to be regulated by a constitutive promoter in a CpG island and regions for regulation of cell-specific expression such as the downstream + 22.6-kb site for epithelial cells and a site in intron 1 for erythroid cells. Here we investigated whether the + 22.6-kb site might play a role in transcriptional regulation of the gene encoding odorant binding protein 2B (OBP2B), which is located on the centromere side 43.4 kb from the + 22.6-kb site. In the gastric cancer cell line KATOIII, quantitative PCR analysis demonstrated significantly reduced amounts of OBP2B and ABO transcripts in mutant cells with biallelic deletions of the site created using the CRISPR/Cas9 system, relative to those in the wild-type cells, and Western blotting demonstrated a corresponding reduction of OBP2B protein in the mutant cells. Moreover, single-molecule fluorescence in situ hybridization assays indicated that the amounts of both transcripts were correlated in individual cells. These findings suggest that OBP2B could be co-regulated by the + 22.6-kb site of ABO.


Conflict of interest statement

The authors declare no competing interests.

Figures

Figure 1
Figure 1
Schematic illustration of the relationships among the genomic regions interacting with the ABO transcription start site and the genes around ABO. The top diagram represents the genomic regions interacting with the ABO transcription start site, which were constructed using publicly available data for GeneHancer Regulatory Elements and Gene Interactions. ABO and OBP2B are shown below the regions. The ABO exons are indicated by lines or a solid box, and the OBP2B exons are denoted by lines. The + 5.8-kb site is involved in GH09J133267, the + 22.6-kb site is included in GH09J133250, and the DNase I hypersensitive site region + 36.0 corresponds to GH09J133236,. The middle diagram shows the chromosomal positions of ABO and the other genes shown in Table 1, the transcription start sites of which are indicated by a line. Genes whose transcription start sites interacted with GH09J133250 are colored red. The pseudogene LCN1P1 is not shown. The bottom represents the locations of CTCF-mediated chromatin interactions on publicly available data for ENCODE Chromatin Interactions tracks involving ChIA-PET data for MCF-7 cells.
Figure 2
Figure 2
Decrease of OBP2B and ABO expression in KATOIII cells harboring biallelic deletions of the + 22.6-kb site. Each panel shows the relative amounts of various transcripts including OBP2B, ABO, SURF6, SURF1, or ADAMTS13 in wild-type KATOIII cells and their derived mutant clones B3 and B4 harboring biallelic deletions of the + 22.6-kb site. The left column of panels represents the relative expression of each gene obtained from TMM-normalized counts of RNA-seq in the wild-type and mutant cells. When the count of each transcript in the wild-type cells was assigned an arbitrary value of 1.0, the relative count of each transcript was calculated in the mutant clones. Similarly, the middle or right column of panels represents the relative expression of each gene obtained using real-time PCR or ddPCR, respectively, in the wild-type and mutant cells. The ratio of each target transcript was calculated by dividing it by the copy number of β-actin or 18S rRNA in real-time PCR or ddPCR, respectively. When the ratio of each transcript in the wild-type cells was assigned an arbitrary value of 1.0, the relative expression of each transcript was calculated in the mutant cells. All data represent means from three independent experiments, and the standard deviations are also shown. The significance of differences was determined by Student’s t test at a significance level of p value < 0.01 (**) or 0.05 (*).
Figure 3
Figure 3
Quantitative decrease of OBP2B protein in the mutant clones B3 and B4 relative to that in the wild-type KATOIII cells. The amount of OBP2B or β-actin protein was evaluated by Western blotting using the cell lysate and supernatant prepared from the wild-type KATOIII cells and its derived mutant clones B3 and B4, followed by densitometry measurements. The representative blots are shown in the upper panels. The two panels on the left side show the blots of OBP2B obtained using a cell lysate after short or long exposure. The molecular weight of each protein was estimated using ECL DualVue Western blotting markers (cytiva). The amount of protein applied to each lane was 30 μg for the cell lysate or 20 μg for the supernatant. The left and right lower panels indicate the relative amounts of OBP2B protein in the cell lysate and supernatant, respectively, obtained from the mutant cells when that of the wild-type cells was assigned an arbitrary value of 1.0. The middle lower panel indicates the level of OBP2B normalized to the amount of β-actin in cell lysates in the mutant cells, relative to that for wild-type cells which was assigned an arbitrary value of 1.0. The relative level of OBP2B represents the mean from more than three independent experiments. The significance of the decrease was determined by Student’s t test at a significance level of p < 0.01 (**).
Figure 4
Figure 4
The nucleotide sequence of the 5′-flanking region in the human OBP2B gene. The sequence is given in full, from position − 350 to + 50, relative to the translation start site in exon 1 of OBP2B. The uppercase letters denote the coding sequence of exon 1, and the lowercase letters indicate non-coding genomic sequence. Several restriction enzyme recognition sites are underlined. Several putative transcription factor binding sites are underlined. Open circles indicate the locations of the 5′-ends of the OBP2B transcripts, determined by 5′-RACE using cDNA obtained from KATOIII cells, while the filled circle denotes the transcription initiation site obtained from the publicly available data for GeneHancer Regulatory Elements and Gene Interactions.
Figure 5
Figure 5
Summary of the relative luciferase activities of the reporter constructs containing different lengths of the 5′ upstream sequence of OBP2B. The OBP2B sequences (horizontal bars) were inserted upstream of the luciferase coding sequence of the pGL3-basic vector. Constructs were aligned below the restriction map of the region and are shown in the left panel. ERE represents location of estrogen response element. Construct names are shown to the left of the bar, and the locations of the inserted fragments are shown. The + 22.6-kb site was inserted downstream of luciferase in construct OBP0.3/C. Each construct as depicted on the left was transiently transfected into KATOIII cells in (A), and each construct was transiently transfected into KATOIII cells, K562 cells, or OUMS-36T-1 cells in (B). The obtained luciferase activity was normalized, and is shown in the right panel. The mean values and standard deviations were calculated from more than three independent experiments. The significance of differences was determined by Student’s t test at a significance level of p < 0.01 (**). The activity of the pGL3-promoter vector containing the SV40 promoter was given an arbitrary value of 1.0.
Figure 6
Figure 6
RNA fluorescence in situ hybridization for the ABO and OBP2B transcripts. (AC) Representative images of the wild-type KATOIII cells (A), and their mutant clones B3 (B) or B4 (C) fluorescently labeled for transcripts ABO (Opal570; shown in red) and OBP2B (Opal520; green), as well as nuclei (DAPI; blue). Scale bar; 20 µm. (DF). Mean relative intensity of the ABO and OBP2B signals in each nucleus for the wild-type cells (D), B3 cells (E) or B4 cells (F). Each dot represents each ROI (nucleus), and the x-axis indicates the mean relative intensity of the Opal570 signal (ABO) in each ROI while the y-axis shows that of Opal520 (OBP2B). The coefficients of determination (R2) were 0.812 for the wild-type cells, 0.802 for B3 cells and 0.666 for B4 cells.

References

    1. Daniels, G. Human Blood Groups (ed. Daniels, G.). 21–25 (Wiley-Blackwell, 2013).
    1. Yamamoto F. Molecular genetics of ABO. Vox Sang. 2000;78:91–103. - PubMed
    1. Kominato Y, et al. Alternative promoter identified between a hypermethylated upstream region of repetitive elements and a CpG island in human ABO histo-blood group genes. J. Biol. Chem. 2002;277:37936–37948. doi: 10.1074/jbc.M204238200. - DOI - PubMed
    1. Hata Y, et al. Characterization of the human ABO gene promoter in erythroid cell lineage. Vox Sang. 2002;82:39–46. doi: 10.1046/j.0042-9007.2001.00134.x. - DOI - PubMed
    1. Sano R, et al. Expression of ABO blood-group genes is dependent upon an erythroid cell-specific regulatory element that is deleted in persons with the Bm phenotype. Blood. 2012;119:5301–5310. doi: 10.1182/blood-2011-10-387167. - DOI - PubMed

Publication types