. 2021 Apr 1;11(1):7403.
doi: 10.1038/s41598-021-86788-w.

Low dose of zearalenone elevated colon cancer cell growth through G protein-coupled estrogenic receptor

Affiliations

Low dose of zearalenone elevated colon cancer cell growth through G protein-coupled estrogenic receptor

Emily Kwun Kwan Lo et al. Sci Rep. .

Abstract

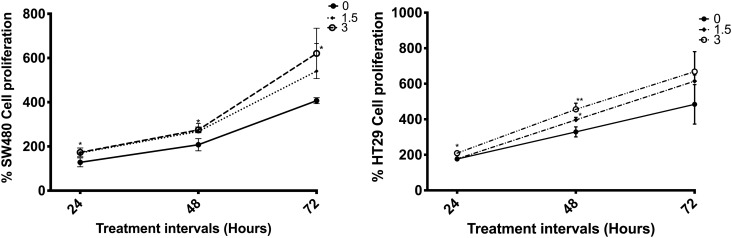
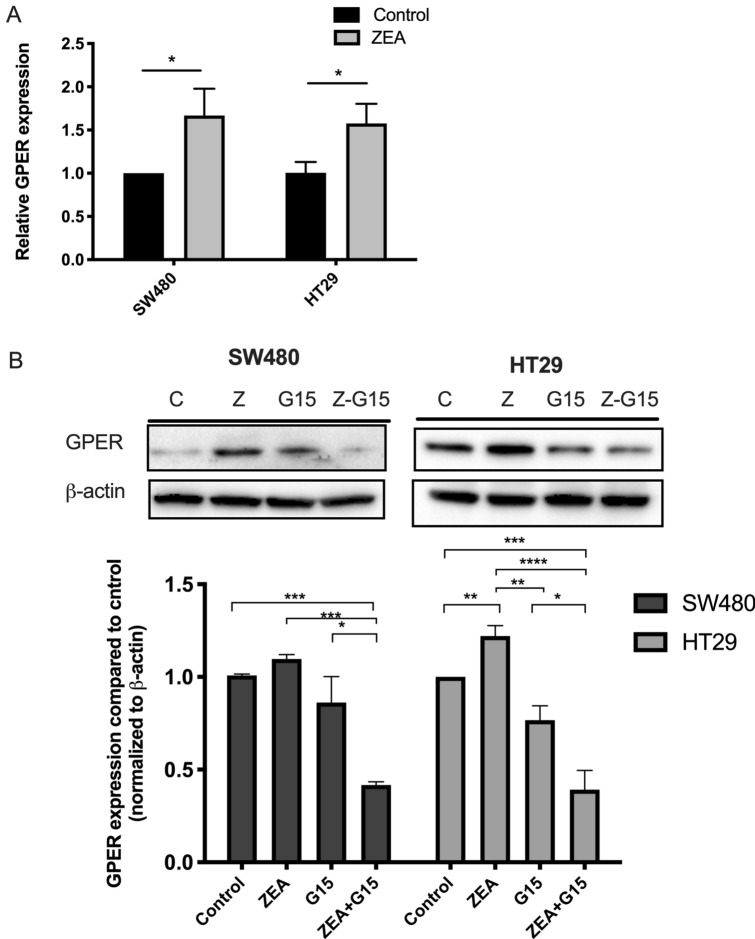
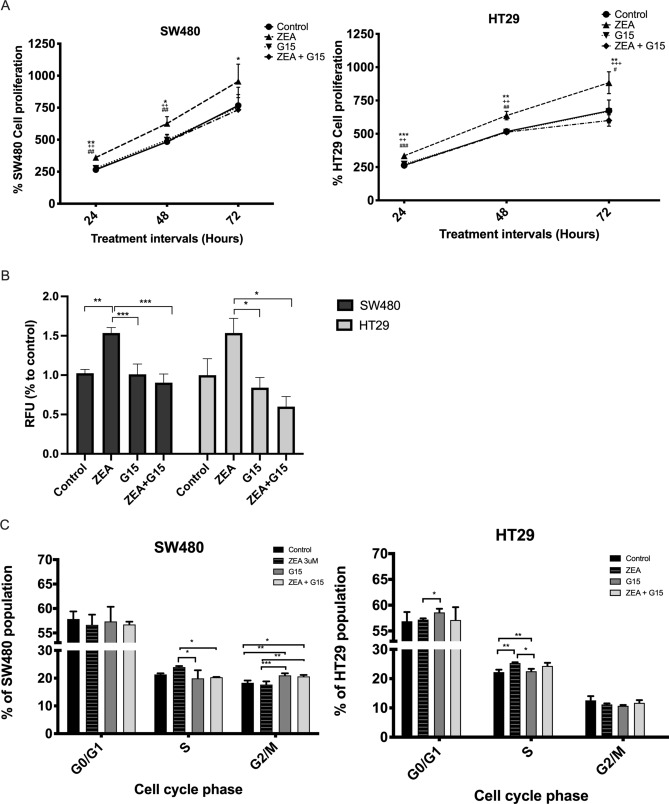
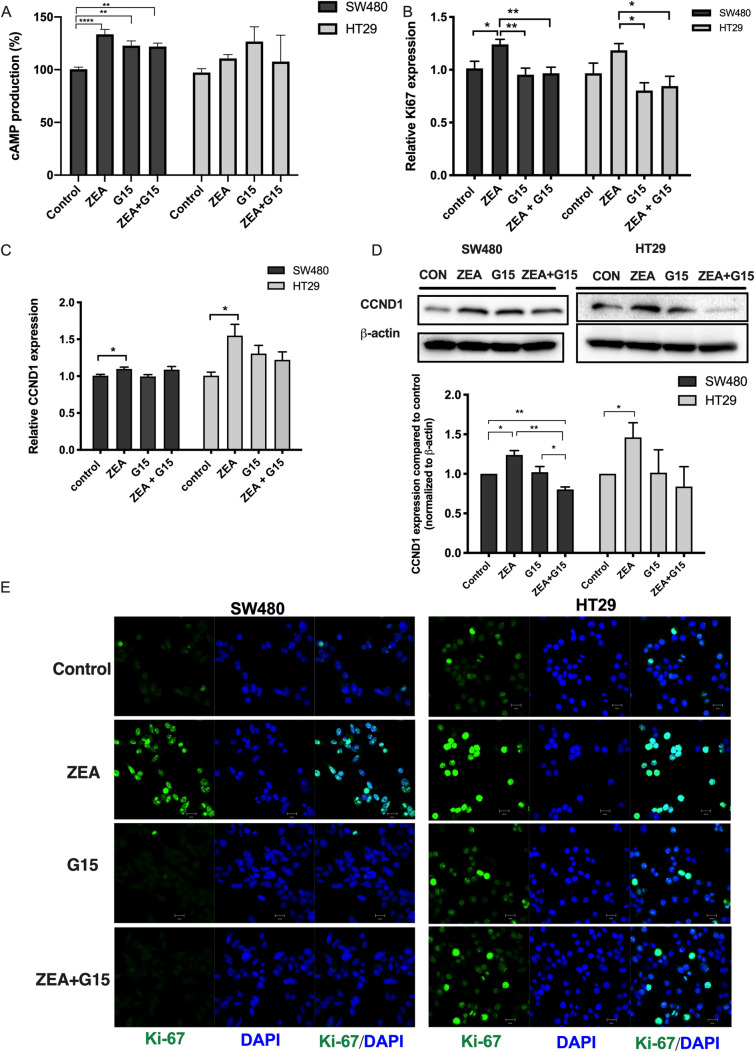
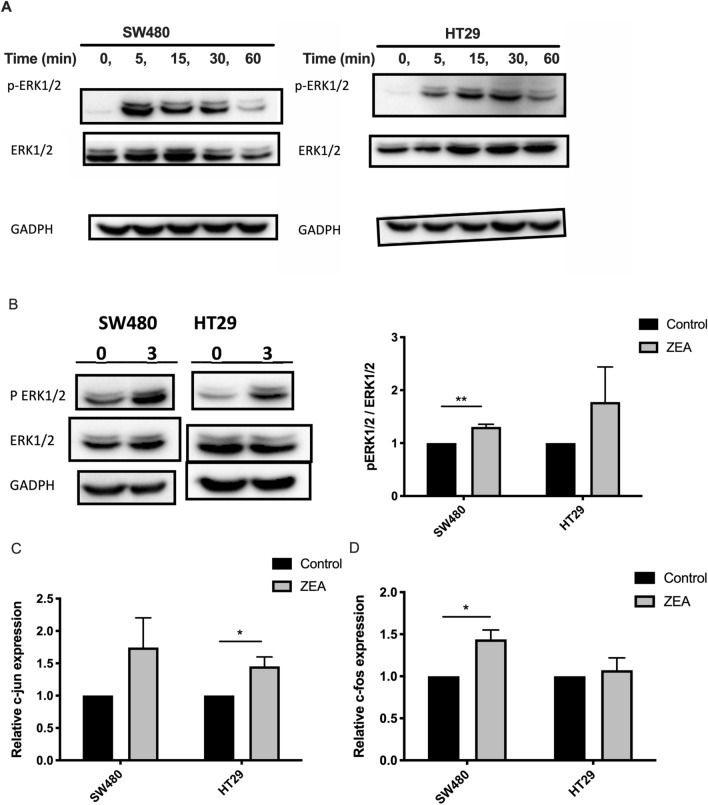
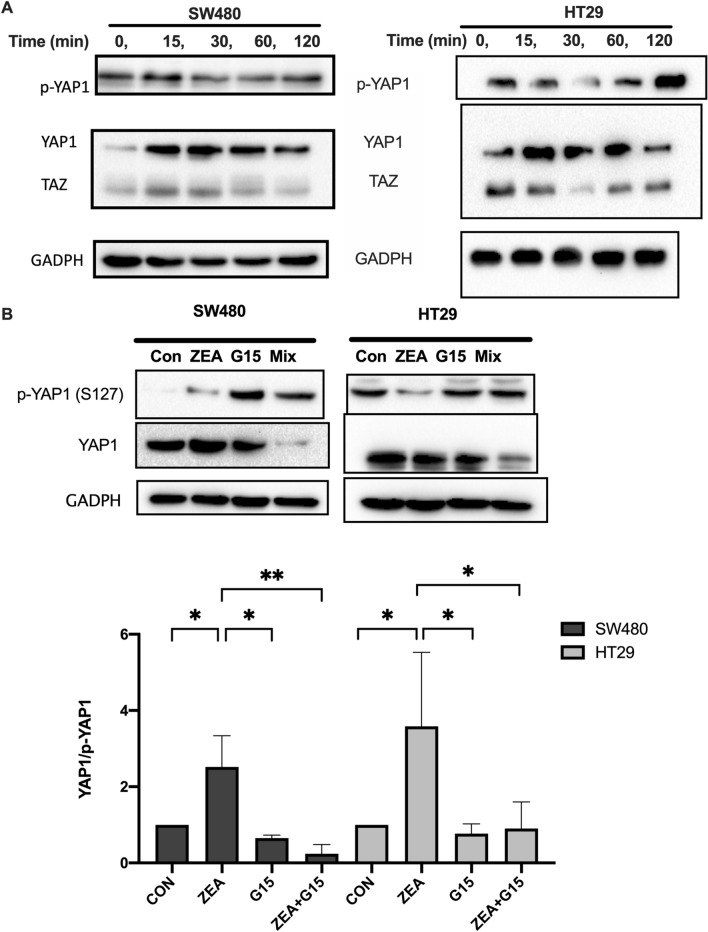
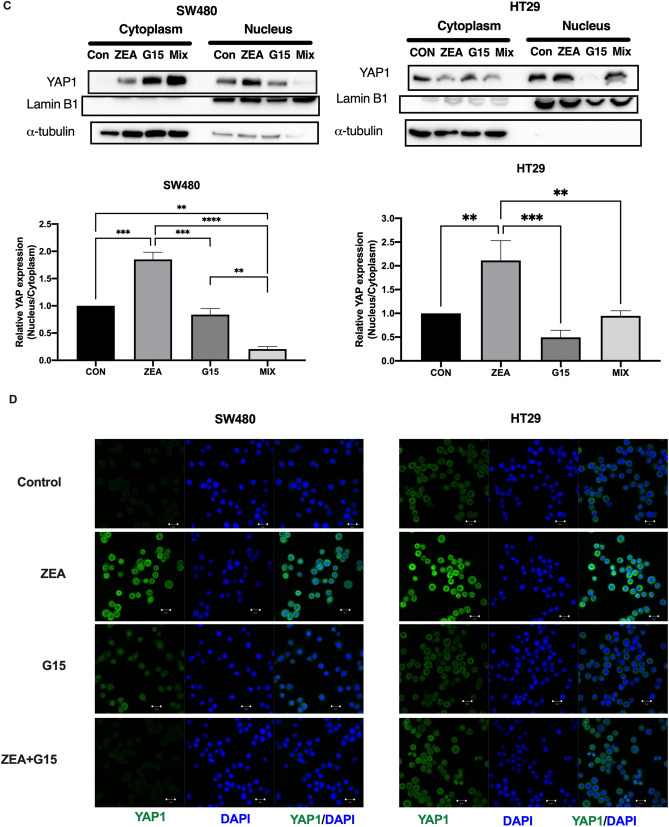
Colon cancer is one of the leading causes of cancer death worldwide. It is widely believed that environmental factors contribute to colon cancer development. Zearalenone (ZEA) is non-steroidal estrogenic mycotoxin that is widely found in the human diet and animal feeds. Most cancer studies of ZEA focused on estrogen sensitive cancers, while few focused on other types, such as colon cancer; despite the gastrointestinal tract being the first barrier exposed to food contaminants. This study investigated the stimulatory effects of ZEA on colon cancer cell lines and their underlying molecular mechanisms. ZEA promoted anchorage independent cell growth and cell cycle progression through promoting G1-to-S phase transition. Proliferative marker, cyclin D1 and Ki67 were found to be upregulated upon ZEA treatment. G protein-coupled estrogenic receptor 1 (GPER) protein expression was promoted upon ZEA treatment suggesting the involvement of GPER. The growth promoting effect mediated through GPER were suppressed by its antagonist G15. ZEA were found to promote the downstream parallel pathway, MAPK signaling pathway and Hippo pathway effector YAP1. Altogether, our observations suggest a novel mechanism by which ZEA could promote cancer growth and provide a new perspective on the carcinogenicity of ZEA.


Conflict of interest statement

The authors declare no competing interests.

Figures

Figure 1
Figure 1
ZEA promotes the growth of human CRC cells. Cultured CRC cells (SW480, HT29) were treated with 0–3 μM ZEA for 24, 48 and 72 h. CRCs were then trypsinized and fixed with trypan blue solution. Cell counting was carried out using LUNA Automated Cell Counter. Results shown are mean ± SEM, n = 3. *p < 0.05 and **p < 0.01 compared to control.
Figure 2
Figure 2
ZEA increases GPER expression in CRC cell. (A) RT-qPCR analysis of GPER gene expression in SW480 and HT29 cells with and without 3 μM ZEA was investigated. (B) Western blot analysis of GPER in SW480 and HT29 with and without G15 treatment was investigated. Results shown are mean ± SEM, with n = 3. *p < 0.05, **p < 0.01, ***P < 0.001 and ****p < 0.0001.
Figure 3
Figure 3
Zearalenone promoted the growth of human CRC cells. (A) SW480 and HT29 cells were incubated with 3 μM ZEA with or without G15 (GPER antagonist) for 24, 48 and 72 h. CRCs were then trypsinized and fixed with trypan blue solution. Cell counting was carried out using LUNA Automated Cell Counter. *p < 0.05, **p < 0.01 and ***p < 0.001 ZEA compared to control. +p < 0.05, ++p < 0.01 and +++p < 0.001 G15 compared to ZEA. #p < 0.05, ##p < 0.01 and ###p < 0.001 ZEA + G15 compared to ZEA. (B) Soft agar transformation assay was performed. RFU refers to Relative fluorescent units. (C) Cell cycle analysis of SW480 and HT29 co-incubated 3 μM ZEA with or without G15 for 24 h. The percentage of S phase, G0/G1 and G2/M are shown in the figures. Results shown are mean ± SEM, with n = 3. *p < 0.05, **p < 0.01 and ***p < 0.001.
Figure 4
Figure 4
ZEA increased the expression of proliferation marker. RT-qPCR analysis of (A) CCND1 and (B) Ki67 mRNA expression of SW480 and HT29 incubated with 3 μM ZEA with or without G15 (GPER antagonist). (C) cAMP production induced by 3 μM ZEA in the absence or presence of 5 μM G15. cAMP production was analysed by comparing the cAMP production to control group as 100%. (D) Western blot analysis of CCND1 protein expression, (E) Ki-67 expression was determined by immunofluorescence staining for Ki67 (green) along with DAPI for DNA (blue). Scale bar, 20 μm. Results shown are mean ± SEM, with n = 3. *p < 0.05 and **p < 0.01.
Figure 5
Figure 5
ZEA triggered the MAPK-ERK pathway. (A) Western blot analysis of the total and phosphorylation of ERK1/2 protein expression after CRC cells treated with 3 μM ZEA (A) in 1 h, and (B) at 15 min. (B) RT-qPCR analysis of downstream marker c-jun (C) and c-fos (D) expression in SW480 and HT29 incubated with and without 3 μM ZEA. Results shown are mean ± SEM, n = 3. *p < 0.05 and **p < 0.01.
Figure 6
Figure 6
ZEA promoted YAP nuclear localization and activity through GPER in human CRC cells. (A)Western blot analysis of the total and phosphorylation of YAP1 and TAZ protein expression after CRC cells treated with ZEA. Western blot analysis of YAP expression in total (B), cytoplasmic and nuclear fraction (C) of SW480 and HT29 cells after incubated with 3 μM ZEA with or without G15 (GPER antagonist).GADPH a-tubulin and lamin B1 were used as a loading control for total, cytoplasmic and nucleus protein. (D) YAP nuclear localisation was determined by immunofluorescence staining for endogenous YAP1 (green). Nuclei was visualized using DAPI for DNA (blue). Results shown are mean ± SEM, n = 3. *p < 0.05, **p < 0.01 and ****p < 0.0001.
Figure 6
Figure 6
ZEA promoted YAP nuclear localization and activity through GPER in human CRC cells. (A)Western blot analysis of the total and phosphorylation of YAP1 and TAZ protein expression after CRC cells treated with ZEA. Western blot analysis of YAP expression in total (B), cytoplasmic and nuclear fraction (C) of SW480 and HT29 cells after incubated with 3 μM ZEA with or without G15 (GPER antagonist).GADPH a-tubulin and lamin B1 were used as a loading control for total, cytoplasmic and nucleus protein. (D) YAP nuclear localisation was determined by immunofluorescence staining for endogenous YAP1 (green). Nuclei was visualized using DAPI for DNA (blue). Results shown are mean ± SEM, n = 3. *p < 0.05, **p < 0.01 and ****p < 0.0001.

References

    1. Bray F, et al. Global cancer statistics 2018: GLOBOCAN estimates of incidence and mortality worldwide for 36 cancers in 185 countries. Ca-a Cancer J. Clin. 2018;68(6):394–424. doi: 10.3322/caac.21492. - DOI - PubMed
    1. Holleczek B, et al. On-going improvement and persistent differences in the survival for patients with colon and rectum cancer across Europe 1999–2007 - Results from the EUROCARE-5 study. Eur. J. Cancer. 2015;51(15):2158–2168. doi: 10.1016/j.ejca.2015.07.024. - DOI - PubMed
    1. Allemani C, et al. Global surveillance of cancer survival 1995–2009: analysis of individual data for 25,676,887 patients from 279 population-based registries in 67 countries (CONCORD-2) Lancet. 2015;385(9972):977–1010. doi: 10.1016/S0140-6736(14)62038-9. - DOI - PMC - PubMed
    1. Zinedine A, et al. Review on the toxicity, occurrence, metabolism, detoxification, regulations and intake of zearalenone: an oestrogenic mycotoxin. Food Chem. Toxicol. 2007;45(1):1–18. doi: 10.1016/j.fct.2006.07.030. - DOI - PubMed
    1. Lecomte S, et al. Deciphering the molecular mechanisms sustaining the estrogenic activity of the two major dietary compounds zearalenone and apigenin in ER-positive breast cancer cell lines. Nutrients. 2019;11(2):1. doi: 10.3390/nu11020237. - DOI - PMC - PubMed

MeSH terms