. 2021 Apr 1;4(1):439.
doi: 10.1038/s42003-021-01960-2.

Adhering interacting cells to two opposing coverslips allows super-resolution imaging of cell-cell interfaces

Affiliations

Adhering interacting cells to two opposing coverslips allows super-resolution imaging of cell-cell interfaces

Julia Sajman et al. Commun Biol. .

Abstract

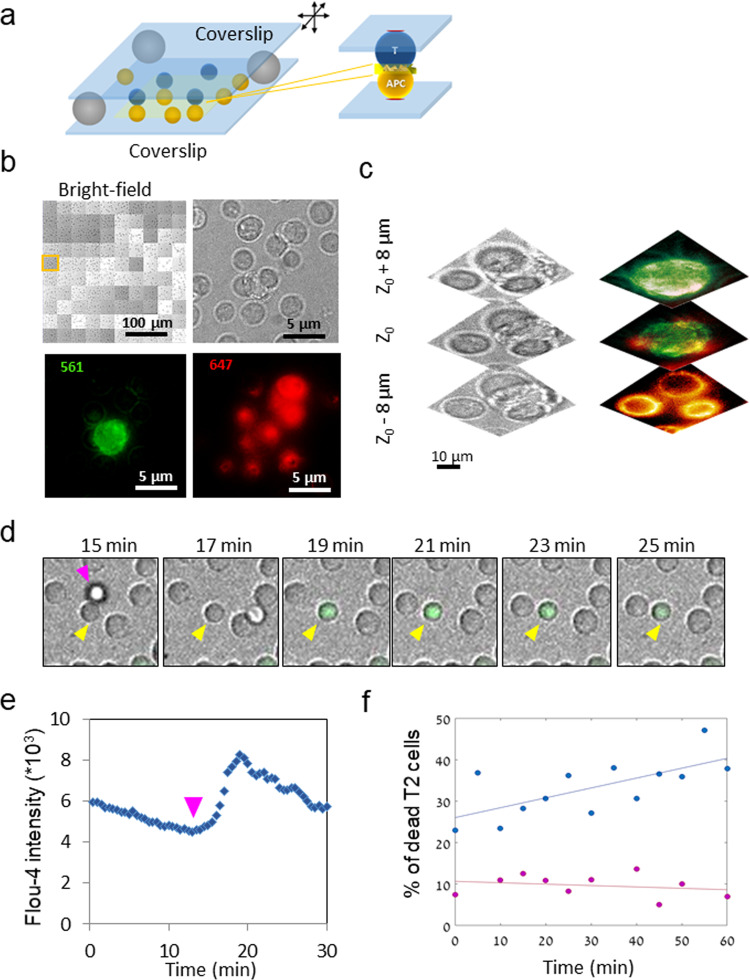
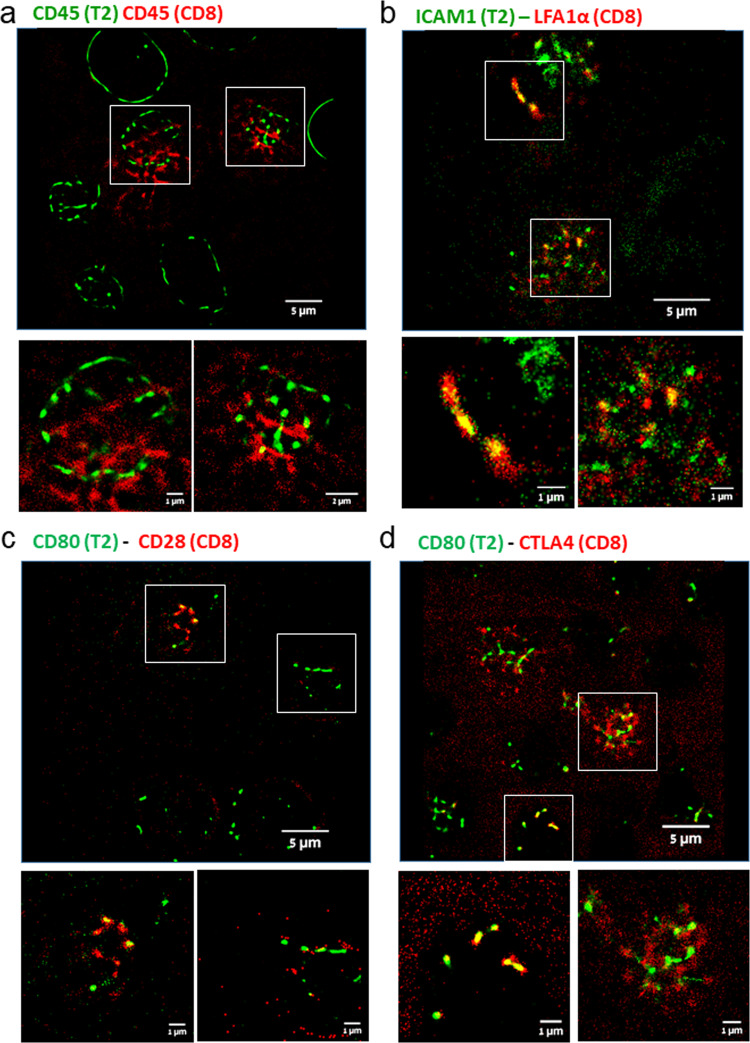
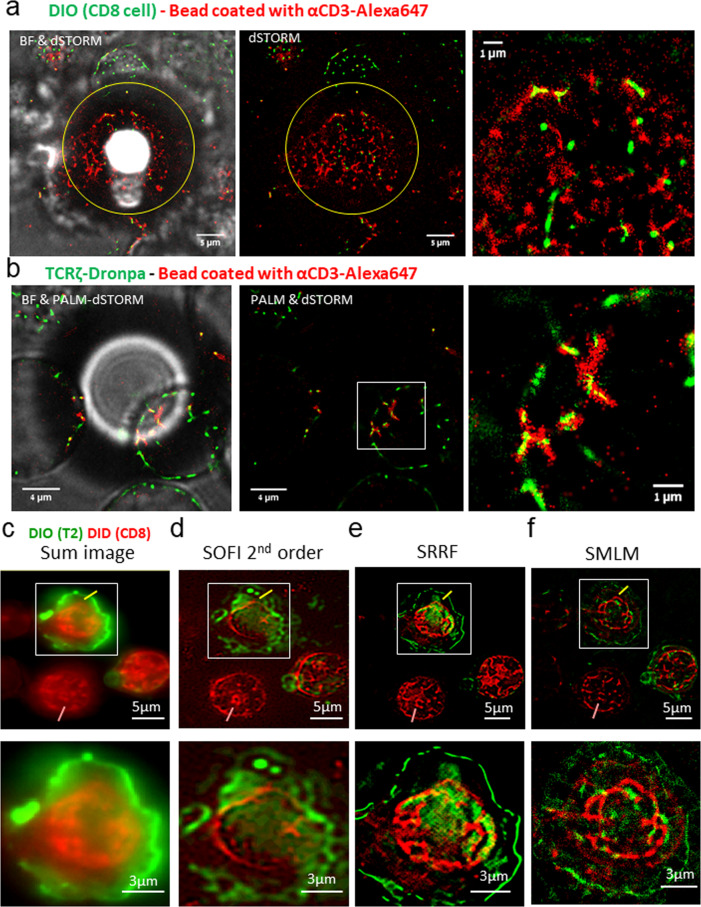
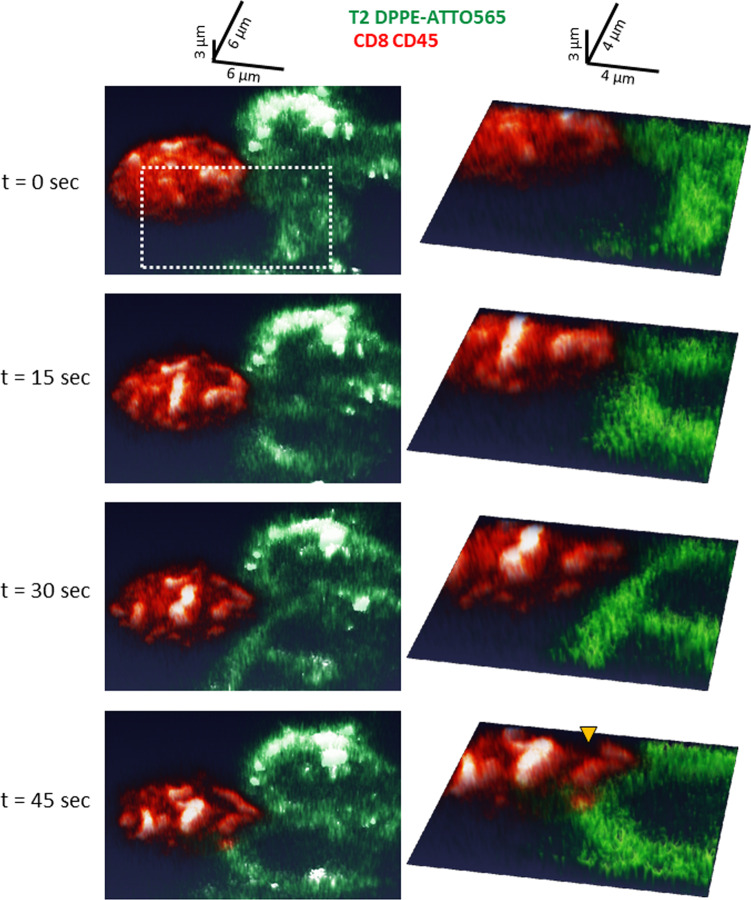
Cell-cell interfaces convey mechanical and chemical information in multicellular systems. Microscopy has revealed intricate structure of such interfaces, yet typically with limited resolution due to diffraction and unfavourable orthogonal orientation of the interface to the coverslip. We present a simple and robust way to align cell-cell interfaces in parallel to the coverslip by adhering the interacting cells to two opposing coverslips. We demonstrate high-quality diffraction-limited and super-resolution imaging of interfaces (immune-synapses) between fixed and live CD8+ T-cells and either antigen presenting cells or melanoma cells. Imaging methods include bright-field, confocal, STED, dSTORM, SOFI, SRRF and large-scale tiled images. The low background, lack of aberrations and enhanced spatial stability of our method relative to existing cell-trapping techniques allow use of these methods. We expect that the simplicity and wide-compatibility of our approach will allow its wide dissemination for super-resolving the intricate structure and molecular organization in a variety of cell-cell interfaces.


Conflict of interest statement

The authors declare no competing interests.

Figures

Fig. 1
Fig. 1. Microscopy of T/APC conjugates on opposing surfaces.
a A schematic description of imaging T/APC conjugates on opposing coverslips. b Large-scale microscopy images consisting of 100 fields of view were taken of CD8+ T cells in contact with APC (T2 hybridoma) cells loaded with the activating peptide NY-ESO-1. A montage of large-scale bright-filed images and a single field is shown (top row). Image contrast of these images was adapted here for improved visibility of single cells. The PM of the CD8+ T cells was stained for αCD45 and Alexa647 (red) and the PM the T2 cells was stained using DPEE-Atto565 (green). Fluorescence images of the zoom field are shown (bottom row). Large-scale images in bright field, and in each of the fluorescence channels were routinely collected at different z-sections and are shown in Fig. S1. c Zoomed bright field and fluorescence images from the single field in panel b are shown at different heights (focal planes) relative to the cell interface. d Calcium imaging of Fluo-4 stained live CD8+ T cells (yellow arrowhead), upon encounter with the T2 cells (magenta arrowhead) loaded with the activating peptide NY-ESO-1. A representative field is shown. Yellow arrowheads show an activated cell of interest. e The intensity time-trajectory of Fluo-4 in the pointed CD8+ T cell in panel d. Magenta arrowhead indicates the time of the cell engagement with the T2 APC. f The time-dependent killing efficiency by CD8+ T cells of the T2 cells, with (blue) or without (magenta) loading with NY-ESO-1 peptide.
Fig. 2
Fig. 2. STED microscopy of CD8+ T cell conjugates with APCs and melanoma cells.
a STED images of cell conjugates of CD8+ T cells with T2 cells loaded with the activating peptide NY-ESO-1. The PM of the CD8+ T cells was stained for αCD45 and Alexa647 (red) and the PM of the T2 cells was stained using DPEE-Atto565 (green). Images are shown at different heights (focal planes) relative to the cell interface. b Three-dimensional rendering of the cell conjugates in panel a. c Zoom images of the confocal and STED images are shown for the zoom area in panel a at z = 0 (middle image). Intensity of either green or red channels is shown across line profiles (indicated as colored lines, respectively) in the top-row images. The width of small objects (peaks) of interest are indicated. d STED images of cell conjugates of CD8+ T cells with A375 (melanoma) cells. The PM of the CD8+ T cells was stained for αCD45 and Alexa647 (red) and the PM of the A375 cells and the A375 cells were stained using DPEE-Atto565 (green). Images are shown at different heights (focal planes) relative to the cell interface. e Three-dimensional rendering of the cell conjugates in panel d. f Zoom images of the confocal and STED images are shown for the zoom area in panel d at z = 0 (middle image). Intensity of either green or red channels is shown across line profiles (indicated as colored lines, respectively) in the top-row images. Yellow arrowheads indicate features of interest in the image and on the intensity line profiles. The widths of small objects (peaks) of interest are indicated.
Fig. 3
Fig. 3. Molecular organization and interactions at the IS.
ad dSTORM images of cell conjugates of CD8+ T cells with T2 cells loaded with the activating peptide NY-ESO-1. a The CD8+ T (red) and T2 (green) cells were both stained for CD45 (with Alexa647 and Atto488 secondary antibodies, respectively). A representative field (top) and two zoom images of a single conjugate (bottom) are shown. b The CD8+ T cells (red) were stained for LFA1α, and T2 (green) cells were stained for ICAM1. A representative field (top) and two zoom images of single conjugates (bottom) are shown. c The CD8+ T cells (red) were stained for CD28, and T2 (green) cells were stained for CD80. A representative field (top) and two zoom images of single conjugates (bottom) are shown. d The CD8+ T cells (red) were stained for CTLA4, and T2 (green) cells were stained for CD80. A representative field (top) and two zoom images of single conjugates (bottom) are shown.
Fig. 4
Fig. 4. Molecular organization at cell-bead interfaces and using multiple super-resolution reconstruction techniques.
a The interface between 20 μm silicon beads and CD8+ T cells. The CD8+ T cells were stained with DIO (membrane dye) and adhered to the bottom coverslip. Twenty-micrometre silicon beads (highlighted diameter in yellow circle) were coated with αCD3ε-Alexa647, and adhered to the top coverslip. A representative cell-bead interface is shown. Bright field of the cell-bead interface, merged with the two fluorescence channels (left panel). Fluorescence imaging of DIO (green) and αCD3ε (red) (middle panel). Zoom in on the cell-bead interface (right panel). b The interface between 20 μm silicon beads and Jurkat E6.1 T cells. Jurkat E6.1 (CD4+ T) cells stably expressing TCRζ-Dronpa adhered to the bottom of coverslip. On top, 20-μm silicon beads coated with αCD3ε-Alexa647. A representative cell-bead interface is shown. Bright field merged with fluorescence (left panel). Fluorescence of Dronpa (green) and CD3ε (red) (middle panel). Zoom in on the cell-bead interface (right panel). cf Super-resolution images of cell conjugates of CD8+ T cells with T2 cells loaded with the activating peptide NY-ESO-1. The PM of the CD8+ T cells was stained with DiD (red) and the PM of the T2 cells was stained with DiO (green). Reconstructions of the same cells are shown through either c Sum image (via summing the intensity of all frames), d Second-order SOFI, e SRRF, f SMLM (via the ThunderStorm software). Top images show the entire field, while bottom images show a zoom on a single-cell conjugate. Yellow and pink lines in top images indicate line cross-sections along which intensity profiles are shown and compared in Fig. S7. See main text and methods for further details regarding the reconstruction techniques.
Fig. 5
Fig. 5. Confocal imaging of a live CD8+ T cell interacting with a T2 APCs.
Live-cell confocal imaging of conjugates of CD8+ T cells with T2 cells loaded with the activating peptide NY-ESO-1. The PM of the CD8+ T cells was stained for αCD45 with Alexa647 (red) and the PM of the T2 cells was stained using DPEE-Atto565 (green). Images are shown at different timepoints (t = 0, 15, 30, 45 s) from the start of the interaction (t = 0). Whole field (left) and zoom images (right) are shown and rendered in two different aspects (see axes at top), to better highlight the 3D nature of the interface. All of these 2D images are projections of 3 μm slices. The yellow arrowhead in bottom-right zoom image highlights a lamellar protrusion that facilitates the interaction between the cells.

References

    1. Cooper, G. M. The Cell, A molecular approach (Sinauer Associates, 2000).
    1. Cavey M, Lecuit T. Molecular bases of cell-cell junctions stability and dynamics. Csh Perspect. Biol. 2009;1:a002998. - PMC - PubMed
    1. Nicholls, J. G. From neuron to brain 5th edn, (Sinauer Associates, 2012).
    1. Trautmann A, Valitutti S. The diversity of immunological synapses. Curr. Opin. Immunol. 2003;15:249–254. doi: 10.1016/S0952-7915(03)00040-2. - DOI - PubMed
    1. Choquet D, Triller A. The dynamic synapse. Neuron. 2013;80:691–703. doi: 10.1016/j.neuron.2013.10.013. - DOI - PubMed

Publication types

MeSH terms