. 2021 Apr;40(17):3087-3100.
doi: 10.1038/s41388-021-01754-0. Epub 2021 Apr 1.

Targeting the glucocorticoid receptor signature gene Mono Amine Oxidase-A enhances the efficacy of chemo- and anti-androgen therapy in advanced prostate cancer

Affiliations

Targeting the glucocorticoid receptor signature gene Mono Amine Oxidase-A enhances the efficacy of chemo- and anti-androgen therapy in advanced prostate cancer

Martin Puhr et al. Oncogene. 2021 Apr.

Abstract

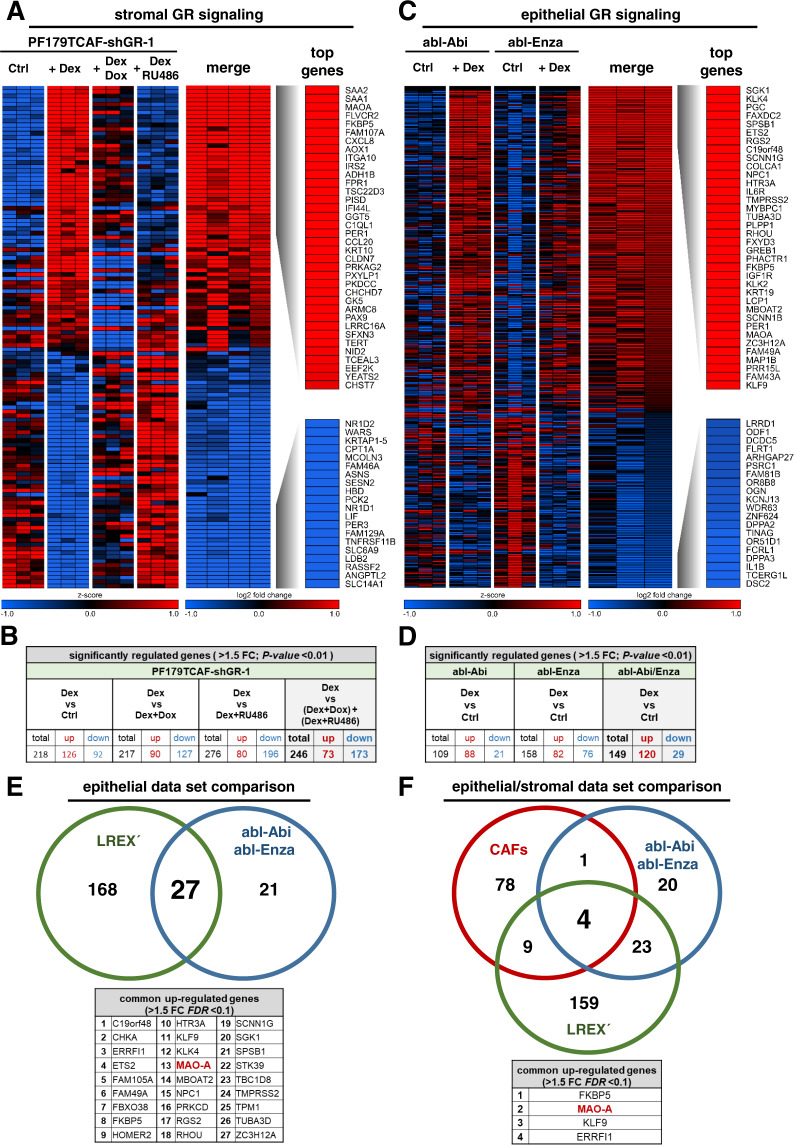
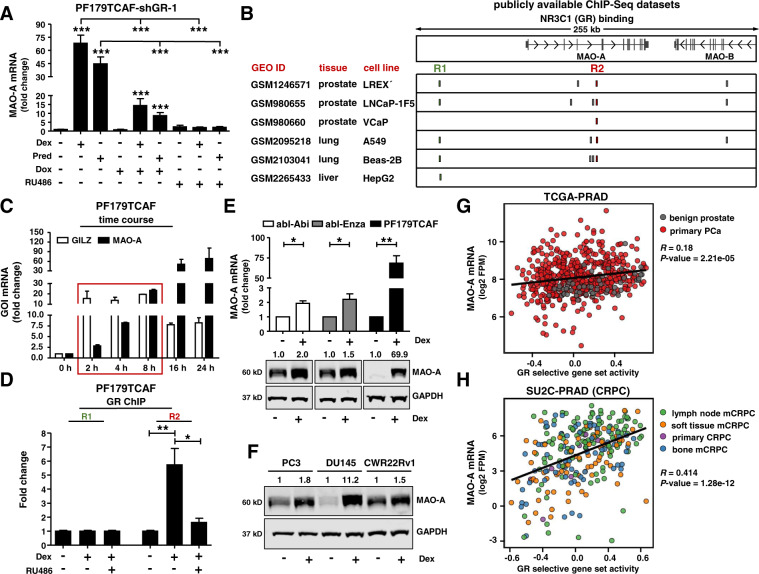
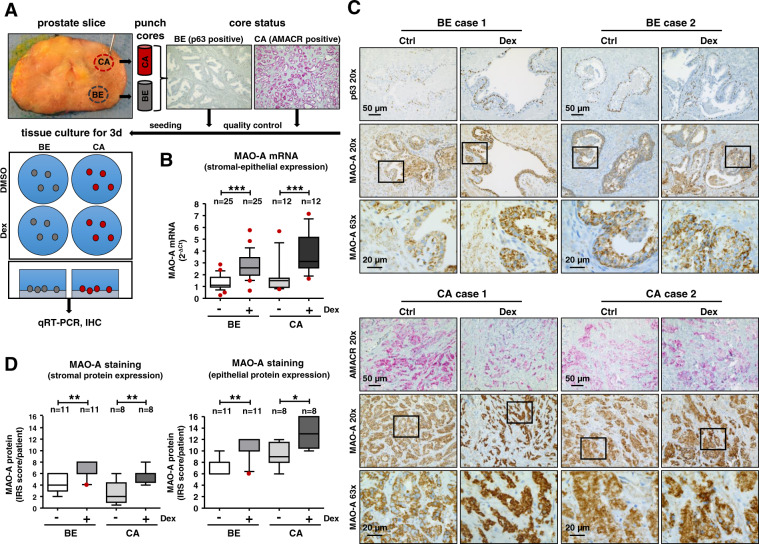
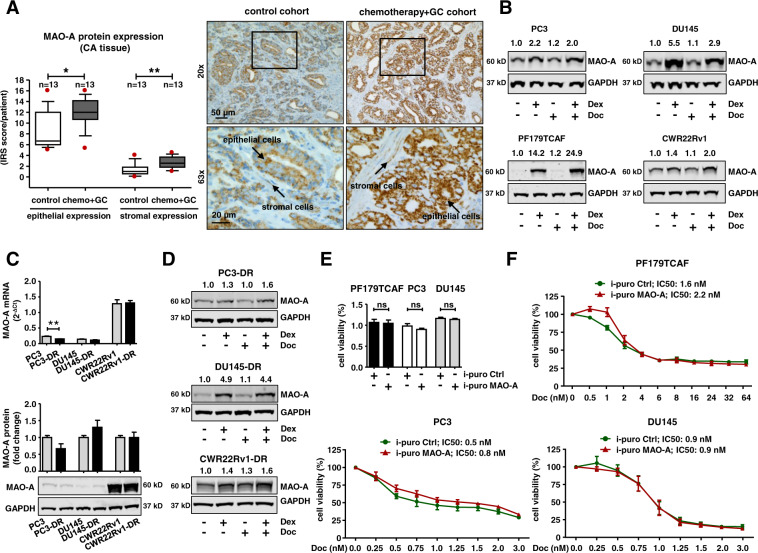
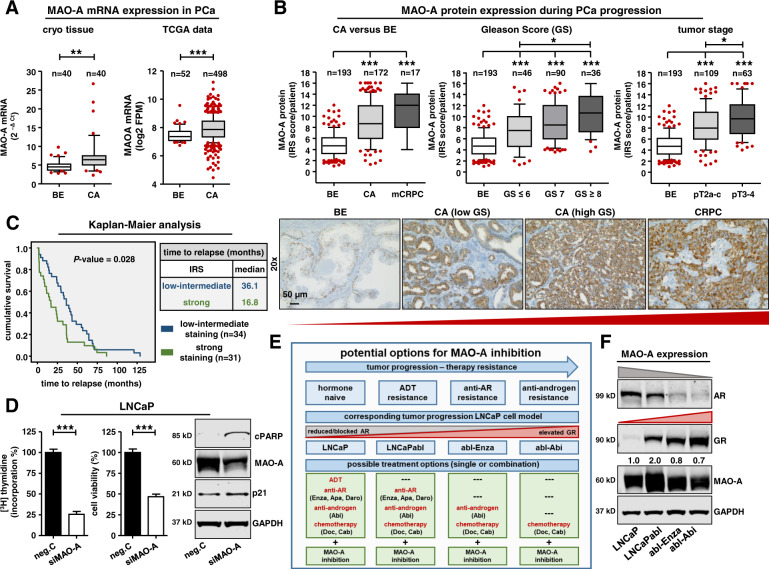
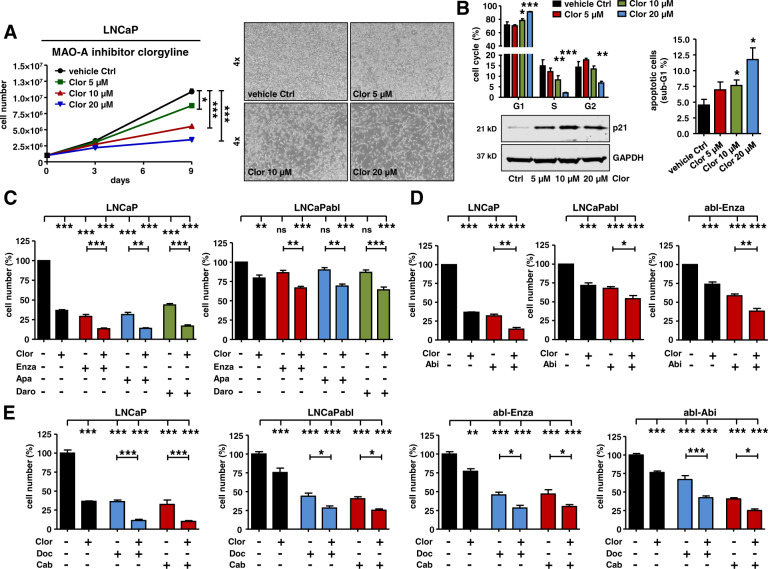
Despite increasing options for treatment of castration-resistant prostate cancer, development of drug resistance is inevitable. The glucocorticoid receptor (GR) is a prime suspect for acquired therapy resistance, as prostate cancer (PCa) cells are able to increase GR signaling during anti-androgen therapy and thereby circumvent androgen receptor (AR)-blockade and cell death. As standard AR-directed therapies fail to block the GR and GR inhibitors might result in intolerable side effects, the identification of GR signature genes, which are better suited for a targeted approach, is of clinical importance. Therefore, the specific epithelial and stromal GR signature was determined in cancer-associated fibroblasts as well as in abiraterone and enzalutamide-resistant cells after glucocorticoid (GC) treatment. Microarray and ChIP analysis identified MAO-A as a directly up-regulated mutual epithelial and stromal GR target, which is induced after GC treatment and during PCa progression. Elevated MAO-A levels were confirmed in in vitro cell models, in primary tissue cultures after GC treatment, and in patients after neoadjuvant chemotherapy with GCs. MAO-A expression correlates with GR/AR activity as well as with a reduced progression-free survival. Pharmacological MAO-A inhibition combined with 2nd generation AR signaling inhibitors or chemotherapeutics results in impaired growth of androgen-dependent, androgen-independent, and long-term anti-androgen-treated cells. In summary, these findings demonstrate that targeting MAO-A represents an innovative therapeutic strategy to synergistically block GR and AR dependent PCa cell growth and thereby overcome therapy resistance.


Conflict of interest statement

All authors declare no competing interests. IH: Research Grant from Bayer, speaker honoraria, travel grants Astellas, Bayer, Sanofi, Janssen, Sandoz, Pfizer, Advisory board: Bayer, Sanofi.

Figures

Fig. 1
Fig. 1. Identification of the stromal and epithelial GR target gene signature after GC treatment.
A Heat map of top 36 significantly up-regulated and top 20 significantly down-regulated genes of stromal PF179TCAF-shGR-1 cells. B Significantly altered GR target genes of PF179TCAF-shGR-1 cells, after control DMSO treatment as well as after 100 nM Dex, 100 nM Dex + 1 µg/ml Dox, and 100 nM Dex and 12 µM RU486 treatment for 24 h. C Heat map of top 36 significantly up-regulated and top 20 significantly down-regulated genes of epithelial abl-Enza and abl-Abi cells. D Significantly altered GR target genes of abl-Enza and abl-Abi cells, after control DMSO treatment as well as after 100 nM Dex treatment for 24 h. E Identification of 27 mutual significantly up-regulated GR target genes between the LREX´ and abl-Enza/Abi datasets. F Identification of four mutual significantly up-regulated stromal and epithelial GR target genes within the CAF, abl-Enza/Abi and LREX´ datasets.
Fig. 2
Fig. 2. MAO-A is a directly regulated GR target and is associated with elevated GR activity.
A MAO-A mRNA expression in PF179TCAF-shGR-1 cells after 24 h single or combination treatments with 100 nM Dex, 100 nM Pred, 1 µg/ml Dox, and 12 µM RU486 for 24 h. Data represent mean + SE from at least three independent experiments (one-way ANOVA and correction for multiple testing using Bonferroni´s comparison test; ***, P < 0.001). B Identification of 2 GR binding sites (R1 and R2) near the MAO-A gene in LREX´, LNCaP-1F5, VCaP, A549, Beas-2B, and HepG2 cells, screening publicly available ChIP-Seq datasets. C Time course of MAO-A and GILZ mRNA expression after incubation with 100 nM Dex. Data represent mean + SE from three independent experiments. D GR-ChIP with PF179TCAF cells after treatment with 100 nM Dex alone, or in combination with 6 µM RU486 for 16 h. Data represent mean + SE from three independent experiments (one-way ANOVA and correction for multiple testing using Bonferroni´s comparison test; *, P < 0.05). E, F MAO-A mRNA and protein expression after 100 nM Dex treatment for 3 d within different standard PCa cell models. mRNA data represent mean + SE from three independent experiments (unpaired t-test; *, P < 0.05; **, P < 0.01). G, H MAO-A is significantly positively correlated with GR activity within the publicly available TCGA-PRAD and SU2C-PRAD datasets.
Fig. 3
Fig. 3. Evaluation of MAO-A expression in benign and cancerous tissue cores of RPE patients after GC treatment.
A Schematic illustration of the ex vivo tissue culture. Punching, quality control by IHC staining for benign epithelium (p63) and for tumor tissue (AMACR) and cultivation of processed prostate tissue pieces in 6-well tissue culture plates. B MAO-A mRNA expression after 72 h incubation with 100 nM Dex. Data represent mean + SE from 25 benign and 12 cancerous screened tissue cores (one-way ANOVA and correction for multiple testing using Bonferroni´s comparison test; *, P < 0.05; ***, P < 0.001; Box Whisker Plot with 10–90 percentile). C Representative microscopy images of p63-AMACR and MAO-A staining of benign and cancerous tissue cores. Magnification: 20× (scale bar = 50 µm) and 63× (scale bar = 20 µm). D Quantification of MAO-A IRS after IHC staining of the epithelial and stromal compartment within benign and cancerous tissue cores (Kruskal–Wallis test and correction for multiple testing using Dunn´s comparison test; *, P < 0.05; **, P < 0.01; Box Whisker Plot with 10–90 percentile).
Fig. 4
Fig. 4. Screening of MAO-A expression after chemotherapeutic treatment.
A Quantification of epithelial and stromal MAO-A IRS within cancerous areas of 13 selected chemotherapy and control patients (Mann–Whitney test; *, P < 0.05; **, P < 0.01; Box Whisker Plot with 10–90 percentile) and representative microscopy images. Magnification: 20× (scale bar = 50 µm) and 63× (scale bar = 20 µm). B Representative western blots for MAO-A protein expression after single treatment with either 100 nM Dex or 3 nM docetaxel, or combination of both drugs for 72 h within different cell models. C Basal MAO-A mRNA and protein expression in different parental and docetaxel resistant cell models. mRNA data represent mean + SE from three independent experiments (unpaired t-test; **, P < 0.01). D Representative western blots for MAO-A protein expression, after single treatment with either 100 nM Dex or 12.5 nM docetaxel, or combination of both drugs for 72 h within different docetaxel resistant cell models. E Basal cell viability after 5 days for PF179TCAF, PC3, and DU145 cells containing a constitutive MAO-A overexpression or control vector. F Cell viability screen after 5 days for PF179TCAF, PC3, and DU145 cells containing a constitutive MAO-A overexpression or control vector in the presence of increasing concentrations of docetaxel.
Fig. 5
Fig. 5. Significantly elevated MAO-A expression during tumor progression.
A MAO-A mRNA expression in benign and cancerous cryo tissue samples of 40 primary PCa specimens and MAO-A mRNA expression of 52 benign and 498 cancerous samples from the TCGA database (unpaired t-test; **, P < 0.01; ***, P < 0.001, Box Whisker Plot with 10–90 percentile). B Quantification of MAO-A IRS of 193 benign, 172 primary and 17 CRPC resection tissue samples as well as further stratification in low GS (≤6), intermediate GS [7], high GS (≥8) patients and in different tumor stages (Kruskal–Wallis test and correction for multiple testing using Dunn´s comparison test; *, P < 0.05;***, P < 0.001, Box Whisker Plot with 10–90 percentile). Representative microscopy images. Magnification: 20× (scale bar = 50 µm). C Kaplan–Maier analysis of progression-free survival (progression is defined as re-rising PSA levels (>0.2 ng/ml) within at least two consecutive measurements) of tumor relapse patients with low/intermediate (IRS ≥ 10) or strong (IRS < 10) MAO-A expression in tumor sections [Log Rank (Mantel Cox); P value: 0.028]. D Measurement of cell proliferation and cell viability as well as western blot analysis for cPARP and p21 protein expression after transient transfection with either 25 nM siMAO-A or scrambled neg.C for 9 d. Data represent mean + SE from three independent experiments (unpaired t-test; ***, P < 0.001). E Schematic illustration of tumor progression. Current treatment options for different progression steps and the combination with potential pharmacological MAO-A inhibition in LNCaP and corresponding resistant LNCaP cell sub-lines as representative preclinical in vitro treatment models. F Representative western blot analysis for AR, GR and MAO-A protein expression in hormone naïve parental and therapy resistant LNCaP cells.
Fig. 6
Fig. 6. Consequences of MAO-A inhibition for PCa cell growth and viability.
A Measurement of LNCaP cell growth and representing cell pictures after 9 d treatment with increasing concentrations (5 µM, 10 µM, 20 µM) of the specific MAO-A inhibitor clorgyline. Data represent mean + SE from four independent experiments (one-way ANOVA and correction for multiple testing using Dunnett´s comparison test; *, P < 0.05; ***, P < 0.001). B Measurement of cell cycle distribution and percentage of apoptotic cells, as well as western blot analysis for p21 protein expression after treatment with increasing clorgyline concentrations for 9 d. Data represent mean + SE from four independent experiments (one-way ANOVA and correction for multiple testing using Dunnett´s comparison test; *, P < 0.05; **, P < 0.01; ***, P < 0.001). C LNCaP and LNCaPabl cell growth measurement after 9 d treatment with 10 µM clorgyline alone or in combination with 2.5 µM enzalutamide, apalutamide, or darolutamide. Data represent mean + SE from at least three independent experiments (one-way ANOVA and correction for multiple testing using Bonferroni´s comparison test; **, P < 0.01; ***, P < 0.001). D LNCaP, LNCaPabl, and abl-Enza cell growth measurement after 9 d treatment with 10 µM clorgyline alone or in combination with 2.5 µM abiraterone. Data represent mean + SE from at least three independent experiments (one-way ANOVA and correction for multiple testing using Bonferroni´s comparison test; *, P < 0.05; **, P < 0.01; ***, P < 0.001). E LNCaP, LNCaPabl, abl-Enza, abl-Abi cell growth measurement after 9 d treatment with 10 µM clorgyline alone or in combination with 0.4 nM (for LNCaP, LNCaPabl, abl-Enza) or 0.75 nM (for abl-Abi) docetaxel or cabazitaxel. Data represent mean + SE from at least three independent experiments (one-way ANOVA and correction for multiple testing using Bonferroni´s comparison test; *, P < 0.05; **, P < 0.01; ***, P < 0.001).

References

    1. Hussain M, Fizazi K, Saad F, Rathenborg P, Shore N, Ferreira U, et al. Enzalutamide in Men with Nonmetastatic, Castration-Resistant Prostate Cancer. N Engl J Med. 2018;378:2465–74. doi: 10.1056/NEJMoa1800536. - DOI - PMC - PubMed
    1. Smith MR, Saad F, Chowdhury S, Oudard S, Hadaschik BA, Graff JN, et al. Apalutamide Treatment and Metastasis-free Survival in Prostate Cancer. N Engl J Med. 2018;378:1408–18. doi: 10.1056/NEJMoa1715546. - DOI - PubMed
    1. Fizazi K, Shore N, Tammela TL, Ulys A, Vjaters E, Polyakov S, et al. Darolutamide in Nonmetastatic, Castration-Resistant Prostate Cancer. N Engl J Med. 2019;380:1235–46. doi: 10.1056/NEJMoa1815671. - DOI - PubMed
    1. de Bono JS, Logothetis CJ, Molina A, Fizazi K, North S, Chu L, et al. Abiraterone and increased survival in metastatic prostate cancer. N Engl J Med. 2011;364:1995–2005. doi: 10.1056/NEJMoa1014618. - DOI - PMC - PubMed
    1. Tannock IF, de Wit R, Berry WR, Horti J, Pluzanska A, Chi KN, et al. Docetaxel plus prednisone or mitoxantrone plus prednisone for advanced prostate cancer. N Engl J Med. 2004;351:1502–12. doi: 10.1056/NEJMoa040720. - DOI - PubMed

MeSH terms