. 2021 Apr;53(4):455-466.
doi: 10.1038/s41588-021-00823-0. Epub 2021 Apr 1.

Single-cell chromatin accessibility identifies pancreatic islet cell type- and state-specific regulatory programs of diabetes risk

Affiliations

Single-cell chromatin accessibility identifies pancreatic islet cell type- and state-specific regulatory programs of diabetes risk

Joshua Chiou et al. Nat Genet. 2021 Apr.

Abstract

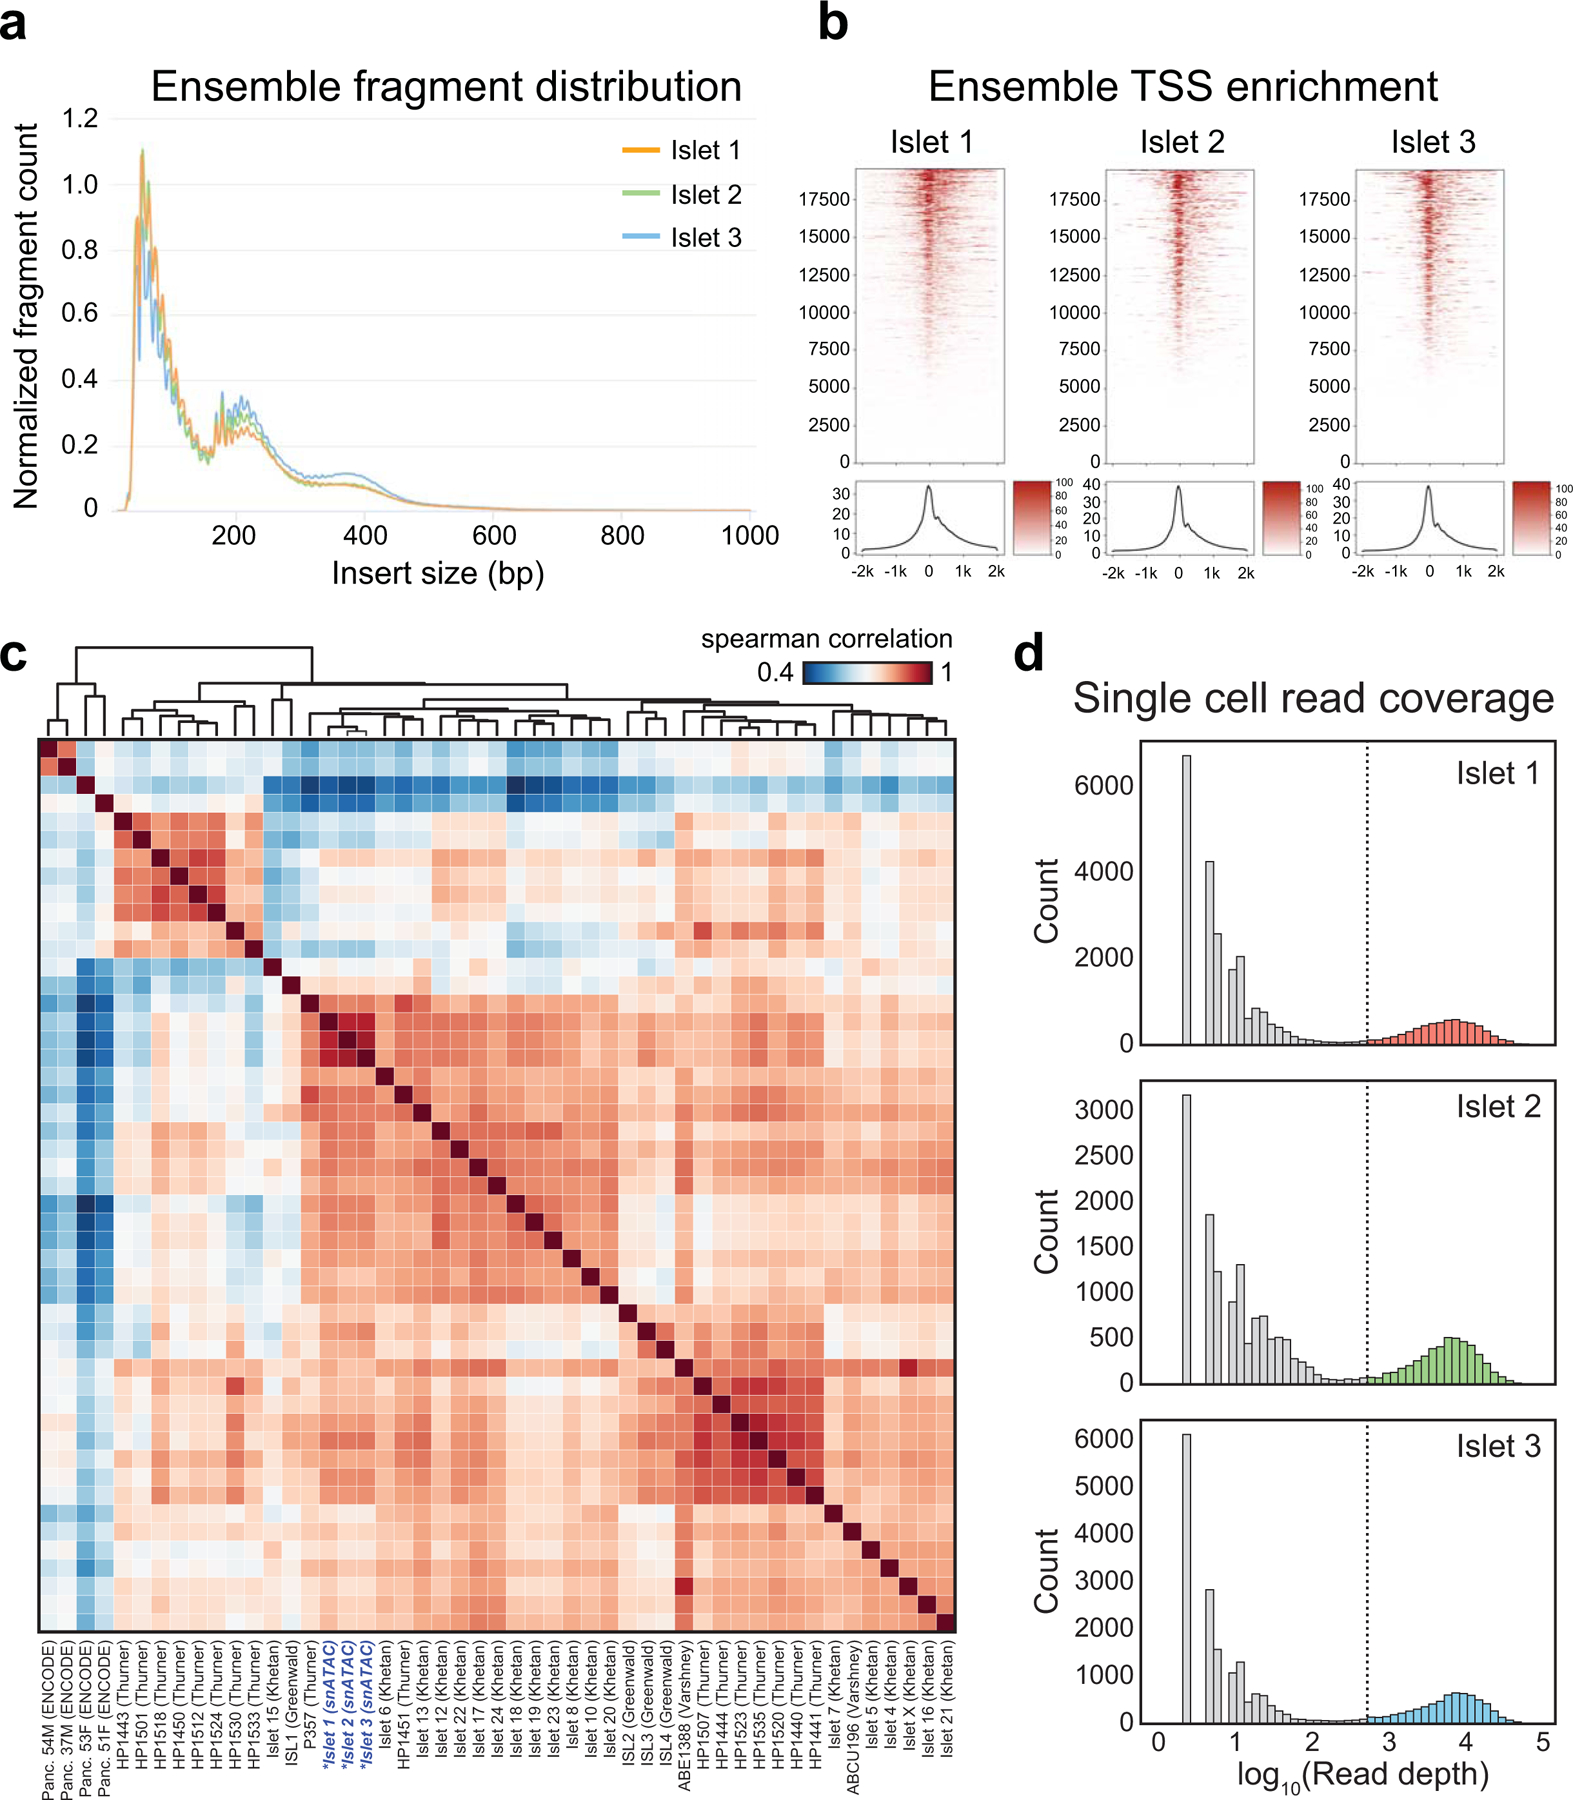
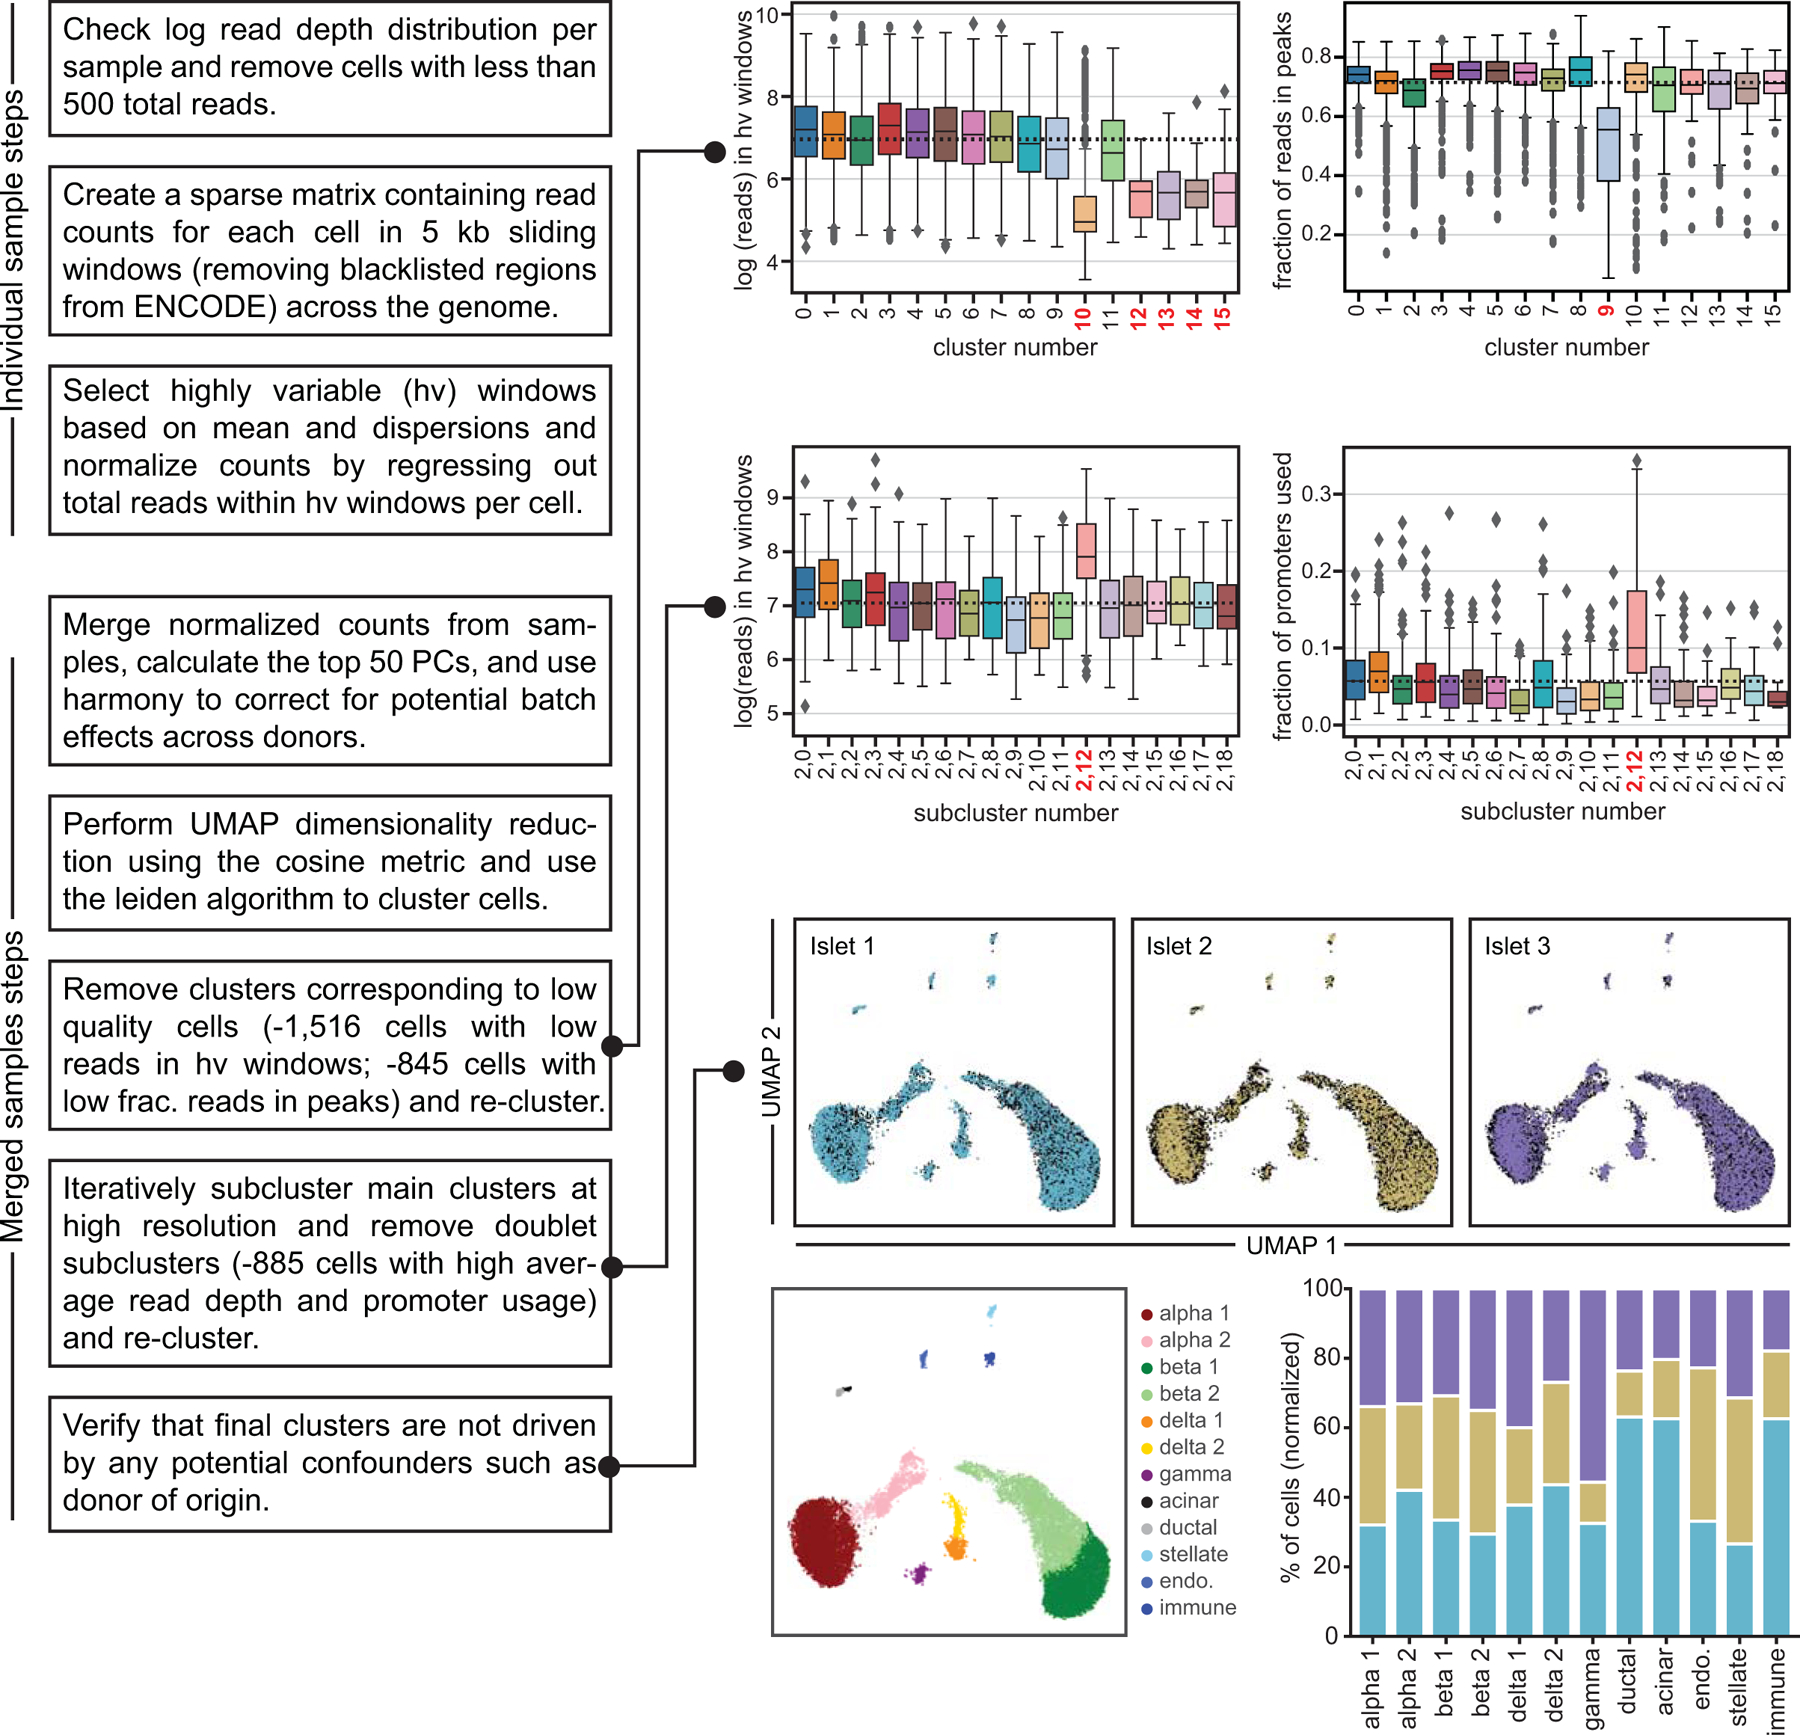
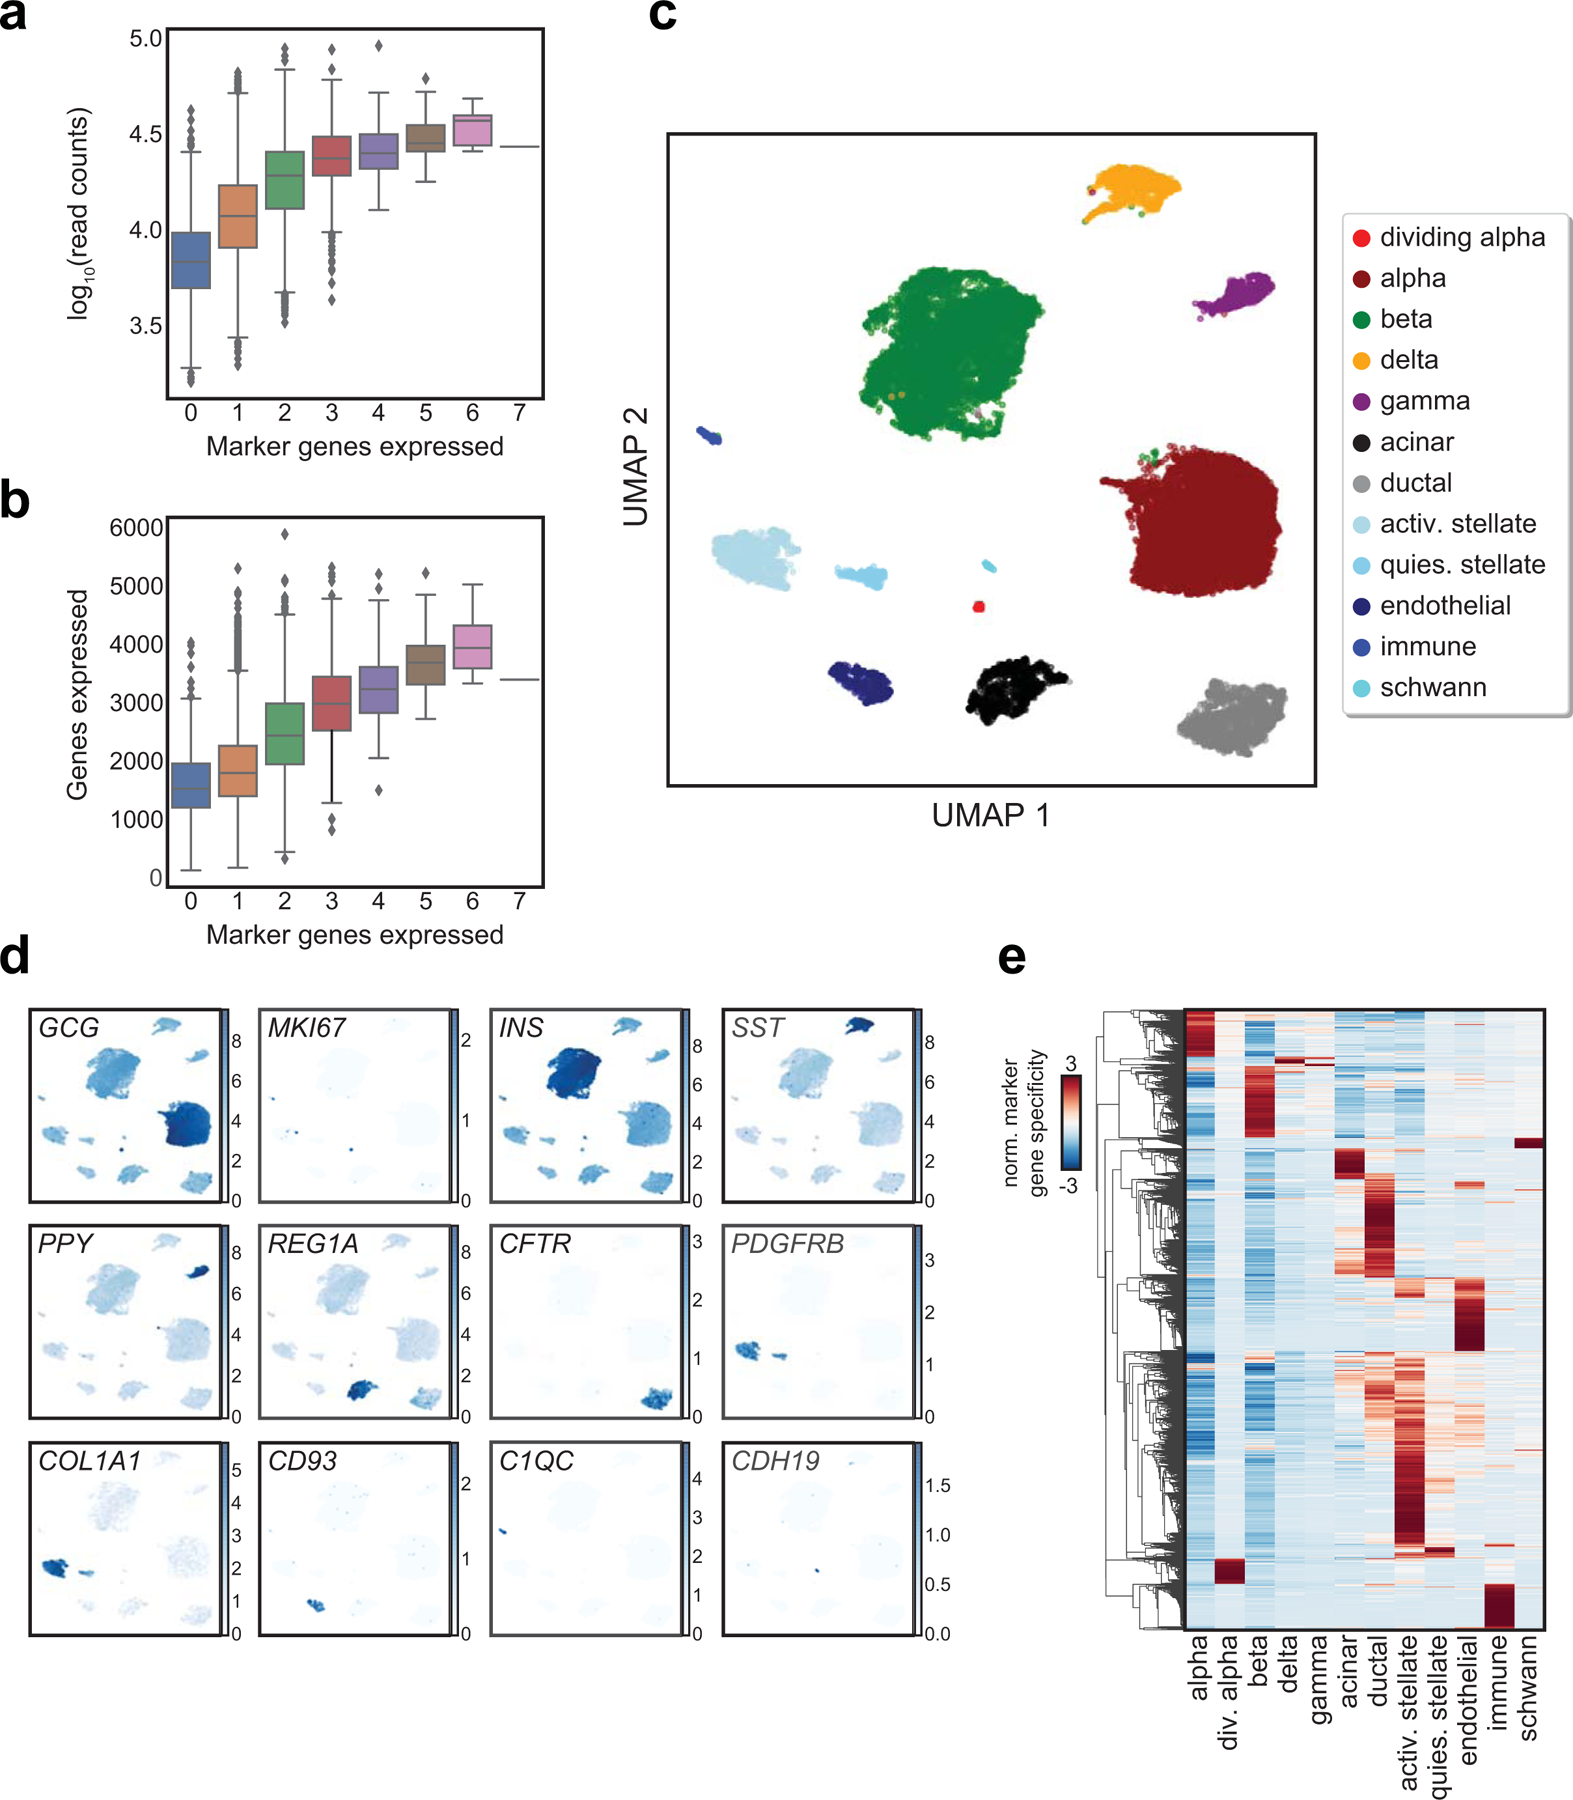
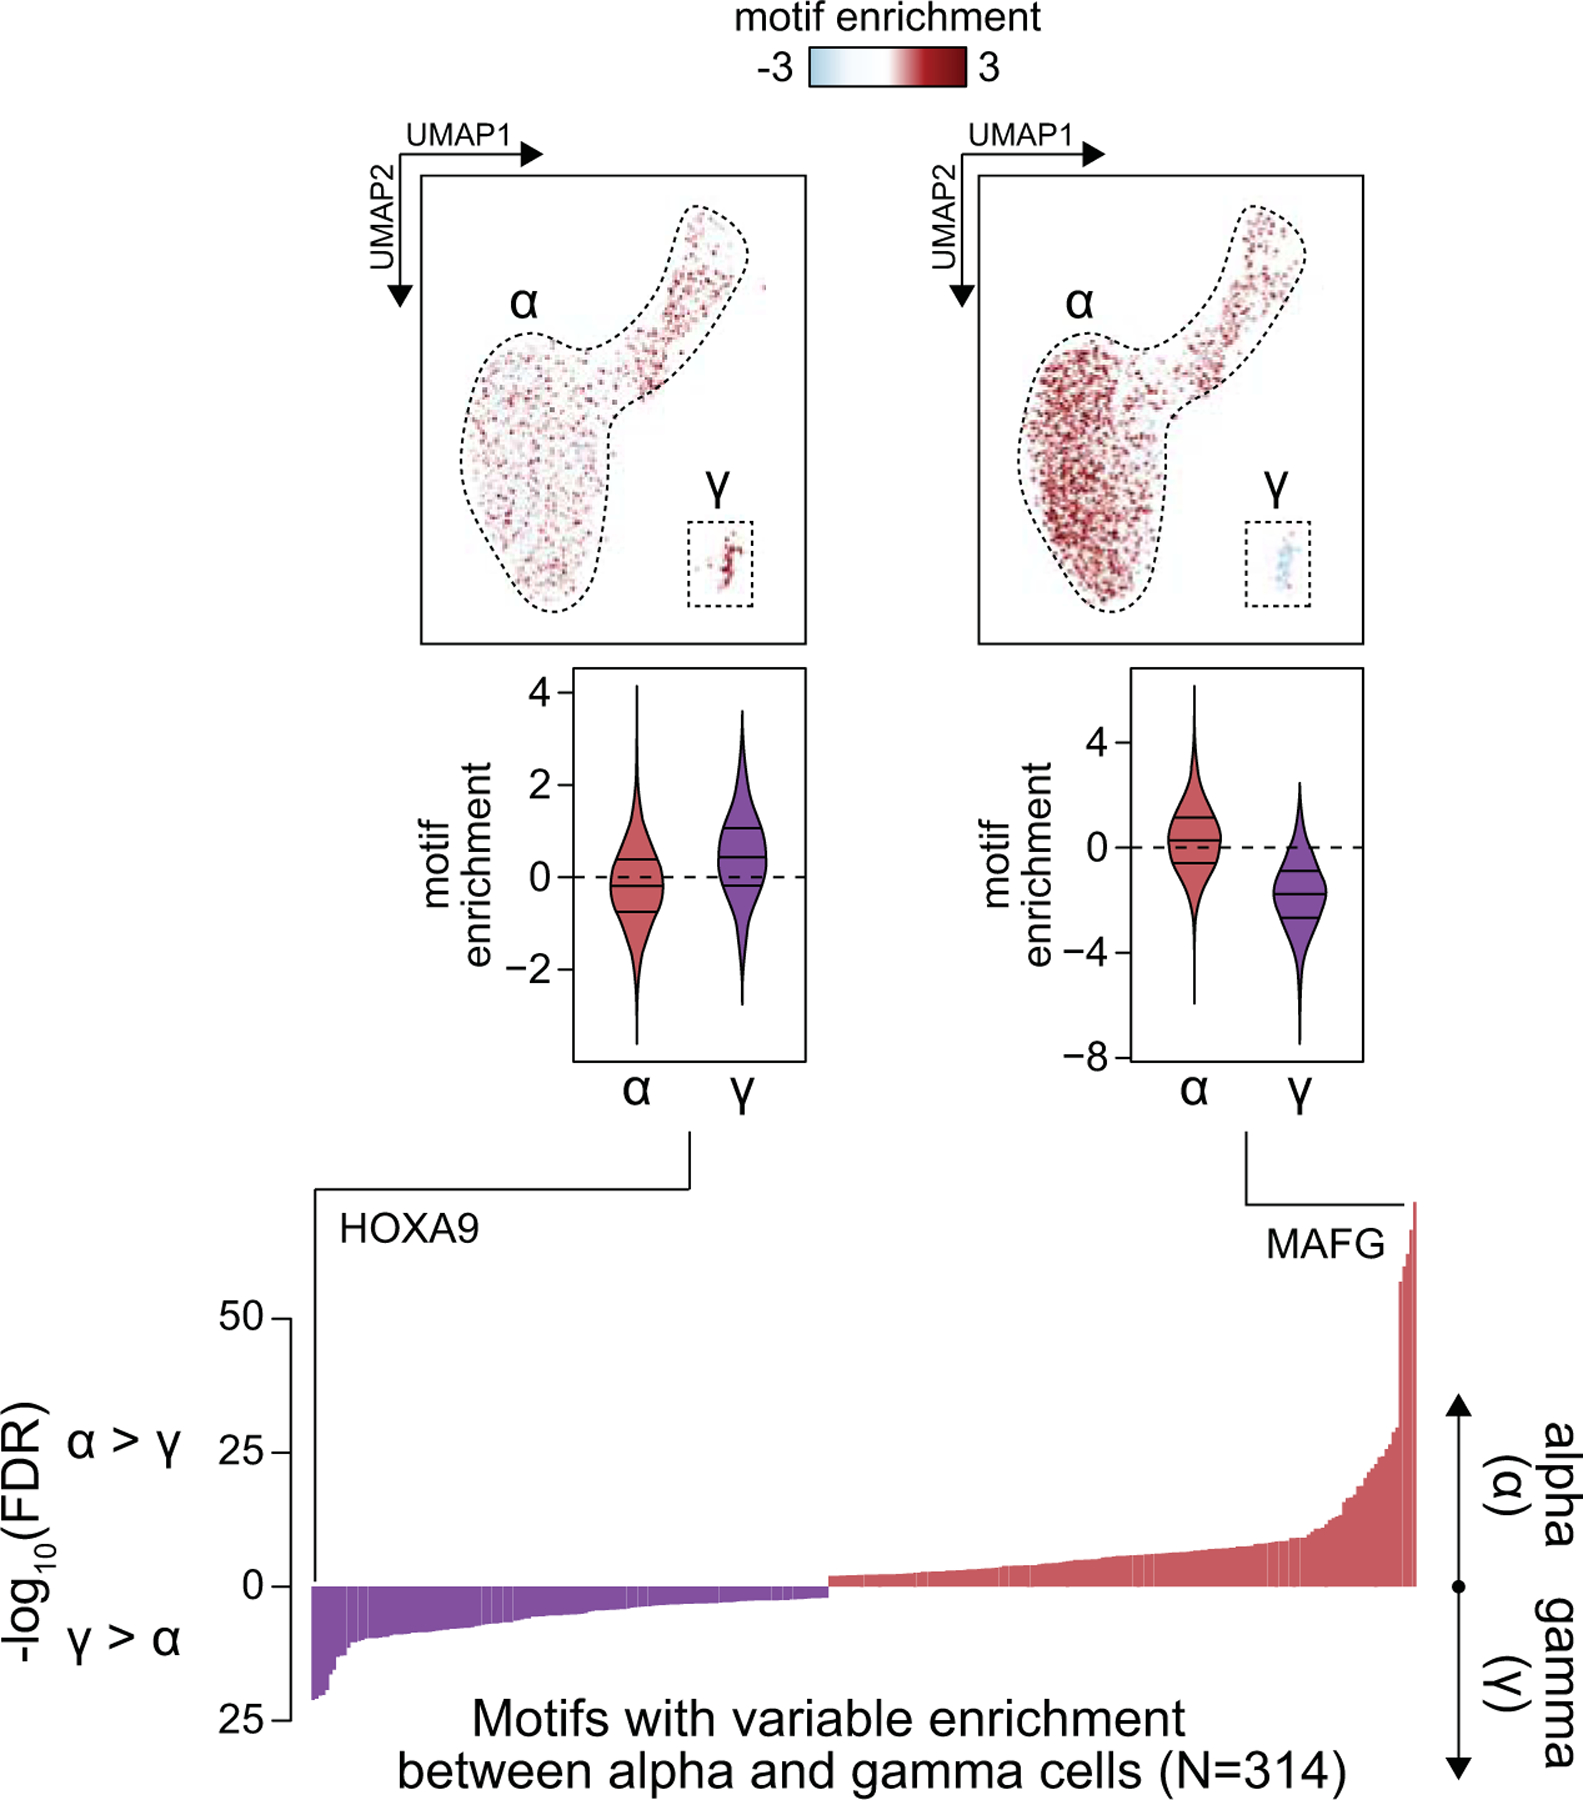
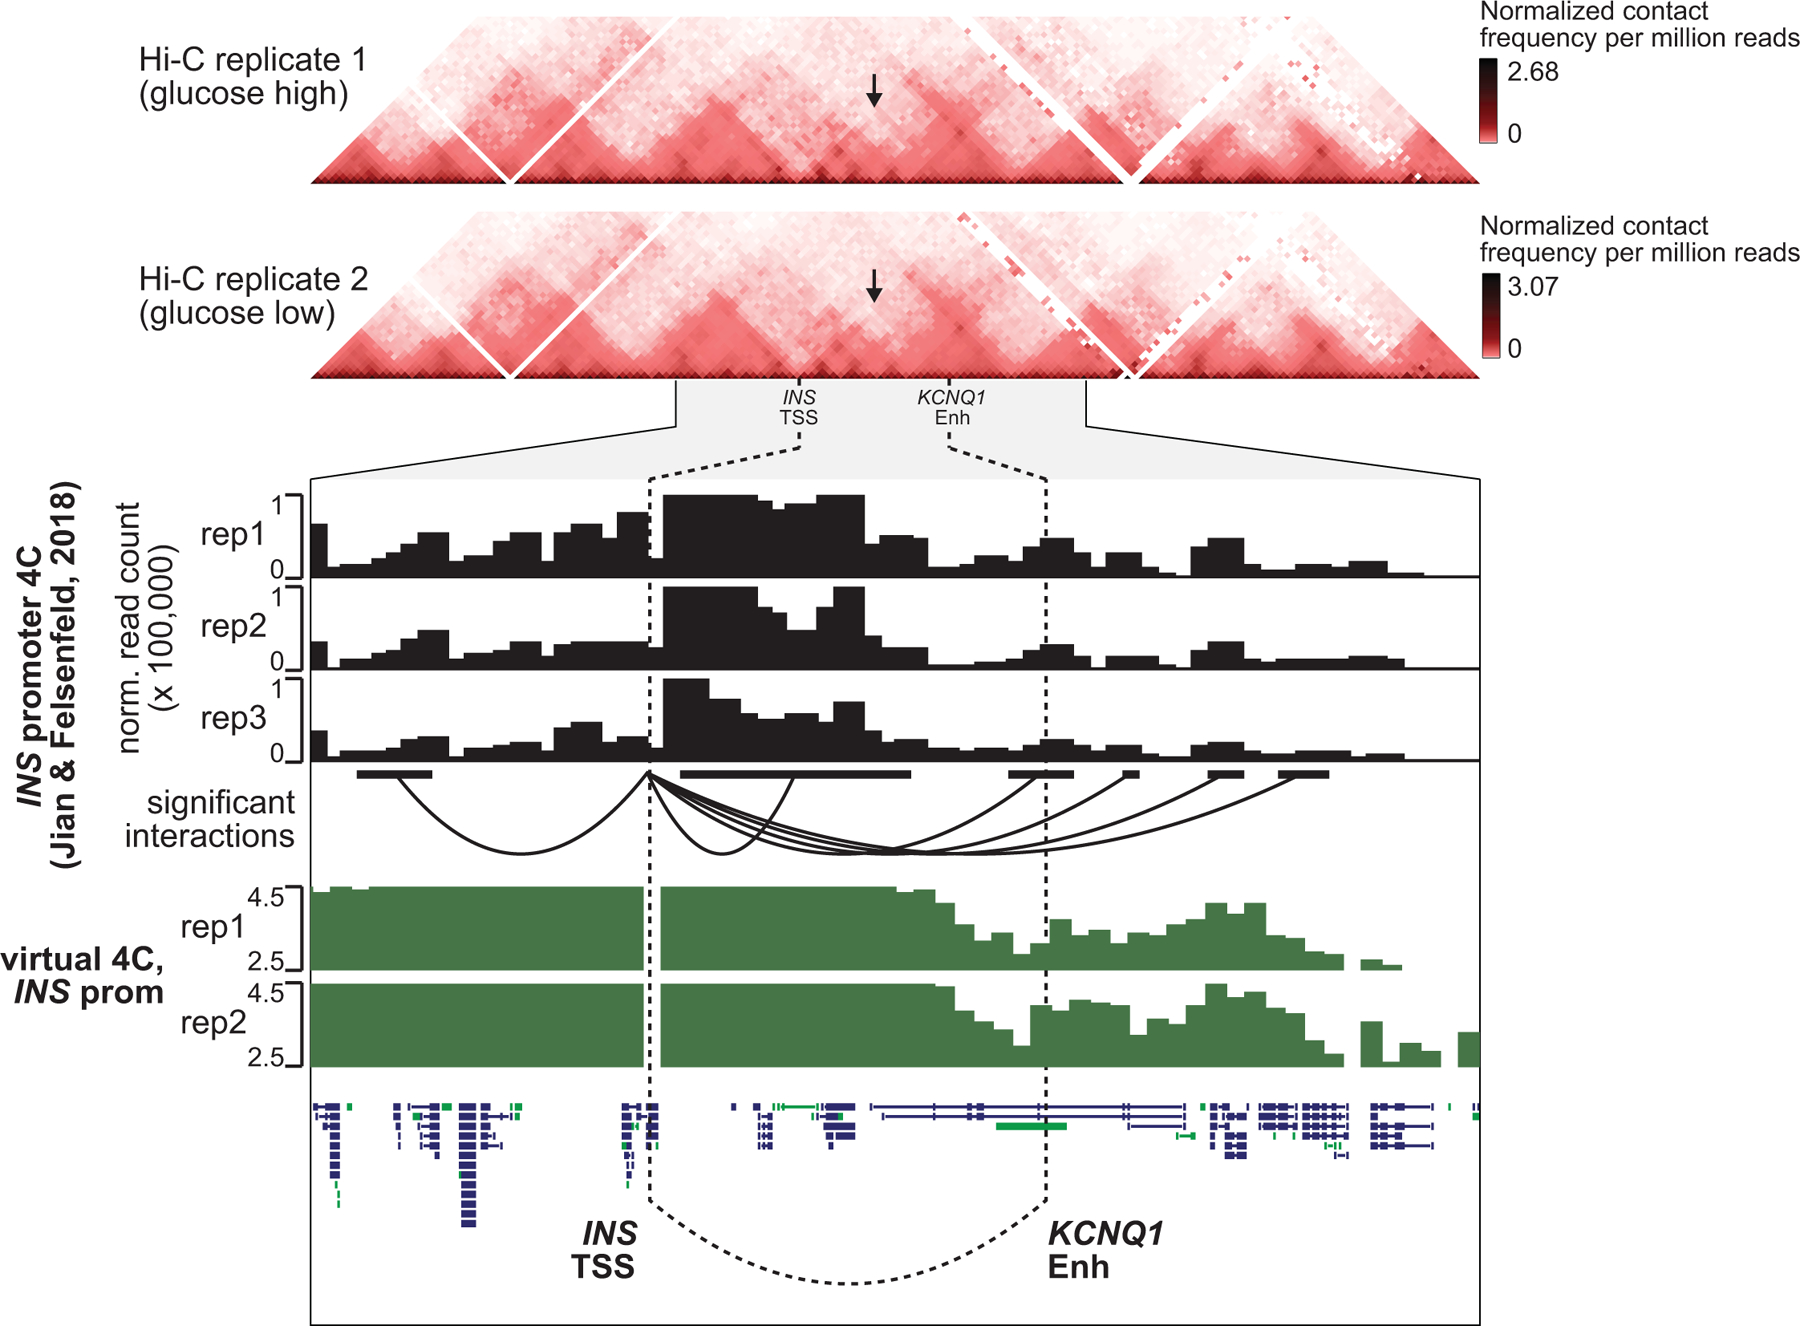
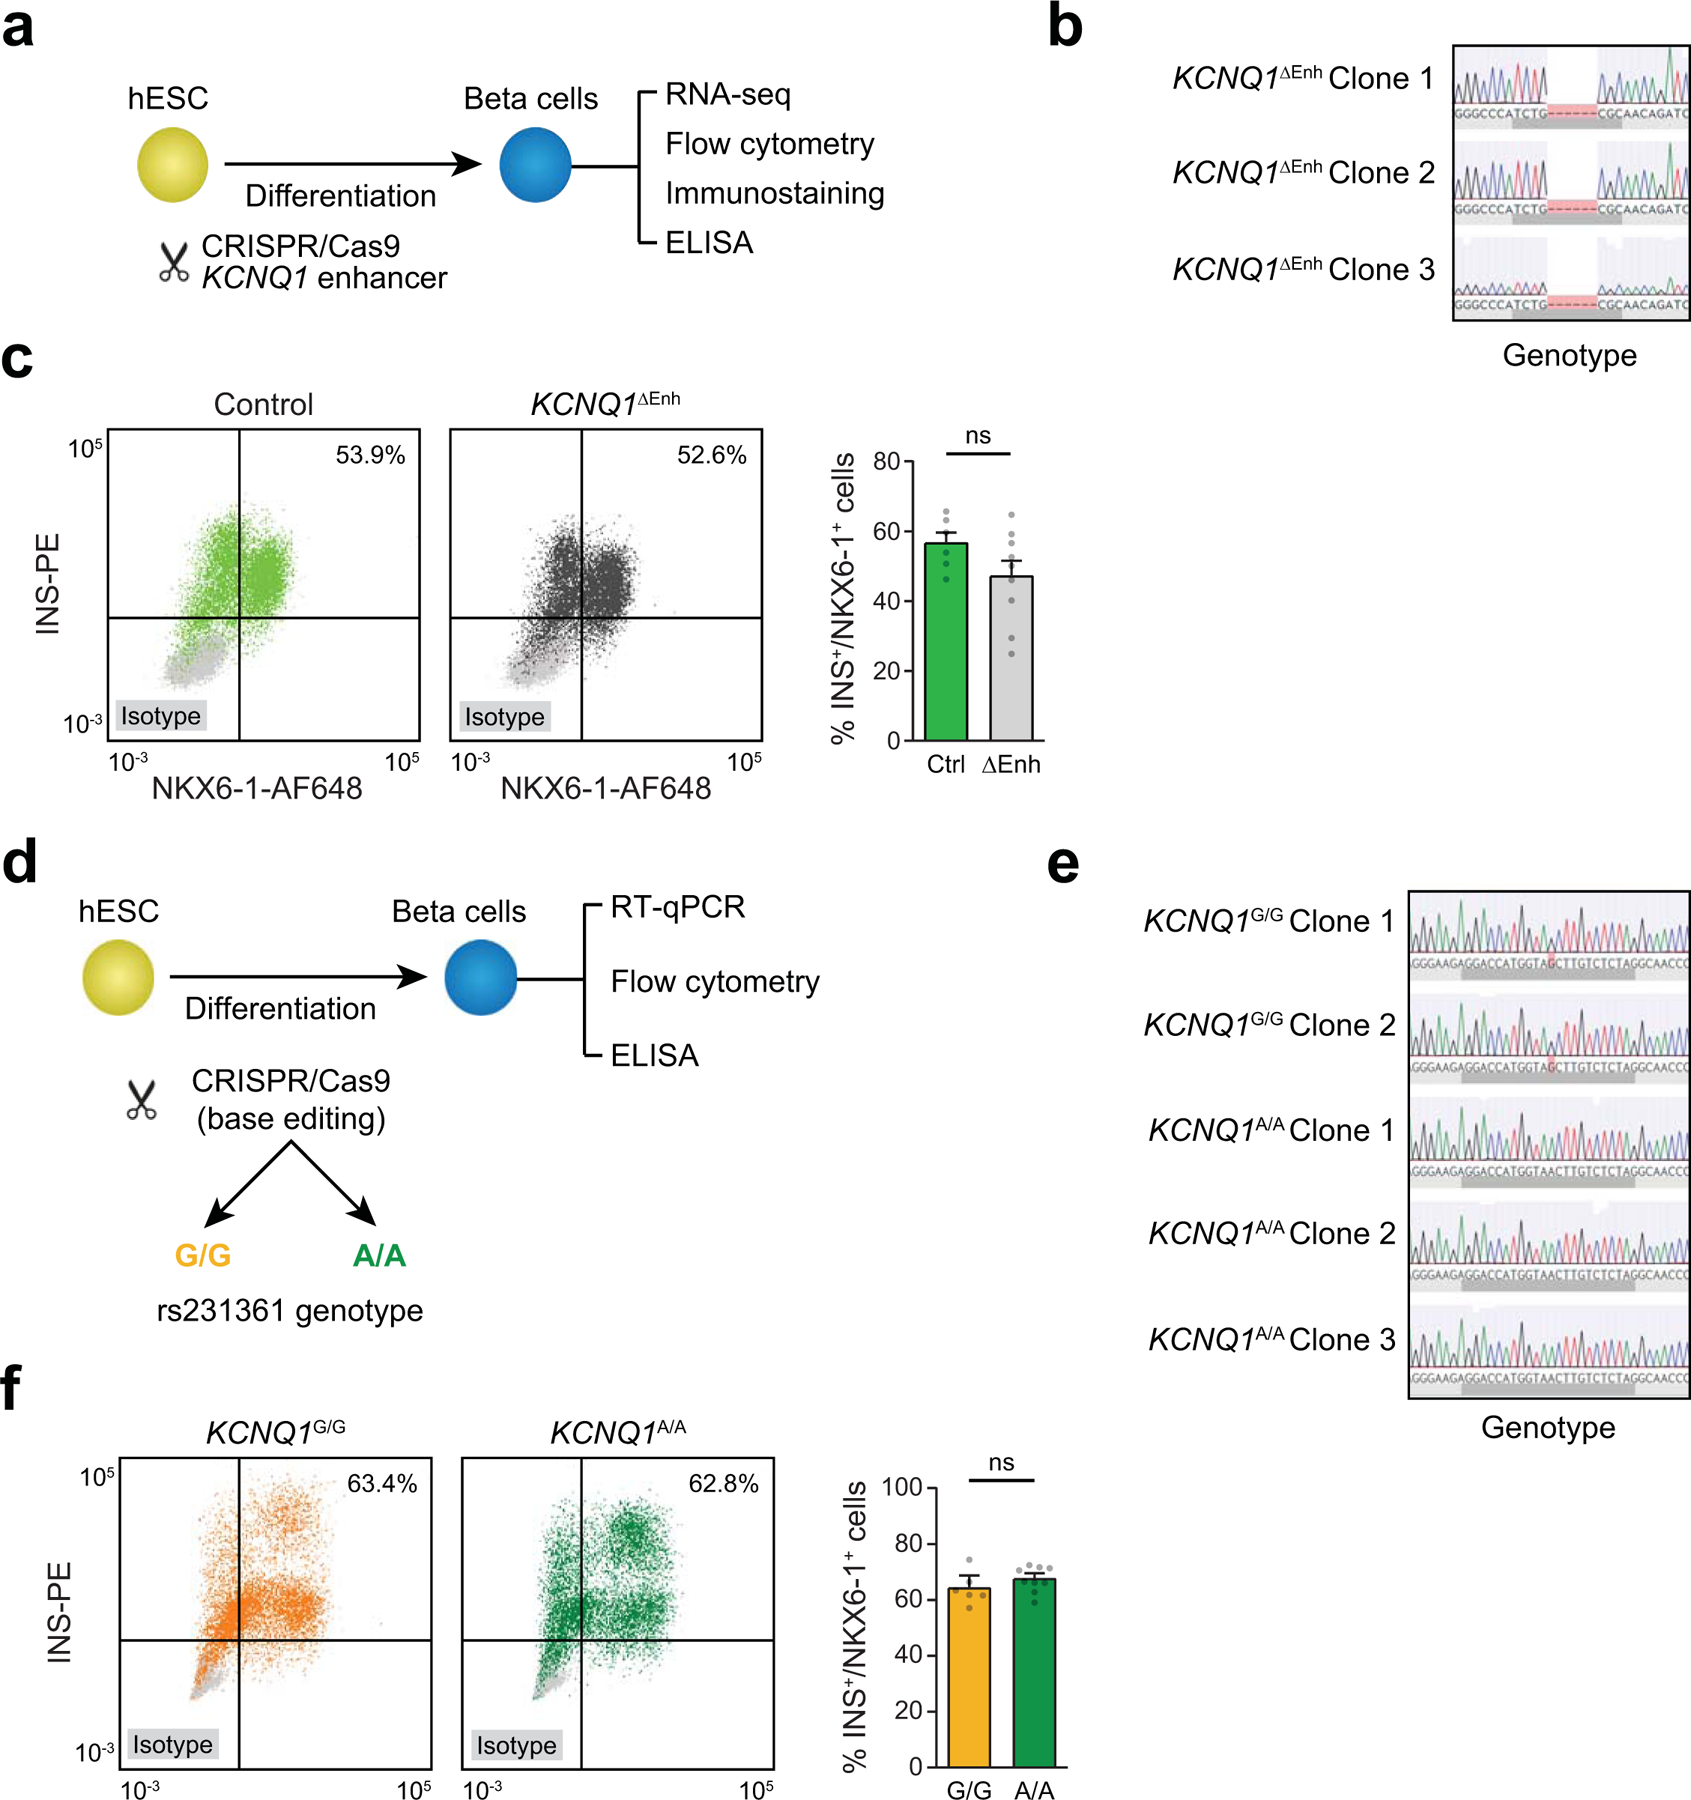
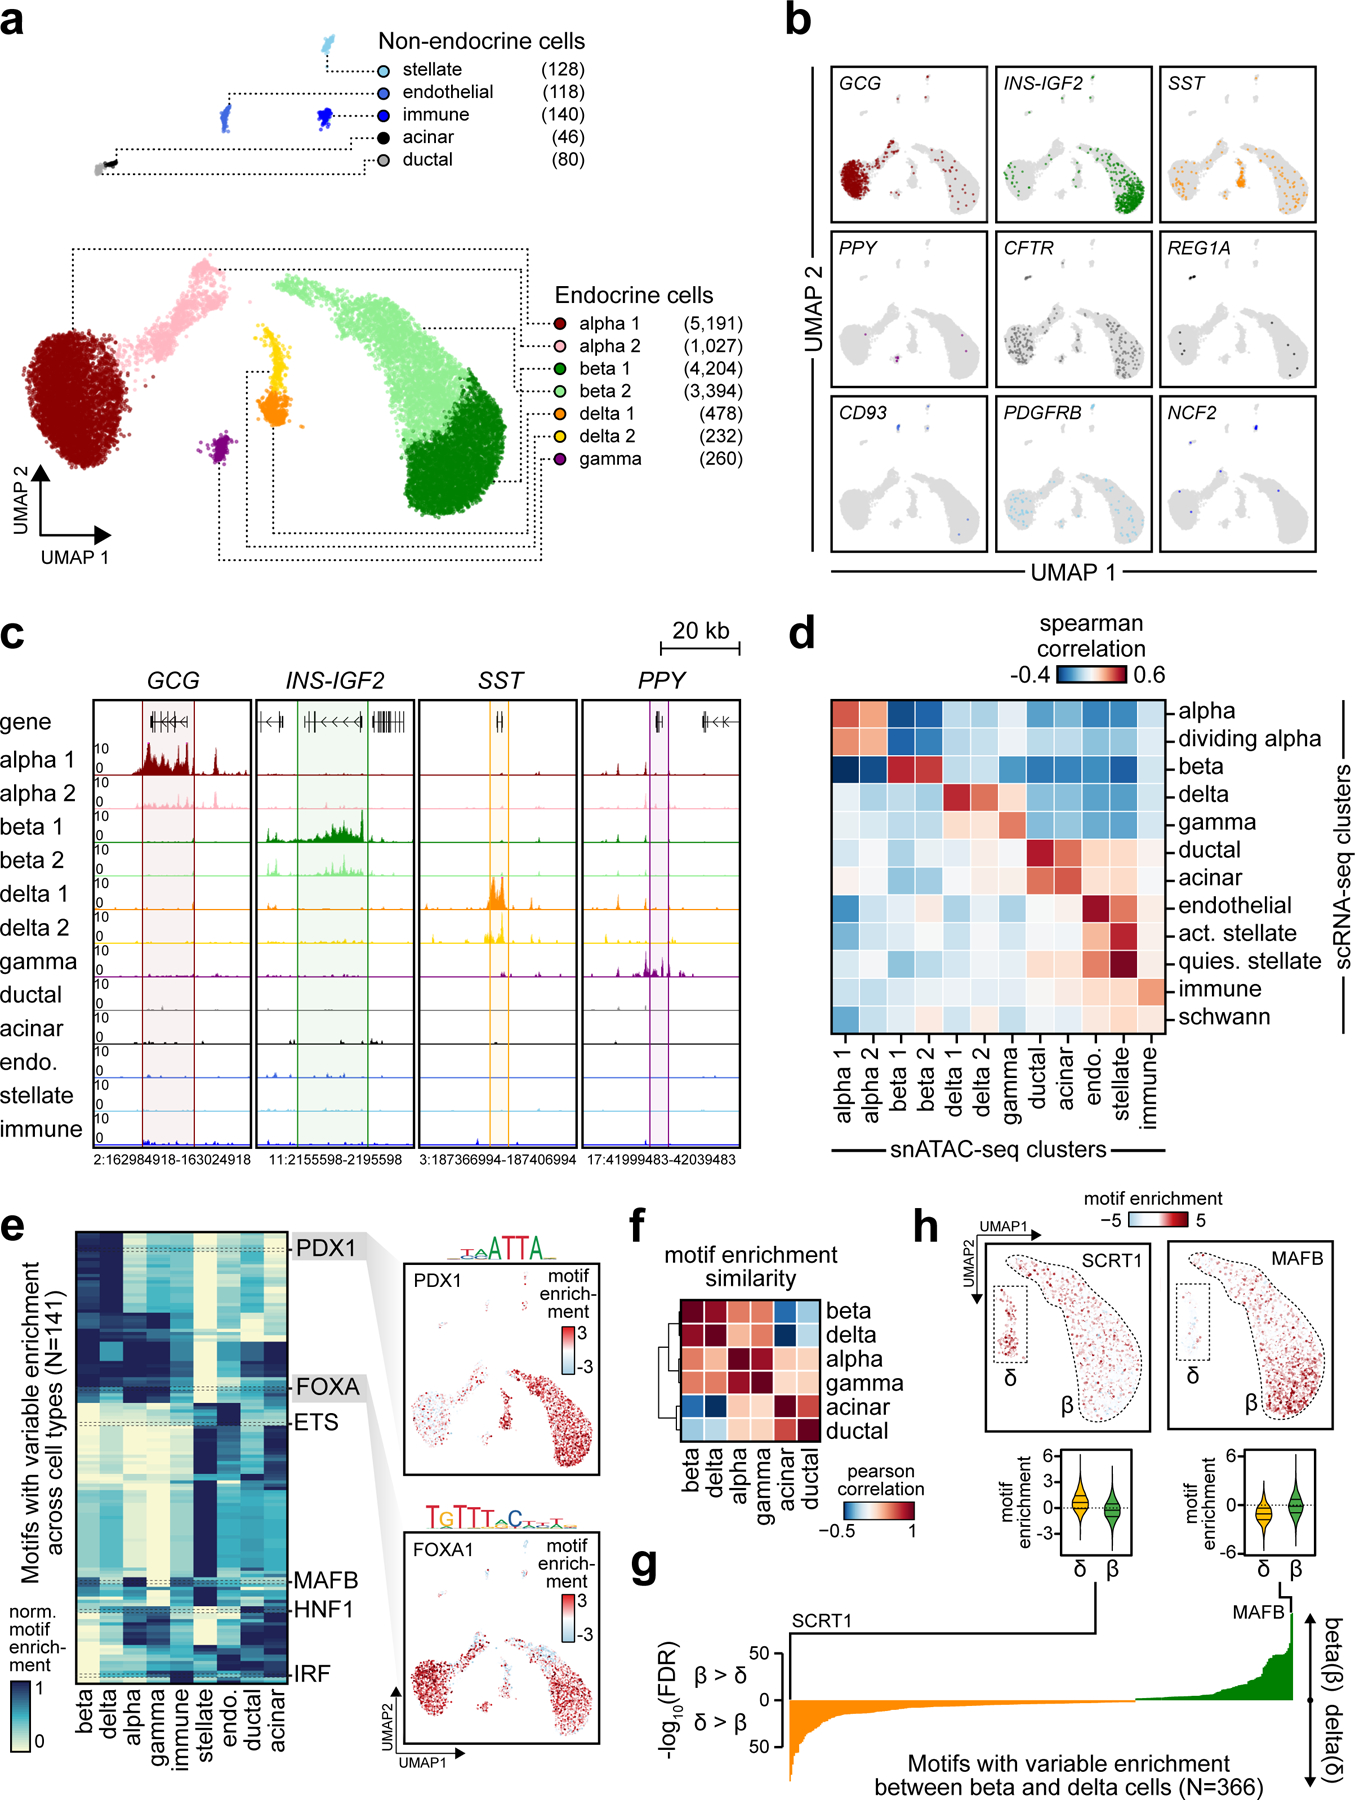
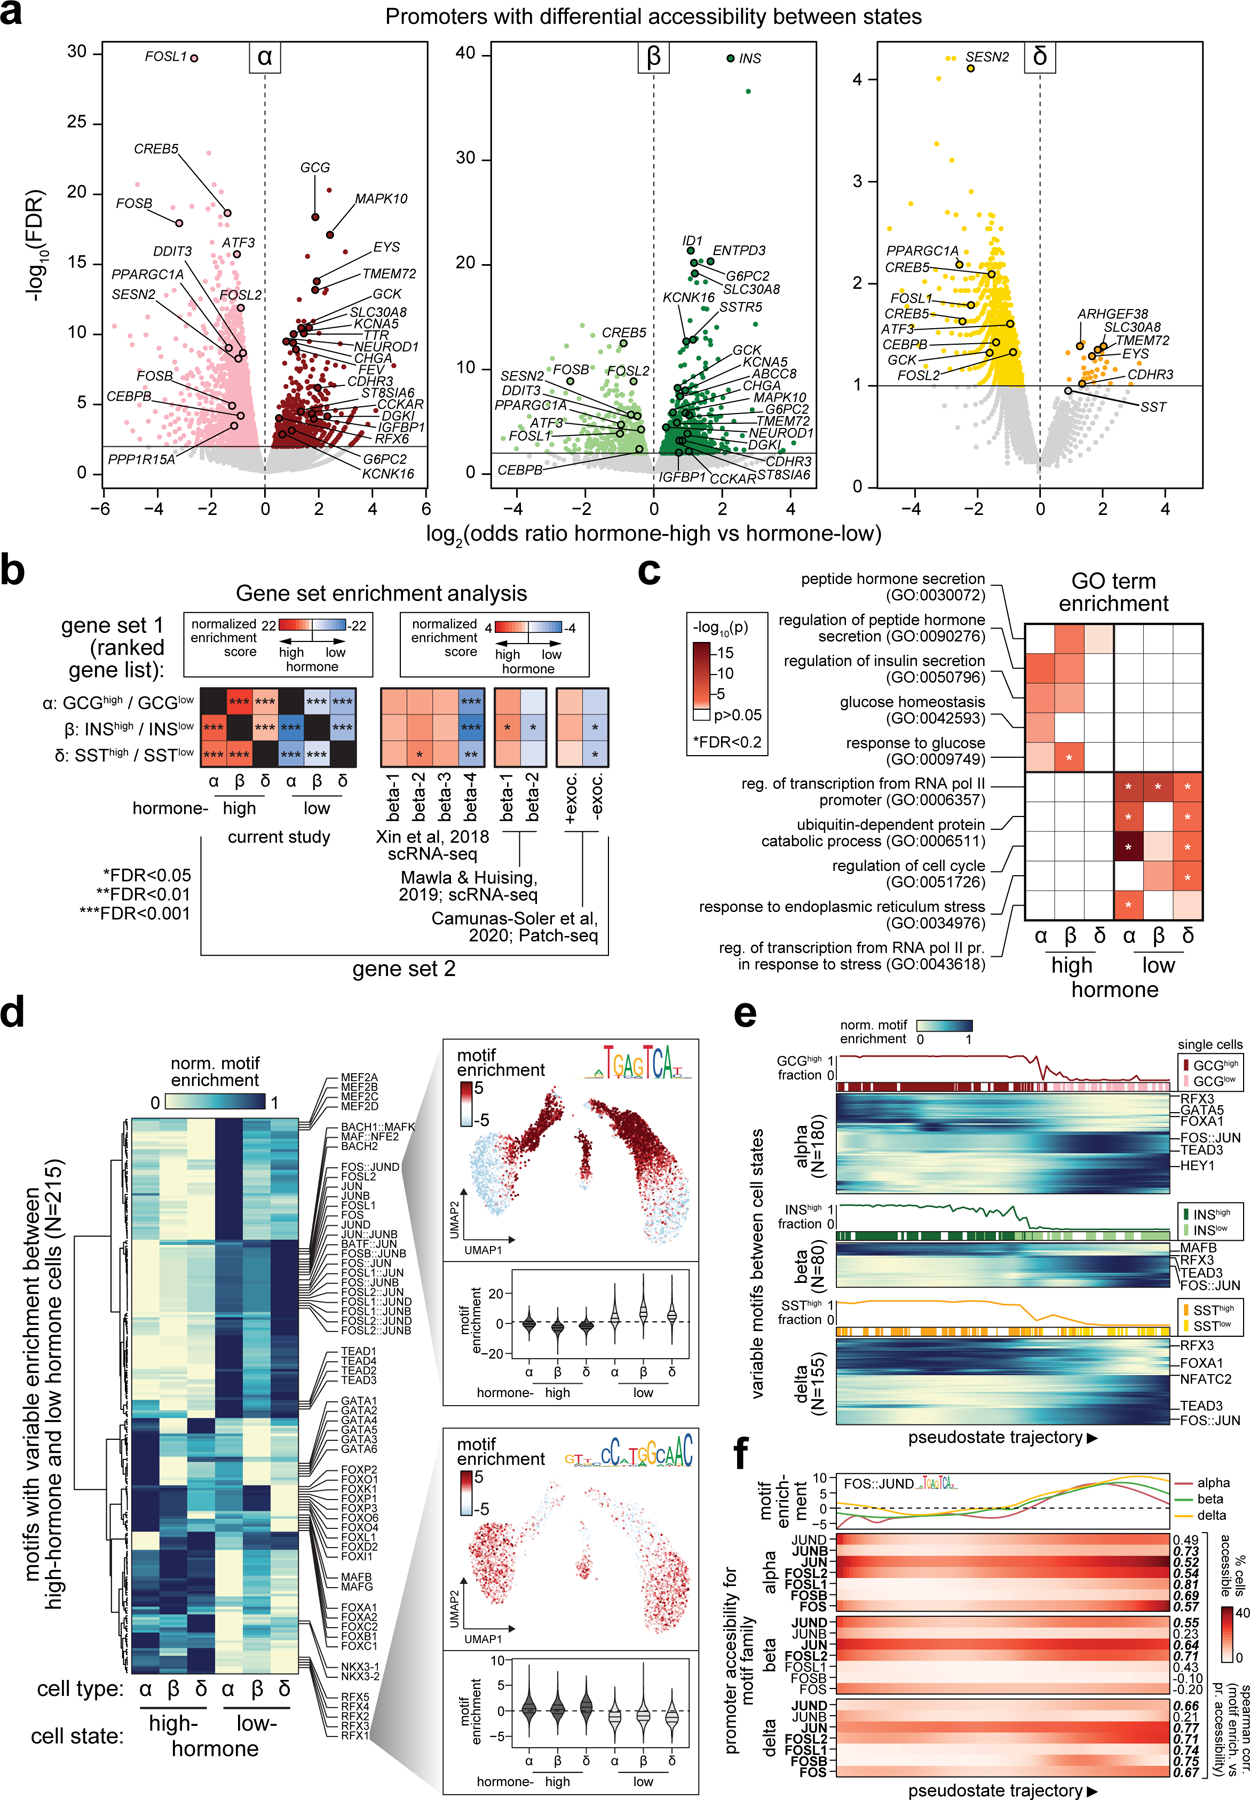
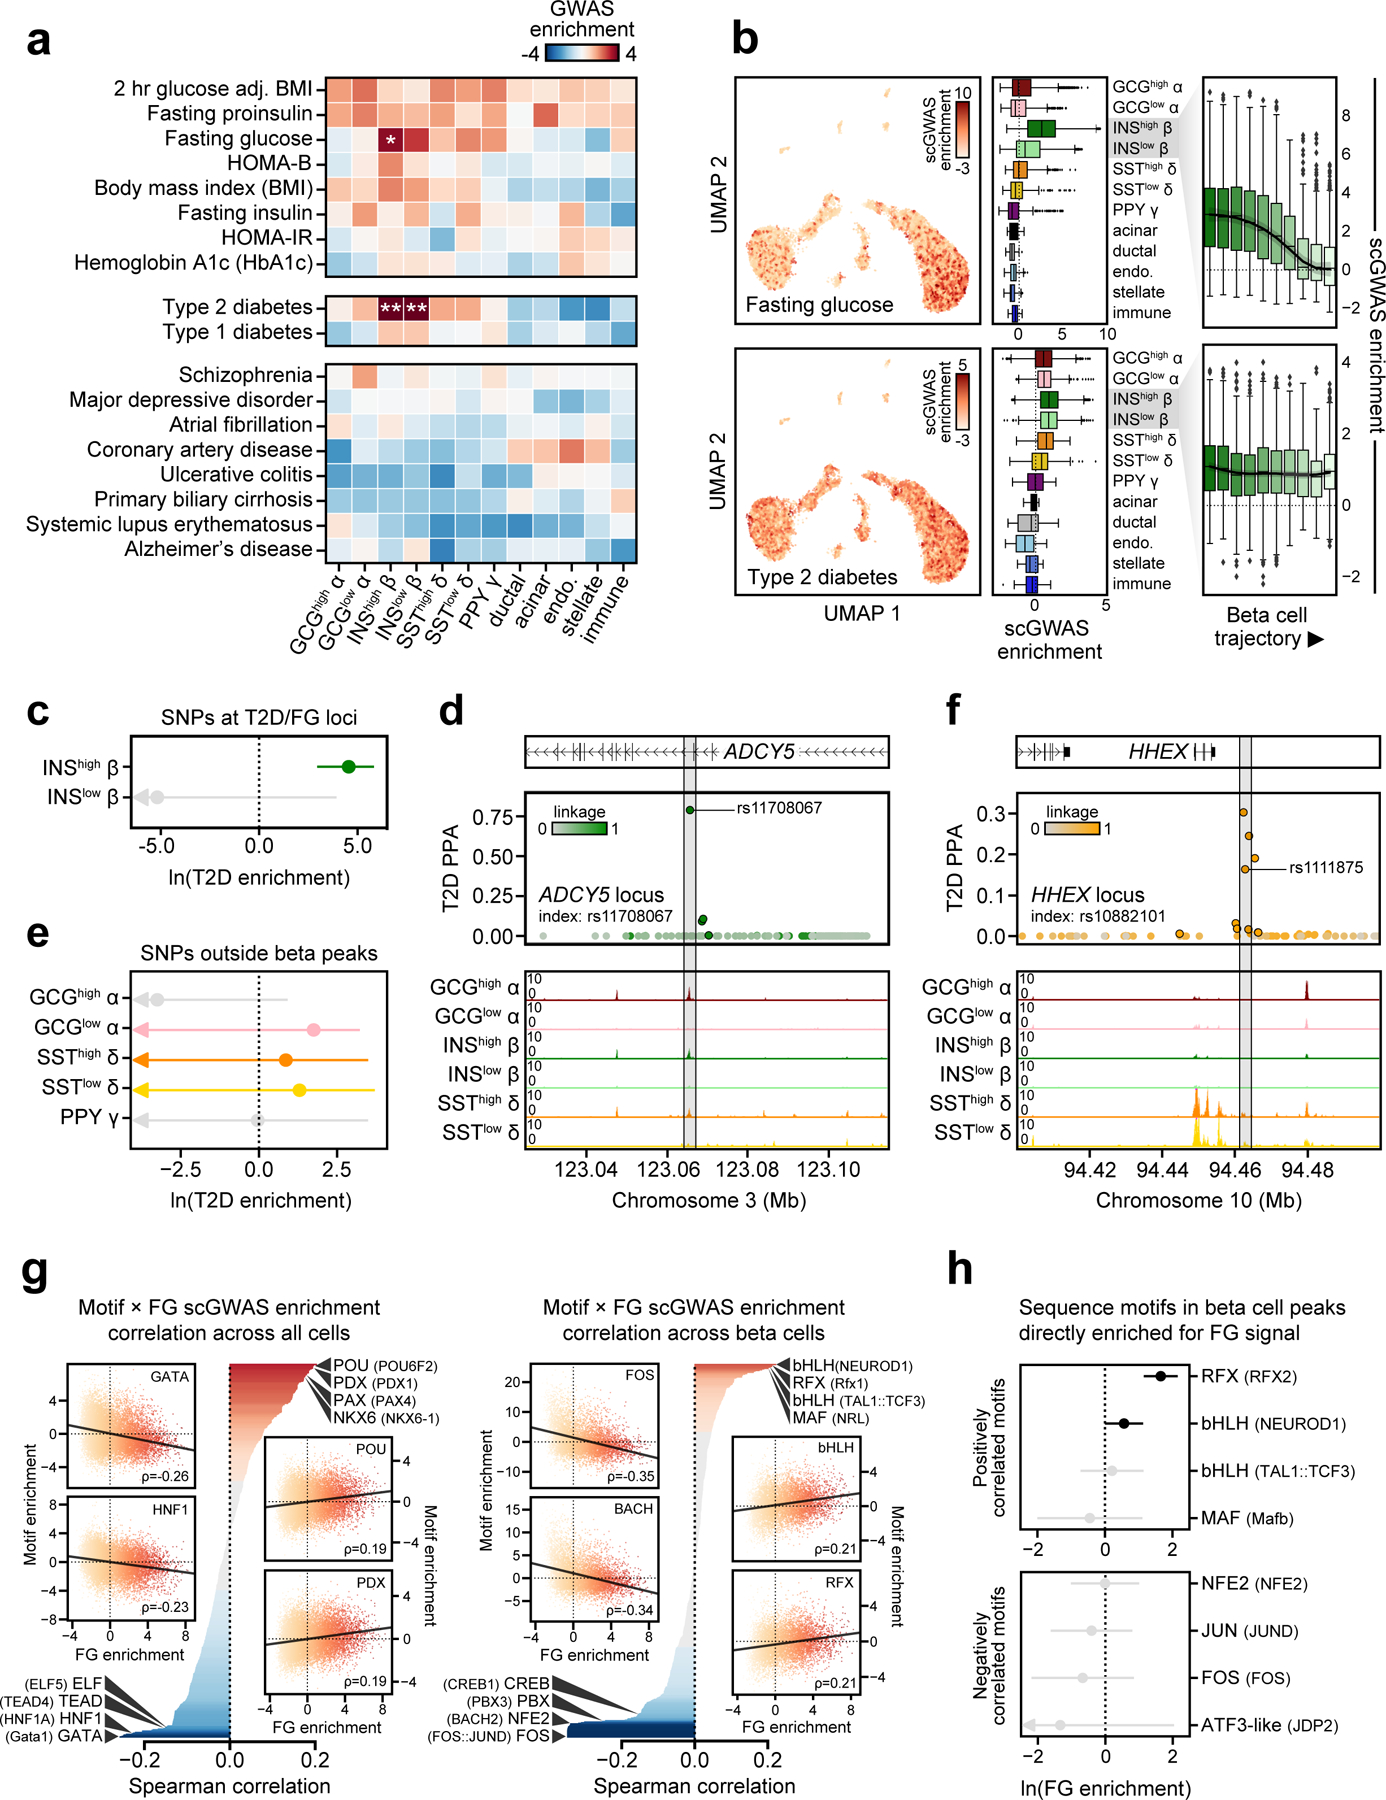
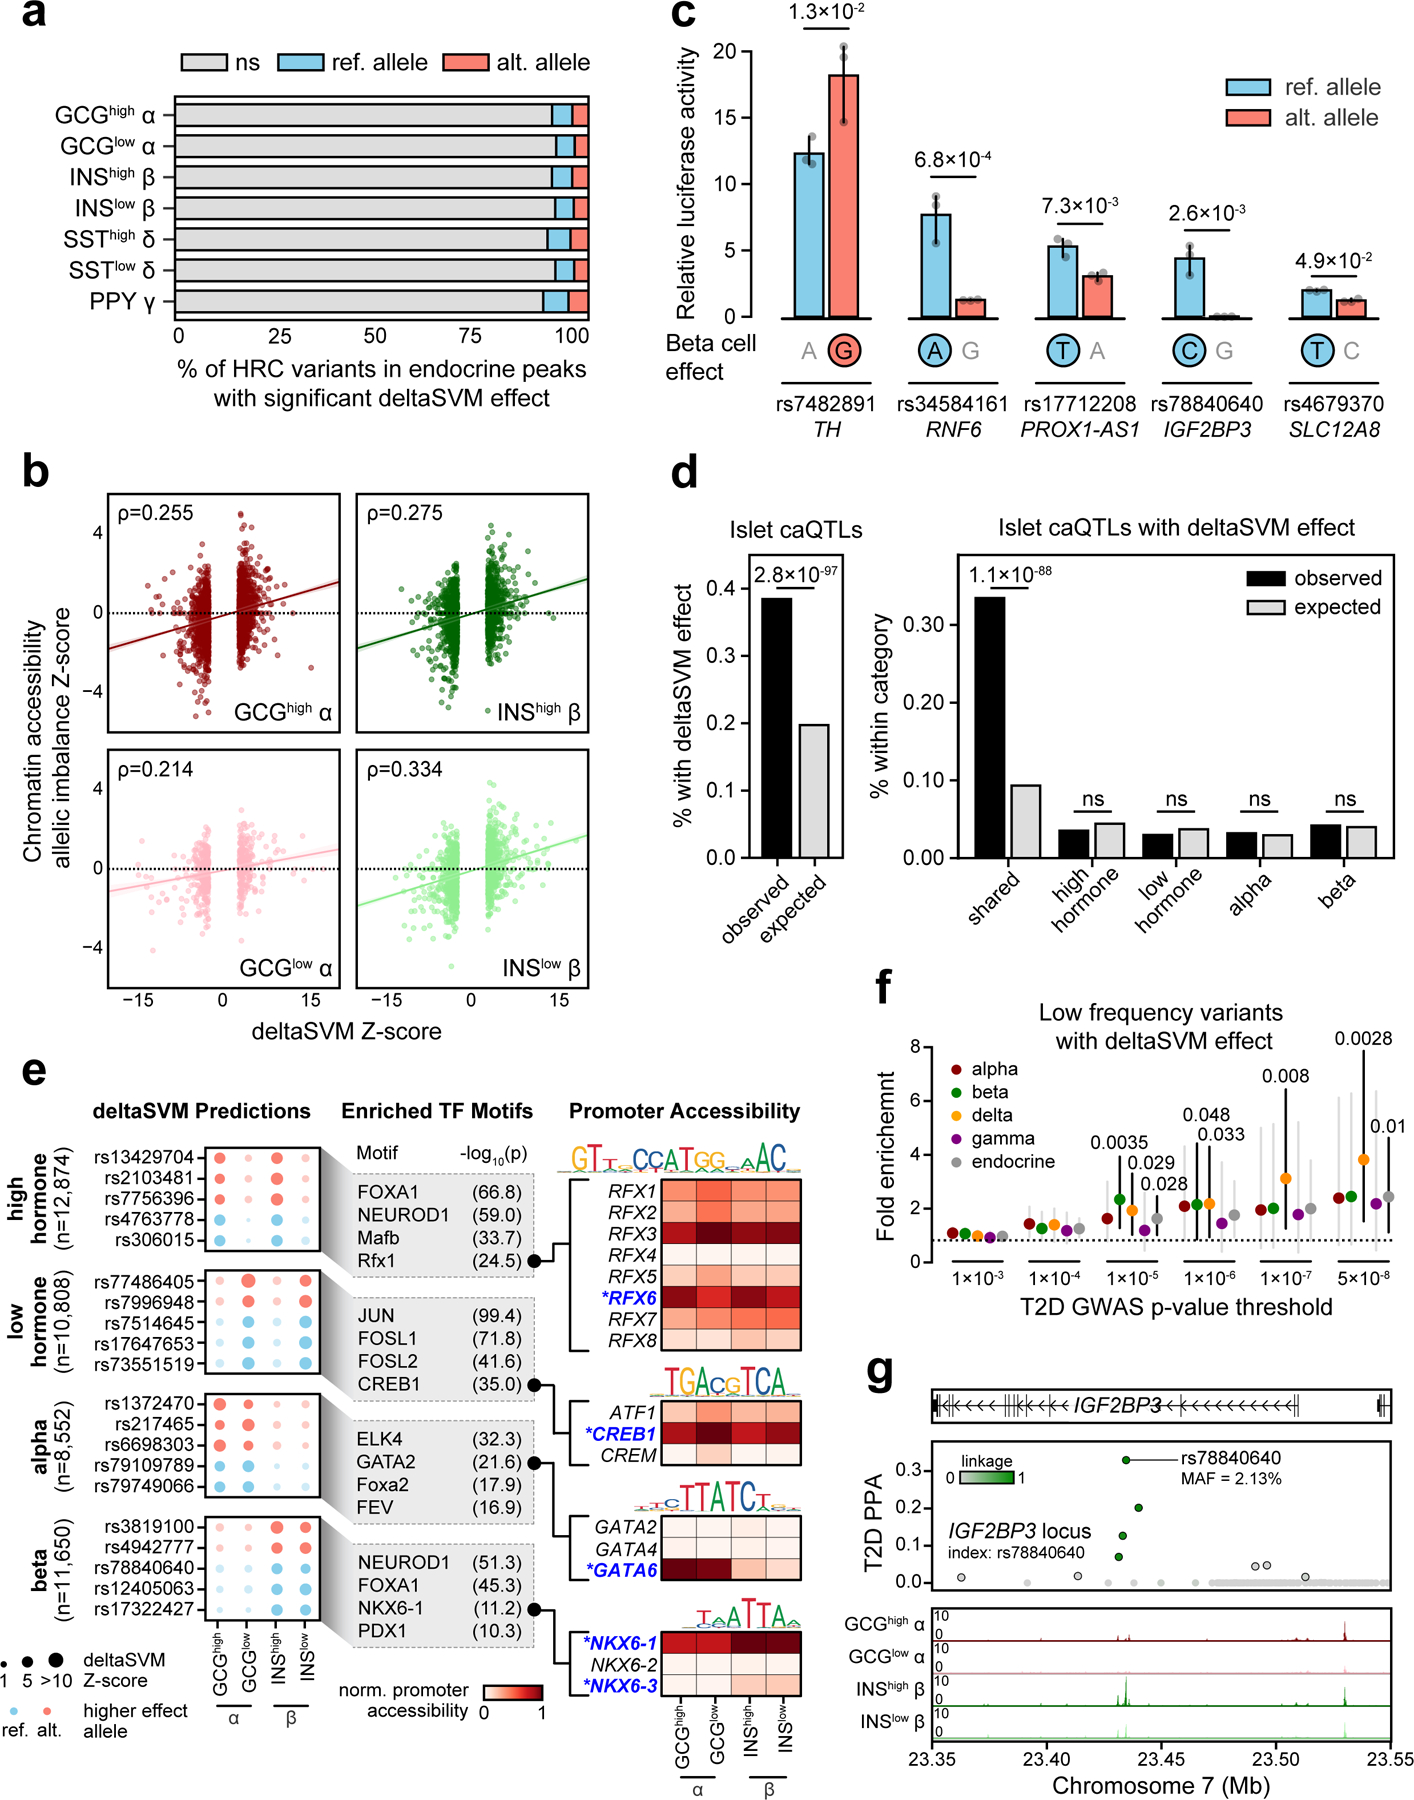
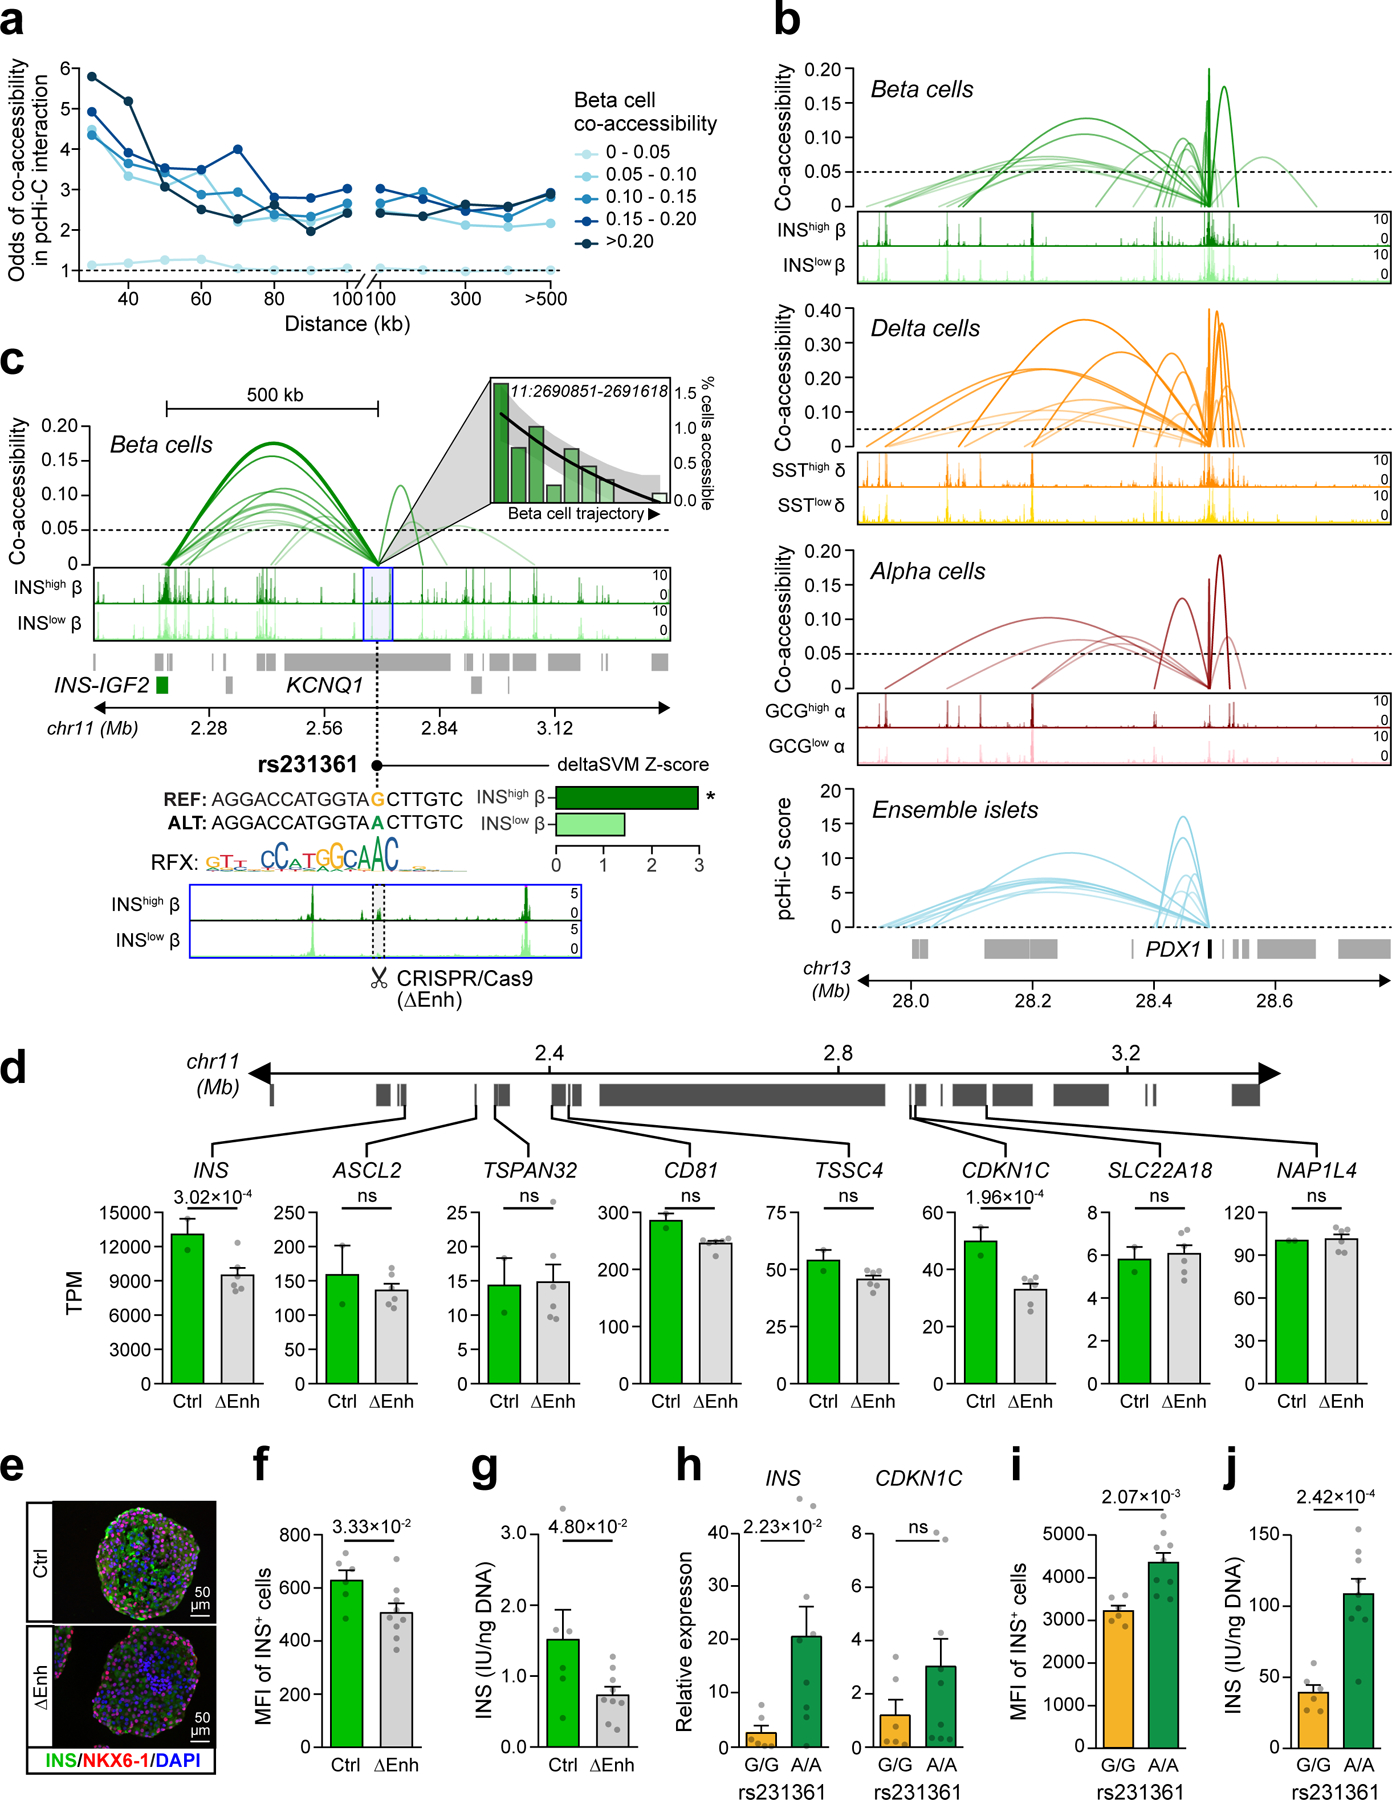
Single-nucleus assay for transposase-accessible chromatin using sequencing (snATAC-seq) creates new opportunities to dissect cell type-specific mechanisms of complex diseases. Since pancreatic islets are central to type 2 diabetes (T2D), we profiled 15,298 islet cells by using combinatorial barcoding snATAC-seq and identified 12 clusters, including multiple alpha, beta and delta cell states. We cataloged 228,873 accessible chromatin sites and identified transcription factors underlying lineage- and state-specific regulation. We observed state-specific enrichment of fasting glucose and T2D genome-wide association studies for beta cells and enrichment for other endocrine cell types. At T2D signals localized to islet-accessible chromatin, we prioritized variants with predicted regulatory function and co-accessibility with target genes. A causal T2D variant rs231361 at the KCNQ1 locus had predicted effects on a beta cell enhancer co-accessible with INS and genome editing in embryonic stem cell-derived beta cells affected INS levels. Together our findings demonstrate the power of single-cell epigenomics for interpreting complex disease genetics.


Conflict of interest statement

COMPETING INTERESTS STATEMENT

K.J.G. does consulting for Genentech and holds stock in Vertex Pharmaceuticals, neither of which is related to the work in this study. No other authors have competing interests to disclose.

Figures

Extended Data Fig. 1
Extended Data Fig. 1. Quality control metrics and aggregate comparison to bulk islet ATAC.
(a) Insert size distribution for aggregate reads from each snATAC-seq experiment. (b) Aggregated read coverage from each snATAC-seq experiment in a ±2 kb window around individual promoters (top) and averaged across all promoters (bottom). (c) Spearman correlation between normalized read coverage within a merged set of peaks from 3 aggregated islet snATAC-seq, 42 bulk islet ATAC-seq, and 4 bulk pancreas ATAC-seq datasets. Names of samples are from the original sources of the data. (d) Binned log10 read depth distribution for each experiment.
Extended Data Fig. 2
Extended Data Fig. 2. Flowchart of the snATAC-seq data processing pipeline
(a) Flowchart summarizing key steps of the snATAC-seq processing pipeline, including the various steps where cells were filtered out. Samples were first processed individually. All samples were then combined using a batch correction method. Clusters corresponding to cells from low quality cells, including those with low read depth in highly variable windows and low fraction of reads in peaks were then removed. After re-clustering, iterative subclustering of the main clusters at high resolution was used to identify and remove doublet subclusters. The final clusters are not driven by potential confounders such as donor of origin. Boxplot center lines, limits, and whiskers represent median, quartiles, and 1.5 IQR respectively.
Extended Data Fig. 3
Extended Data Fig. 3. Analysis of islet single cell gene expression data
(a) log10 transformed read depth or (b) total number of genes expressed compared with number of marker genes expressed per cell from scRNA-seq data. Boxplot center lines, limits, and whiskers represent median, quartiles, and 1.5 IQR respectively. Cells expressing more than one marker gene (defined by mixture models) were marked as doublets and filtered out. (c) Clusters of islet cells from single cell RNA-seq data plotted on UMAP coordinates. quies. stellate, quiescent stellate. activ. stellate, activated stellate. (d) Selected marker gene log2(expression) for each cluster plotted on UMAP coordinates. (e) Row-normalized t-statistics of marker gene specificity showing the most specific genes (t-statistic>20) for each cluster.
Extended Data Fig. 4
Extended Data Fig. 4. Comparison of motif enrichment between alpha and gamma cells
Differential enrichment of motifs between alpha cell open chromatin regions and gamma cell open chromatin regions as measured by a 2-sided T-test, with FDR calculated by the Benjamini-Hochberg procedure. Examples are highlighted of motifs enriched in alpha cells and gamma cells, respectively (MAFG, HOXA9). UMAP plots show enrichment z-scores for the indicated motifs in alpha and gamma cells. Violin plots below show the distribution of enrichment z-scores across alpha or gamma cells, where the lines represent median and quartiles.
Extended Data Fig. 5
Extended Data Fig. 5. Differentially accessible promoters across pseudo-states
(a) Pseudo-state (trajectory) values for alpha cells plotted on UMAP coordinates (left) and percentage of cells with GCG promoter accessibility decreases across 10 bins along the alpha (α) cell trajectory (right). (b) Pseudo-state (trajectory) values for beta (β) cells plotted on UMAP coordinates (left) and percentage of cells with INS promoter accessibility decreases across 10 bins along the beta cell trajectory (right). (c) Pseudo-state (trajectory) values for delta (δ) cells plotted on UMAP coordinates (left) and percentage of cells with SST promoter accessibility decreases across 10 bins along the beta cell trajectory (right). (d) Heatmaps showing promoters with dynamic accessibility across trajectories for alpha (top), beta (middle) and delta (bottom) cell trajectories. Gene promoters are clustered into 4 groups for each trajectory with k-medoids clustering. Enriched gene ontology for each k-medoid cluster (left) and selected genes present in at least one enriched gene ontology.
Extended Data Fig. 6
Extended Data Fig. 6. Single cell GWAS enrichment and correlation with TF motifs
(a) Single cell GWAS enrichment z-scores for Major depressive disorder and Systemic lupus erythematosus projected onto UMAP coordinates (left panels), z-score enrichment distribution per cell type and state (middle panels) and z-score enrichment distribution split into 10 bins based on beta cell trajectory values (right panels). Boxplot center lines, limits, and whiskers represent median, quartiles, and 1.5 IQR respectively. (b) Correlation between single cell GWAS enrichment z-scores for Type 2 Diabetes and chromVAR TF motif enrichment z-scores across either all cells (left) or beta cells (right). Inset scatterplots highlight the top correlated motifs in either direction. (c) Variants mapping directly in sequence motifs positively correlated with T2D risk in beta cells are enriched for T2D association, whereas variants mapping in motifs negatively correlated with T2D risk in beta cells show no such enrichment. Values represent effect size and SE.
Extended Data Fig. 7
Extended Data Fig. 7. Single cell co-accessibility analyses in islet cell types
(a) Distance-matched odds that delta cell co-accessibility links overlap islet pcHi-C chromatin loops at different co-accessibility threshold bins in 0.05 intervals demonstrate that co-accessible links are enriched for chromatin interactions. (b) Same analysis as in (a) but with alpha cell co-accessibility. (c) Same analysis as in (a) but with beta cell co-accessibility and Hi-C loops. (d) Same analysis as in (a) but with delta cell co-accessibility and Hi-C loops. (e) Same analysis as in (a) but with alpha cell co-accessibility and Hi-C loops. (f) Number of distal sites linked to each promoter peak for alpha, beta, and delta cells. (g) Number of promoters linked to each distal site for alpha, beta, and delta cells.
Extended Data Fig. 8
Extended Data Fig. 8. Cell type-specific and shared co-accessible sites
(a) An example of co-accessibility anchored at the promoter for the delta cell identity TF HHEX. Co-accessibility for beta, delta, and alpha cells are shown compared to high-confidence pcHi-C loops from ensemble islets. Genome browser plots scale: 0–10. (b) An example of co-accessibility anchored at the promoter for the alpha cell identity TF ARX. (c) An example of shared co-accessibility anchored at the promoter for the shared islet identity TF NEUROD1.
Extended Data Fig. 9
Extended Data Fig. 9. 3D chromatin interactions at the T2D-associated KCNQ1 locus
Top panels show Hi-C contact matrices from hESC-derived beta cells, visualized at 25 kb resolution. Region shown is chr11:500,00–4,500,000, hg19. Black arrows indicate putative interaction point of INS TSS and KCNQ1 enhancer. Genome browser plot below shows a zoomed view of chr11:1,750,000–3,250,000. Data from 4C-seq anchored on the INS promoter in EndoC-βH1 cells (Jian & Felsenfeld 2018) is shown, as analyzed with the 4C-ker package. Normalized read counts are shown in black from 3 biological replicates. Significant interactions from INS promoter are shown as arcs below read counts tracks. Interactions calls are from data pooled across 3 replicates are shown here. The region containing the KCNQ1 enhancer was called as a significant interaction region with INS promotor independently in each 4C replicate. Virtual 4C plots in green show log(normalized Hi-C interaction frequency) from INS promoter.
Extended Data Fig. 10
Extended Data Fig. 10. Genome editing of the KCNQ1 locus in hESCs
(a) Schematic of the workflow and (b) Sanger sequencing for KCNQ1 enhancer deletion in three independent hESC clones. (c) Representative figures of flow cytometry analysis for NKX6–1 and INS comparing control and KCNQ1ΔEnh cells (left). Quantification of the percentage of NKX6–1+/INS+ cells in beta cell stage cultures from control (n=6; 2 clones × 3 differentiations) and KCNQ1∆Enh (n=9; 3 clones × 3 differentiations) cells (right). Values represent mean and SEM. ns, not significant by two-sided Student’s T-test without adjustment for multiple comparisons. (d) Schematic of the workflow and (e) Sanger sequencing for two independent KCNQ1G/G clones and three KCNQ1A/A clones. (f) Representative figures of flow cytometry analysis for NKX6–1 and INS comparing KCNQ1G/G and KCNQ1A/A clones (left). of the percentage of NKX6–1+/INS+ cells in beta cell stage cultures from KCNQ1G/G (n=6; 2 clones × 3 differentiations) and KCNQ1A/A (n=9; 3 clones × 3 differentiations) cells (right). ns, not significant by two-sided Student’s T-test without adjustment for multiple comparisons. Values represent mean and SEM.
Figure 1.
Figure 1.. Pancreatic islet cell type accessible chromatin defined using snATAC-seq.
(a) Clustering of accessible chromatin profiles from 15,298 pancreatic islet cells identifies 12 distinct clusters plotted on UMAP coordinates. The number of cells for each cluster is listed in parenthesis next to the cluster label. (b) Promoter accessibility in a 1 kb window around the TSS for selected marker genes. (c) Aggregate read density (counts per 1×10⁵) at hormone marker genes: GCG (alpha), INS-IGF2 (beta), SST (delta), and PPY (gamma). (d) Spearman correlation between t-statistics of cluster-specific genes based on promoter accessibility (snATAC-seq) and gene expression (scRNA-seq). (e) Row-normalized chromVAR motif enrichment z-scores for 141 TF sequence motifs with variable enrichment across clusters (left). Cell types with multiple clusters are collapsed into a single cluster (e.g. beta 1 + beta 2 into beta). Enrichment z-scores for FOXA1 and PDX1 motifs for each cell projected onto UMAP coordinates (right). (f) Pearson correlation of TF motif enrichment z-scores between endocrine and exocrine cell types (g) FDR-corrected p-values from two-sided two sample T-tests of differential chromVAR motif enrichment comparison between delta and beta cells for 366 TF motifs. (h) Enrichment z-scores for SCRT1 and MAFB motifs in 7,598 beta and 710 delta cells projected onto UMAP coordinates (top) and shown as violin distributions (bottom; lines represent median and quartiles).
Figure 2.
Figure 2.. Heterogeneity in endocrine cell accessible chromatin and regulatory programs.
(a) Gene promoters with significantly differential chromatin accessibility between sub-clusters of alpha cells (left), beta cells (middle), and delta cells (right). (b) Enrichment of gene sets using ranked gene lists from the differential promoter analyses. Panels include genes with differential promoter accessibility between hormone-high or hormone-low states (first subpanel from left); genes expressed in beta cell sub-clusters from islet scRNA-seq (second and third subpanels); genes positively and negatively correlated with exocytosis from islet Patch-seq (fourth subpanel). (c) Enrichment of gene ontology terms related to glucose response, hormone secretion, stress response, and cell cycle among genes with differential promoter accessibility between endocrine cell states. (d) Row-normalized motif enrichments for 215 TF motifs with variable enrichment across endocrine cell states. Single cell motif enrichment z-scores for a representative RFX (RFX3) and FOS/JUN (FOS::JUN) motif are projected onto UMAP coordinates (right), and violin plots below show motif enrichment distribution within endocrine cell states (lines represent median and quartiles). (e) Ordering of alpha, beta and delta cells across pseudostate trajectories using high GCG/INS-IGF2/SST promoter accessibility as the reference point. Across each trajectory, the percentage of cells in the hormone-high state and the binary cluster call of individual cells are shown above the heatmaps, which show row-normalized motif enrichment for variable motifs between cell states. (f) Promoter accessibility for genes in the FOS/JUN motif family across pseudostate trajectories. Genes with matching promoter accessibility and motif enrichment patterns (ρ>0.5) are bolded.
Figure 3.
Figure 3.. Enrichment of islet accessible chromatin for diabetes and fasting glycemia.
(a) Stratified LD score regression enrichment z-scores for diabetes-related quantitative endophenotypes (top), type 1 and 2 diabetes (middle), and control traits (bottom) for islet cell types. **FDR<0.01 *FDR<0.1. (b) Single cell enrichment z-scores for fasting glucose level (FG) and T2D projected onto UMAP coordinates (left), enrichment per cell type (middle panels), and beta cell enrichment split into 10 trajectory bins (right). Boxplot center line, limits, and whiskers represent median, quartiles, and 1.5 interquartile range respectively. (c) Enrichment (estimate ± 95% CI by fgwas) of variants at loci associated with both T2D and FG (T2D/FG) within beta cell accessible chromatin. (d) Candidate causal T2D variant rs11708067 overlaps an enhancer active in INShigh beta cells at the ADCY5 locus, consistent with beta cell enrichment patterns for T2D/FG loci. (e) Enrichment (estimate ± 95% CI by fgwas) of variants at T2D loci in accessible chromatin for non-beta endocrine cells after removing beta accessible chromatin. (f) Candidate causal T2D variant rs1111875 overlaps a delta cell-specific site at the HHEX locus. (g) Correlation between single cell FG and TF motif enrichments across all 14.2k cells (left) and 7.2k beta cells (right). Across all cells, FG has positive correlations with beta-enriched TF families such as PDX, NKX6 and PAX. Within beta cells, FG has positive correlations with INShigh beta-enriched TF families such as RFX, MAF/NRL, and FOXA. (h) Enrichment (effect±SE) of FG-associated variants directly overlapping sequence motifs for those either positively or negatively correlated with FG in beta cells.
Figure 4.
Figure 4.. Genetic variants with islet cell type- and state-specific effects on chromatin accessibility.
(a) Percentage of HRC variants in any endocrine cell type peak (n=1,411,387 variants) that had significant deltaSVM effects (FDR<0.1) for the reference (ref.) or alternative (alt.) allele. (b) Spearman correlation between deltaSVM Z-score and chromatin accessibility allelic imbalance Z-scores for variants with predicted effects in alpha and beta states. (c) Relative luciferase reporter activity (mean ± 95% CI; n=3 replicates) for five T2D variants with predicted beta cell effects. The allele with predicted effect is circled. p-values by two-sided Student’s T-tests. (d) Enrichment of islet caQTLs for variants with predicted effects in alpha and beta cells (left) and stratified based on shared, cell type- and state-specific effects (right). p-values by two-sided Fisher’s exact test, ns, not significant. (e) Examples of variants with predicted effects in alpha and beta cells (left). TF motif families enriched in sequences surrounding the effect allele relative to the non-effect allele (middle). Promoter accessibility patterns for genes in enriched TF motif families (right). Genes with matching promoter accessibility and TF motif enrichment patterns are highlighted. (f) Enrichment (estimate ± 95% CI) of low frequency and rare variants with predicted effects on islet chromatin at different T2D association thresholds. p-values by two-sided binomial test. (g) Low-frequency T2D variant rs78840640 at the IGF2BP3 locus with high causal probability (PPA=0.33) has predicted effects in beta cells.
Figure 5.
Figure 5.. Chromatin co-accessibility links diabetes risk variants to target genes.
(a) Distance-matched odds that co-accessible sites in beta cells overlap islet pcHi-C interactions at different threshold bins. (b) Single cell co-accessibility and islet pcHi-C interactions at the PDX1 promoter. (c) Enhancer harboring T2D variant rs231361 shows distal beta cell co-accessibility to the INS promoter and other non-promoter sites. The enhancer is accessible in INShigh but not INSlow beta and has decreasing accessibility across the beta cell trajectory. rs231361 disrupts an RFX motif and has predicted effects in INShigh beta. *FDR<0.1. CRISPR/Cas9 deletion of a 2.6 kb region (highlighted, ∆Enh) around the enhancer. (d) Expression (transcripts per million, TPM±SEM) of genes within 2 Mb of the enhancer in beta cell stage cultures for ∆Enh (n=6; 3 clones × 2 differentiations) and control (n=2; 1 clone × 2 differentiations), p-values from DESeq2, ns not significant. (e) Representative immunofluorescence staining for INS (green), NKX6–1 (red), and DAPI (blue) in beta cell stage cultures for ∆Enh (n=3 independent experiments) and control (n=3 experiments) (f) Quantification of INS median fluorescence intensity (MFI) and (g) INS content in beta cell stage cultures for ∆Enh (n=9; 3 clones × 3 differentiations) and control (n=6; 2 clones × 3 differentiations). (h) Relative expression of INS and CDKN1C, (i) Quantification of INS MFI, and (j) INS content in beta cell stage cultures for KCNQ1A/A (n=9; 3 clones × 3 differentiations) and KCNQ1G/G (n=6; 2 clones × 3 differentiations). Data shown are mean±SEM, p-values by two-sided Student’s T-test, ns, not significant.

Similar articles

Cited by

References

    1. Maurano MT et al. Systematic Localization of Common Disease-Associated Variation in Regulatory DNA. Science 337, 1190–1195 (2012). - PMC - PubMed
    1. Cusanovich DA et al. Multiplex Single Cell Profiling of Chromatin Accessibility by Combinatorial Cellular Indexing. Science 348, 910–914 (2015). - PMC - PubMed
    1. Buenrostro JD et al. Single-cell chromatin accessibility reveals principles of regulatory variation. Nature 523, 486–490 (2015). - PMC - PubMed
    1. Preissl S et al. Single-nucleus analysis of accessible chromatin in developing mouse forebrain reveals cell-type-specific transcriptional regulation. Nat. Neurosci 21, 432–439 (2018). - PMC - PubMed
    1. Litzenburger UM et al. Single-cell epigenomic variability reveals functional cancer heterogeneity. Genome Biol 18, 15 (2017). - PMC - PubMed

Publication types

MeSH terms