. 2021 Apr;23(4):413-423.
doi: 10.1038/s41556-021-00637-6. Epub 2021 Apr 1.

Control of endothelial quiescence by FOXO-regulated metabolites

Affiliations

Control of endothelial quiescence by FOXO-regulated metabolites

Jorge Andrade et al. Nat Cell Biol. 2021 Apr.

Abstract

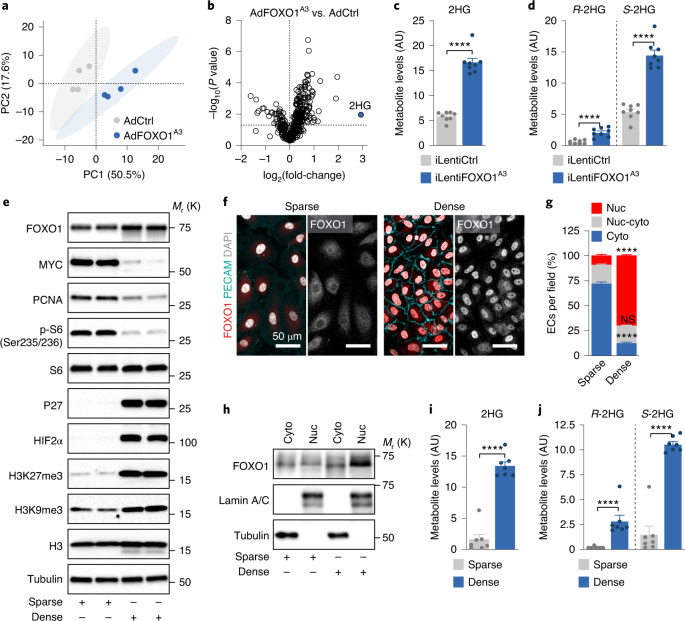
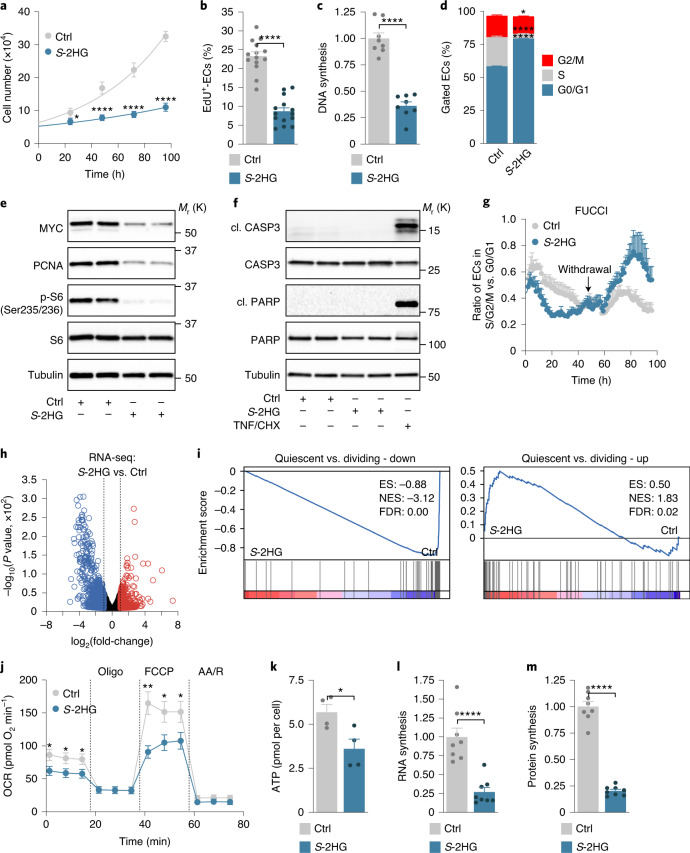
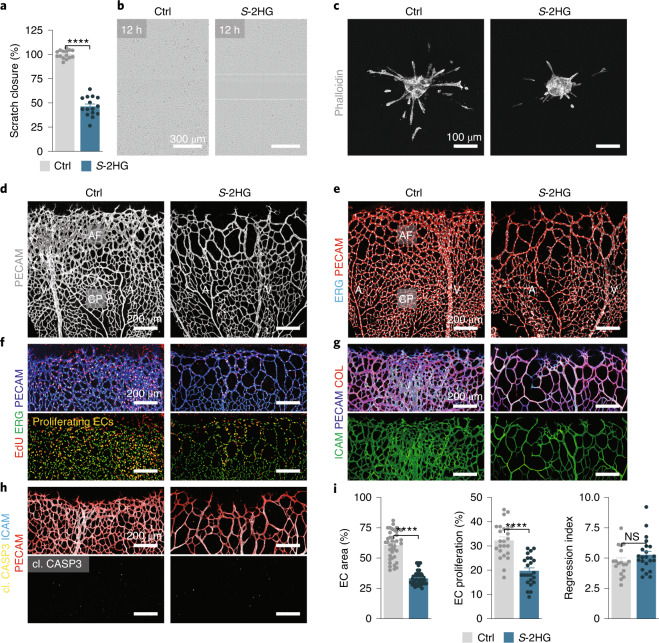
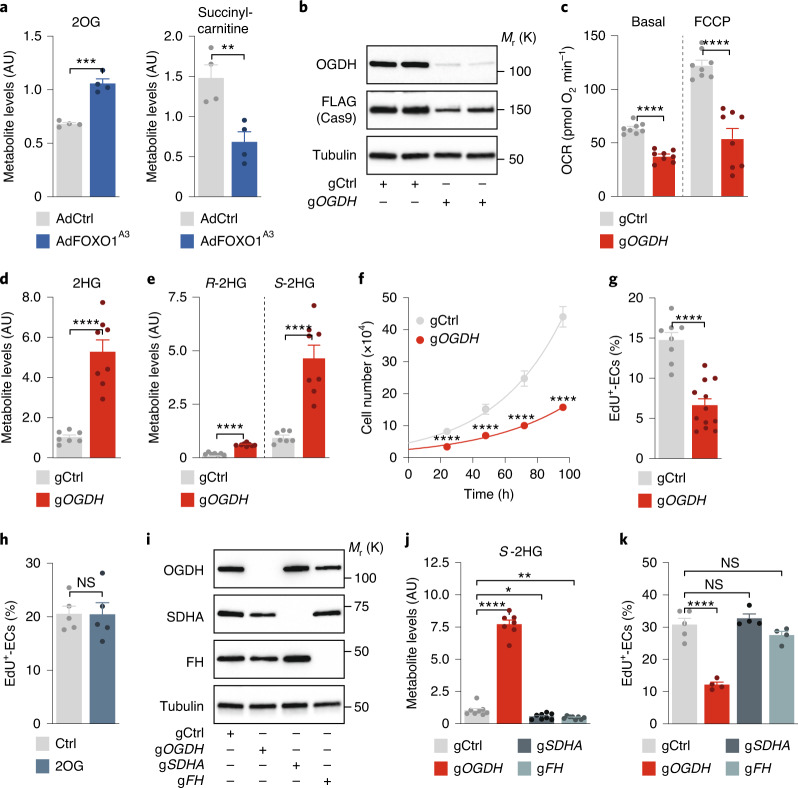
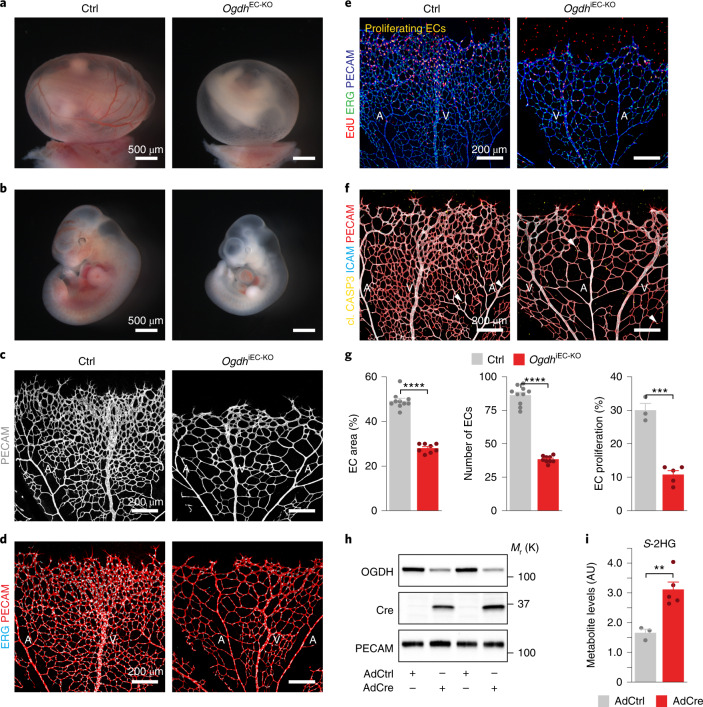
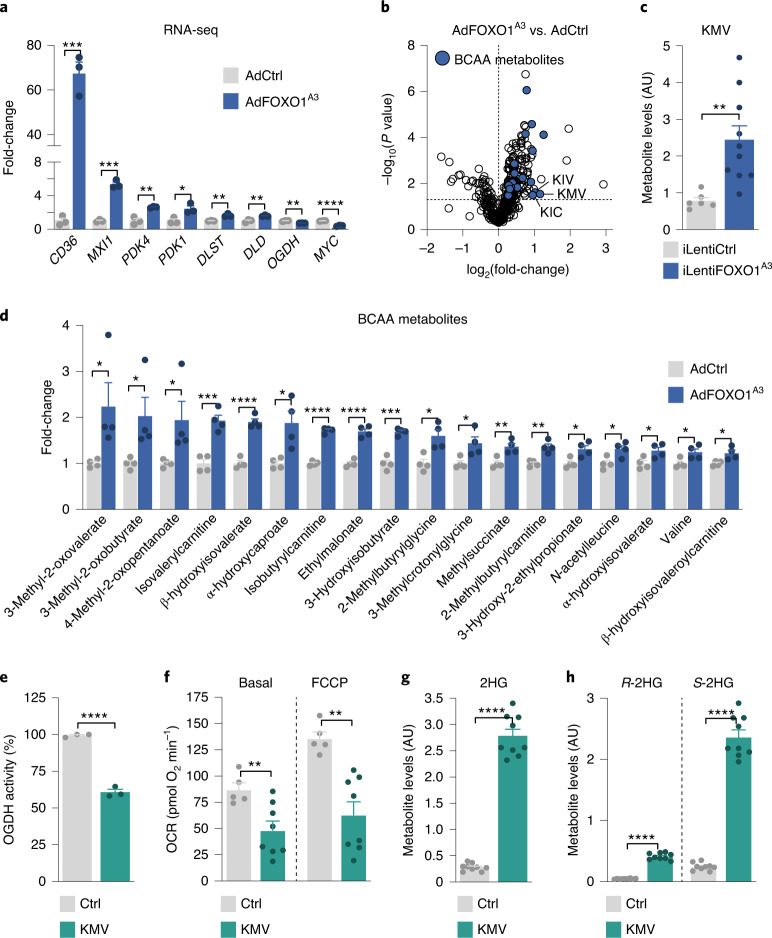
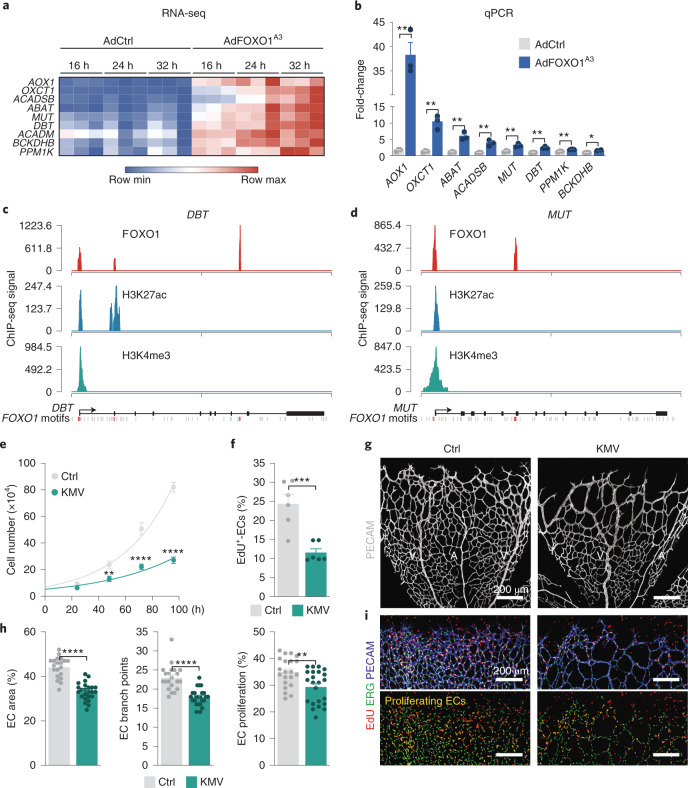
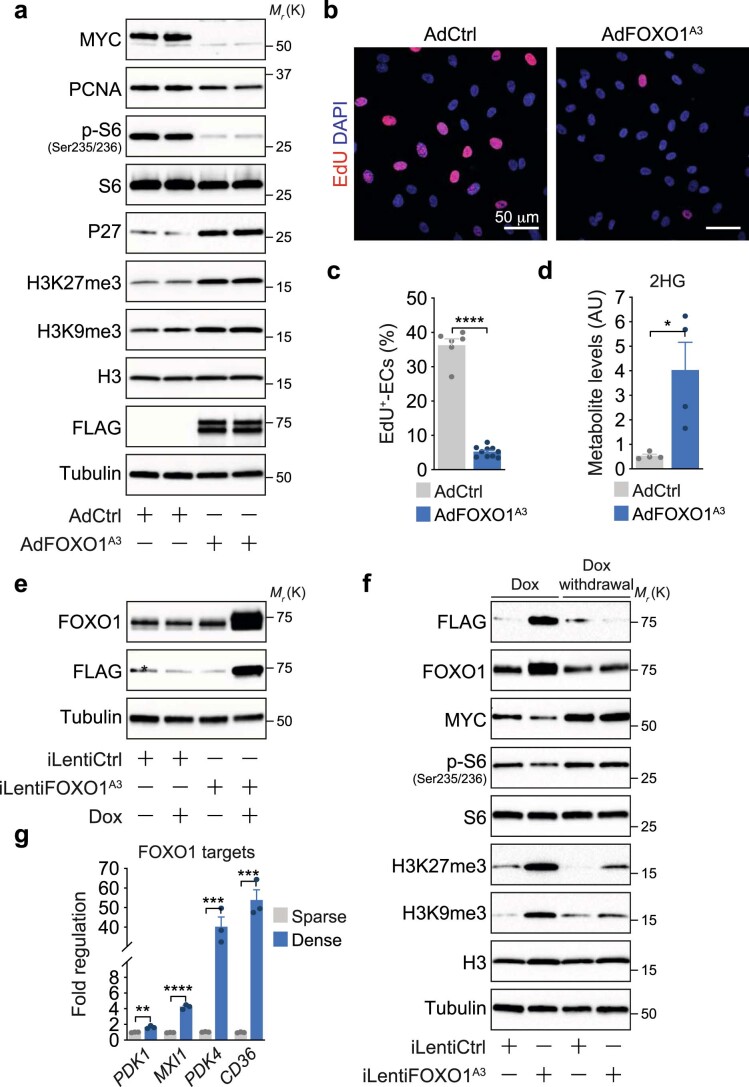
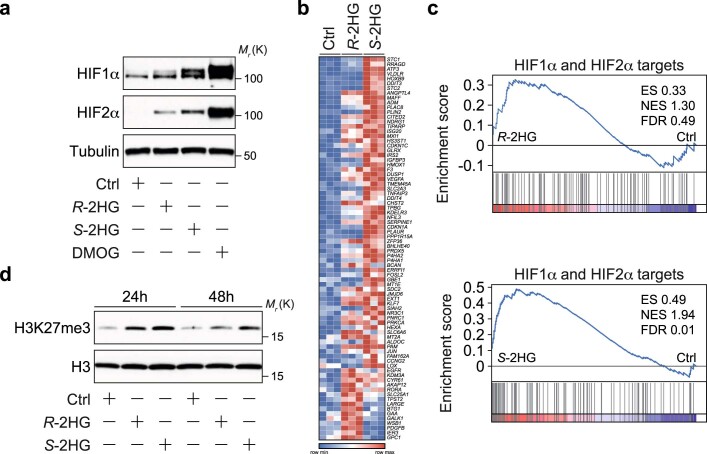
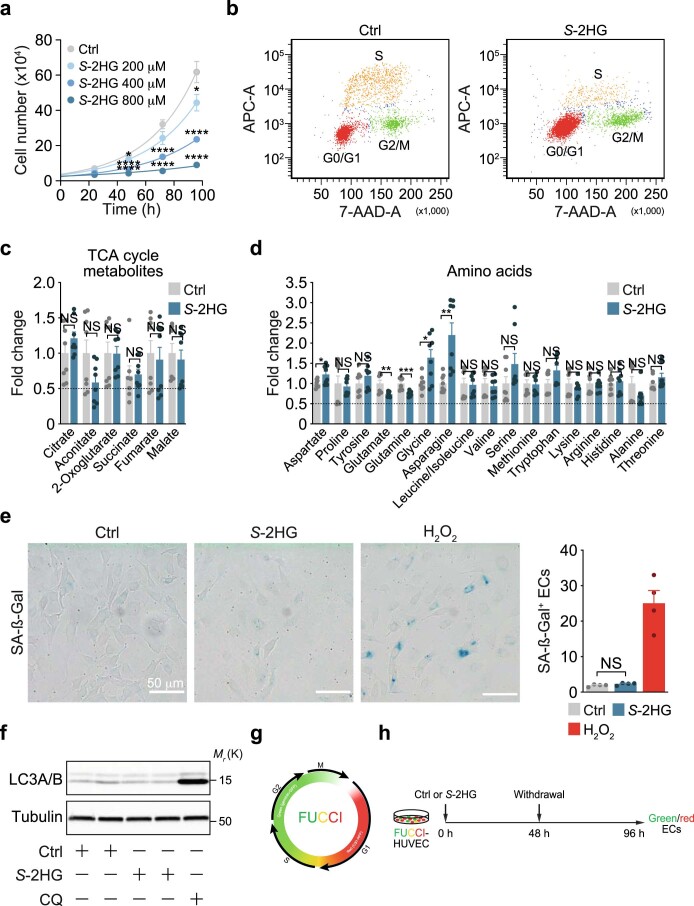
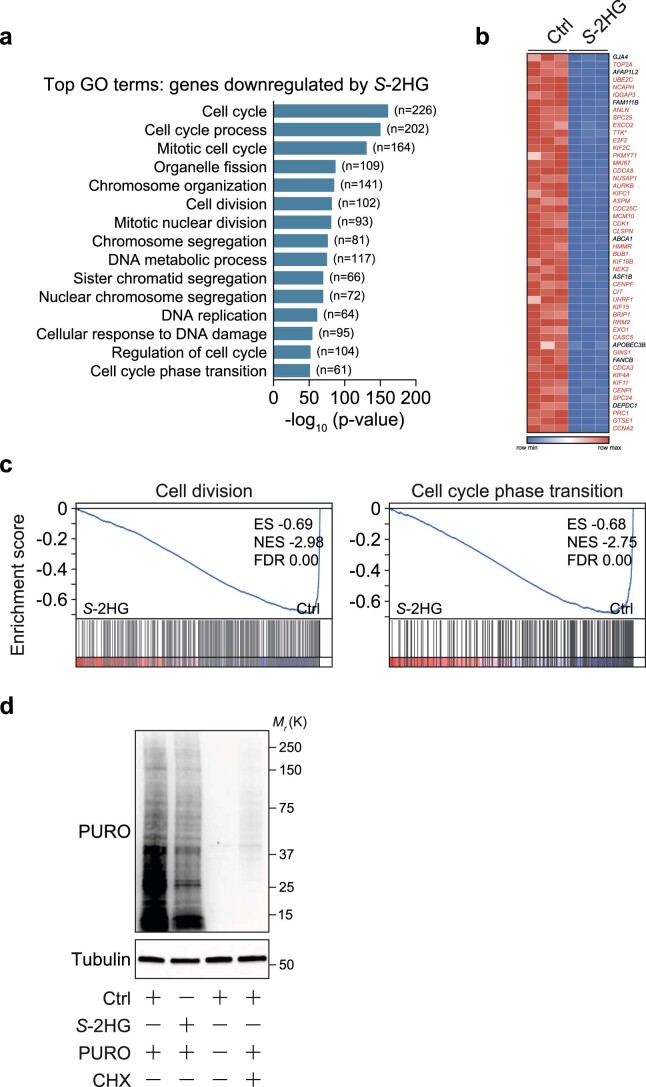
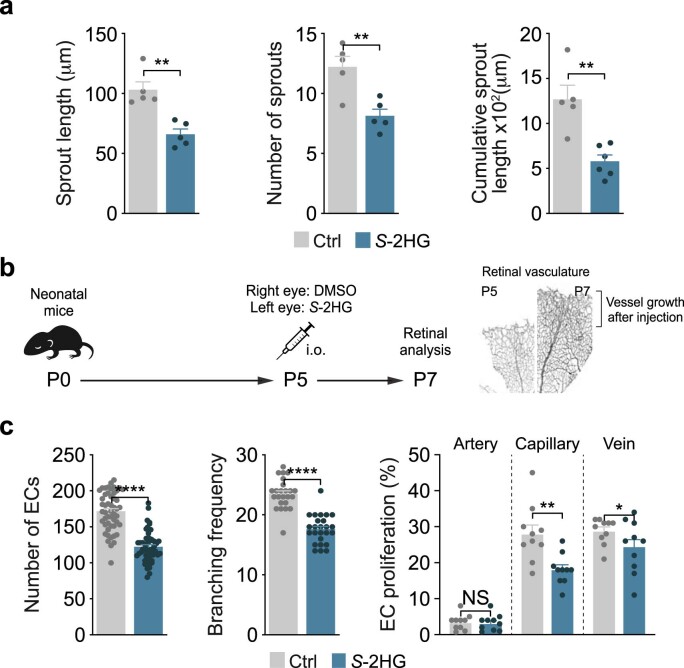
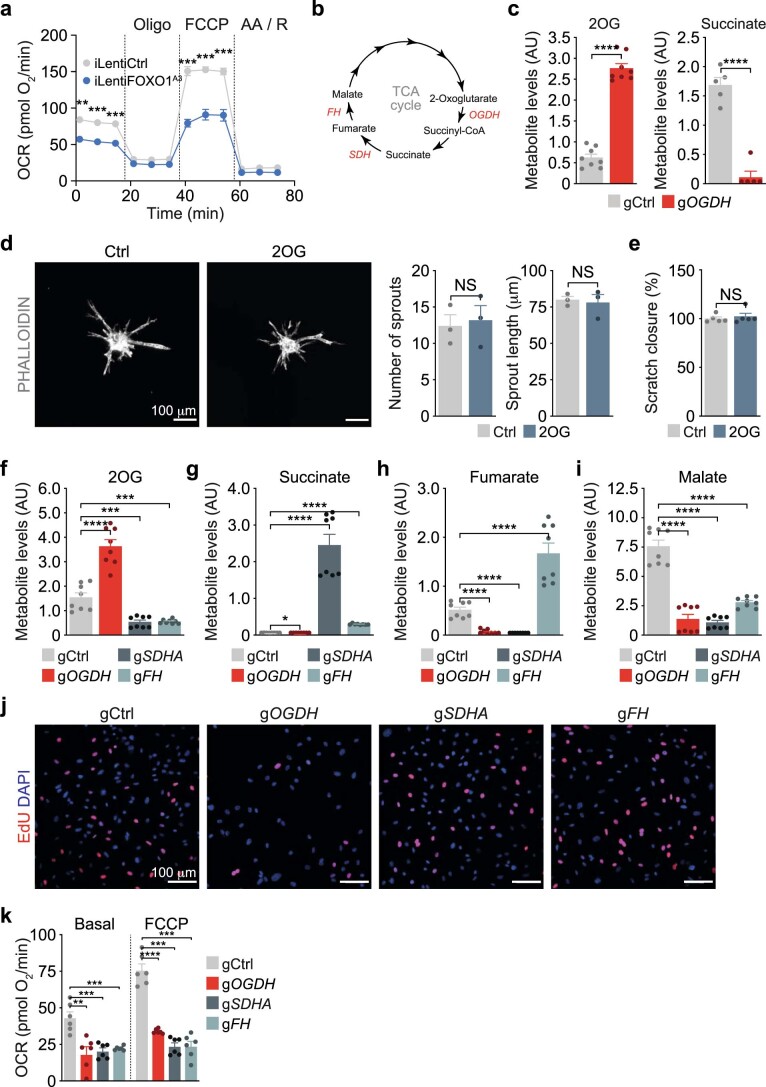
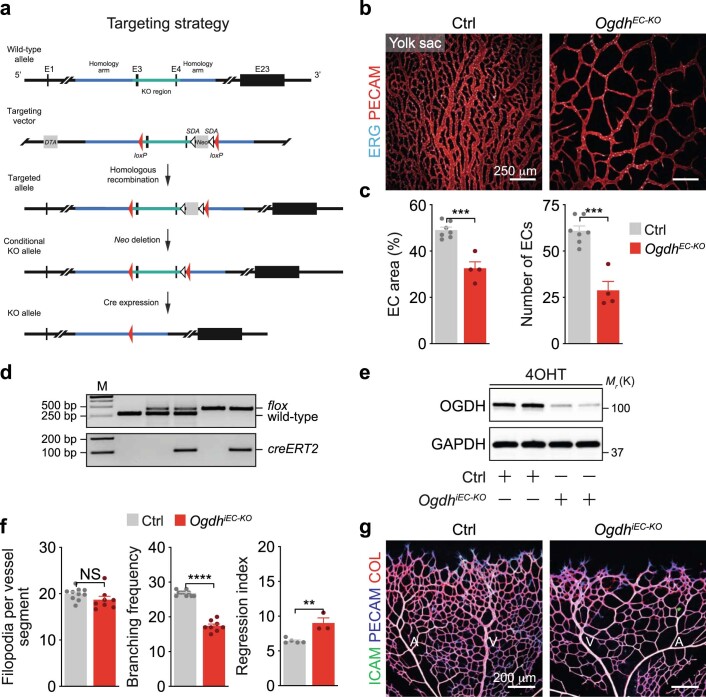
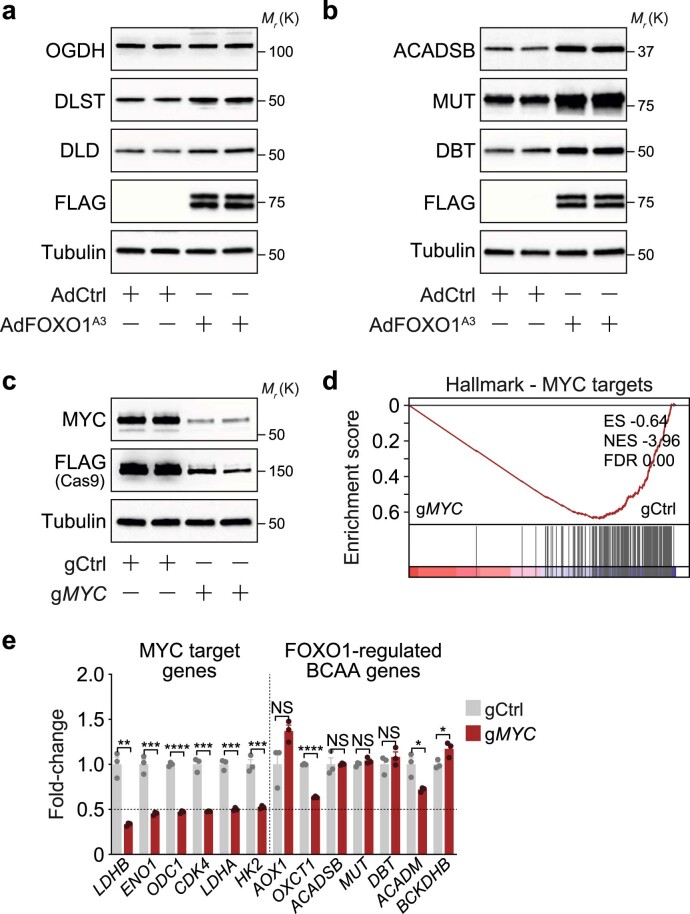
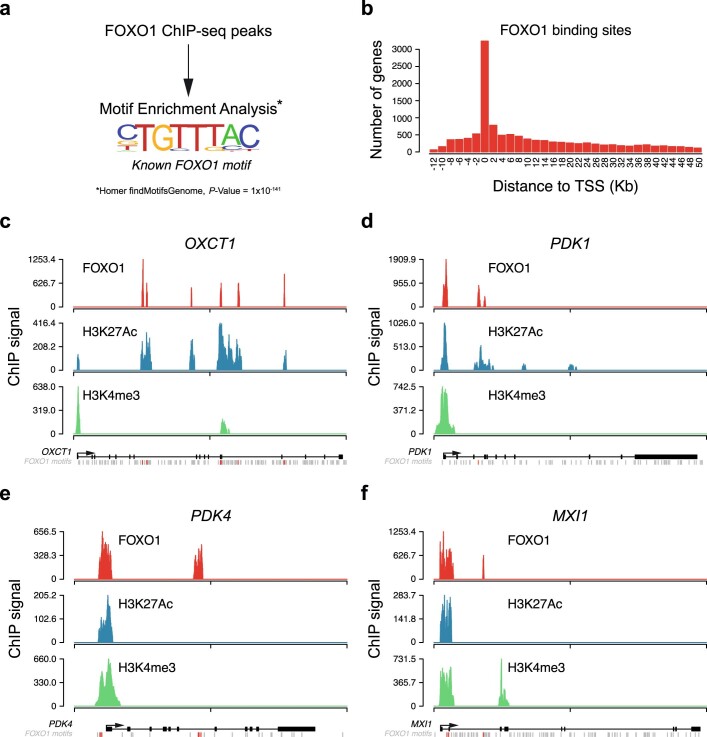
Endothelial cells (ECs) adapt their metabolism to enable the growth of new blood vessels, but little is known how ECs regulate metabolism to adopt a quiescent state. Here, we show that the metabolite S-2-hydroxyglutarate (S-2HG) plays a crucial role in the regulation of endothelial quiescence. We find that S-2HG is produced in ECs after activation of the transcription factor forkhead box O1 (FOXO1), where it limits cell cycle progression, metabolic activity and vascular expansion. FOXO1 stimulates S-2HG production by inhibiting the mitochondrial enzyme 2-oxoglutarate dehydrogenase. This inhibition relies on branched-chain amino acid catabolites such as 3-methyl-2-oxovalerate, which increase in ECs with activated FOXO1. Treatment of ECs with 3-methyl-2-oxovalerate elicits S-2HG production and suppresses proliferation, causing vascular rarefaction in mice. Our findings identify a metabolic programme that promotes the acquisition of a quiescent endothelial state and highlight the role of metabolites as signalling molecules in the endothelium.


Conflict of interest statement

The authors declare no competing interests.

Figures

Fig. 1
Fig. 1. Activation of FOXO1 signalling induces the generation of S-2HG in ECs.
a, PCA score plot showing distinct metabolic signatures in control (AdCtrl) and FOXO1A3-expressing (AdFOXO1A3) HUVECs (n = 4 independent samples). The percentage variance explained by each principal component (PC) is shown in parentheses. b, Volcano plot of metabolites showing 2HG as the most increased metabolite in FOXO1A3-expressing HUVECs. c, 2HG metabolite levels measured by LC–MS in HUVECs transduced with a doxycycline-inducible control-encoding (iLentiCtrl) or FOXO1A3-encoding (iLentiFOXO1A3) lentivirus (n = 8 independent samples). AU, arbitrary units. d, Chiral derivatization and enantioselective LC–MS measurement of R- and S-2HG levels in HUVECs transduced with iLentiCtrl or iLentiFOXO1A3 (n = 8 independent samples). e, Immunoblot analysis of HUVECs cultured in sparse and dense conditions. HUVECs in dense (contact-inhibited) conditions express markers linked to cellular quiescence. K, 1,000. f,g, Immunofluorescence analysis (f) and quantification (g) of the subcellular localization of FOXO1 (red) in HUVECs cultured in sparse and dense conditions. The isolated FOXO1 signal is shown on the right side of each image in grey (n = 14 (sparse condition) or 8 (dense condition) independent samples). DAPI (grey), nuclei; PECAM (cyan), intercellular endothelial junctions. Cyto, cytoplasmic; Nuc, nuclear; Nuc–cyto, nuclear–cytoplasmic. h, FOXO1 protein levels in cytoplasmic and nuclear fractions isolated from HUVECs cultured under sparse and dense conditions. Lamin A/C and tubulin were used as nuclear and cytoplasmic markers, respectively. i, 2HG metabolite levels in HUVECs cultured in sparse (FOXO1 inactive) and dense (FOXO1 active) culture conditions (n = 7 independent samples). j, Enantioselective LC–MS measurement of R- and S-2HG in sparse and dense HUVEC cultures (n = 7 independent samples). Western blot data in e and h are from the respective experiment, processed in parallel, and are representative of at least three independent experiments. For c, d, g, i and j, data represent the mean ± s.e.m.; two-tailed unpaired t-test, ****P < 0.0001, NS, not significant. The numerical data, unprocessed western blots and P values are provided as source data. Source data
Fig. 2
Fig. 2. S-2HG supports a quiescent endothelial phenotype.
a, Growth curves of HUVECs stimulated with DMSO (Ctrl) or cell-permeable S-2HG (n = 16 independent samples). b, EdU incorporation in control or S-2HG-treated HUVECs at 48 h. The percentage of EdU-positive ECs is shown (n = 14 independent samples). c, DNA synthesis is reduced in HUVECs treated with S-2HG for 48 h. Values represent the fold-change relative to DMSO-treated HUVECs (n = 8 independent samples). d, Cell-cycle analysis of control and S-2HG-stimulated HUVECs 48 h after treatment (n = 4 independent samples). e, Immunoblotting of proliferation and growth-associated proteins in HUVECs treated with S-2HG for 24 h. f, Immunoblot analysis of the apoptotic markers cleaved (cl.) caspase-3 (CASP3) and cleaved PARP showing that S-2HG does not cause cell death in HUVECs. TNFα (TNF) and cycloheximide (CHX) co-stimulation was used as a positive control. g, Time-course analysis of HUVECs transduced with the dual FUCCI reporter. ECs were treated with vehicle or S-2HG for 48 h, followed by withdrawal of the treatment and further analysis for 48 h (n = 3 independent samples). h, Volcano plot of differentially expressed genes in control or S-2HG-treated HUVECs at 24 h. Genes with a P value cut-off of ≤0.05 and a fold-change ≥ or ≤2 are shown (n = 3 independent samples). i, GSEA plots of quiescent versus dividing-down and quiescent versus dividing-up gene sets in the transcriptomes of control or S-2HG-treated HUVECs. ES, enrichment score; FDR, false discovery rate; NES, normalized enrichment score. j, OCRs in control or S-2HG-treated HUVECs (n = 9 independent samples). AA/R, antimycin A/rotenone; Oligo, oligomycin. k, ATP levels in HUVECs 48 h after treatment with vehicle or S-2HG (n = 4 independent samples). l, RNA synthesis is decreased, as measured by 14C-glucose incorporation into RNA, in HUVECs treated with S-2HG for 48 h. Values are represented as the fold-change relative to control (n = 8 independent samples). m, Protein synthesis is decreased, as measured by 3H-tyrosine incorporation into protein, in HUVECs treated with S-2HG for 48 h. Values are represented as the fold-change relative to control (n = 8 independent samples). Western blot data in e and f are from the respective experiment, processed in parallel, and are representative of at least three independent experiments. For ad, g and jm, the data represent the mean ± s.e.m.; two-tailed unpaired t-test, *P < 0.05, **P < 0.01, ****P < 0.0001. The numerical data, unprocessed western blots and P values are provided as source data. Source data
Fig. 3
Fig. 3. S-2HG restrains the angiogenic activity of ECs.
a,b, S-2HG reduces the motile behaviour of cultured HUVECs in a scratch-wound assay. Quantification (a) and representative bright-field images (b) from control and S-2HG-treated HUVECs (n = 15 independent samples). c, Confocal images of phalloidin-labelled (grey) HUVEC spheroids showing reduced endothelial sprouting in S-2HG treated spheroids. Images were taken 24 h after treatment. d, PECAM1 (PECAM) immunofluorescence staining (grey) in P7 mouse retinas showing decreased vascular density after a single intravitreal injection of cell-permeable S-2HG at P5. Controls were obtained by injection of DMSO (vehicle, Ctrl) in the contralateral eye. A, artery; AF, angiogenic front; CP, capillary plexus; V, vein. e, Confocal images of P7 retinas from control and S-2HG-injected mice stained for ERG (cyan) and PECAM (red). f, Immunofluorescence staining for EdU (red), ERG (green) and PECAM (blue) in P7 mouse retinas of control and S-2HG mice. Proliferating (EdU and ERG double-positive) ECs are shown in yellow. g, Confocal images of retinas from control and S-2HG-injected mice stained for ICAM2 (ICAM, green), PECAM (blue) and collagen IV (COL, red). h, Immunofluorescence images of cleaved caspase-3 (yellow), ICAM (cyan) and PECAM (red) of P7 retinas from control and S-2HG-injected mice, excluding excessive apoptotic cell death in S-2HG-treated mice. Note that most of the cleaved caspase-3 signals come from nonvascular (ICAM/PECAM-negative) cells. i, Quantification of angiogenic parameters in retinas of control and S-2HG-injected P7 mice, as indicated (EC area: n = 21 samples each for control and S-2HG; EC proliferation: n = 24 each samples for control and S-2HG; regression index: n = 18 and 22 samples for control and S-2HG, respectively). For a and i, the data represent the mean ± s.e.m.; two-tailed unpaired t-test, ****P < 0.0001. The numerical data and P values are provided as source data. Source data
Fig. 4
Fig. 4. OGDH inactivation induces S-2HG generation and limits endothelial proliferation.
a, Metabolite levels of 2OG and succinyl-carnitine (a surrogate for succinyl-CoA) in HUVECs transduced with control (AdCtrl) or FOXO1A3-encoding (AdFOXO1A3) adenoviruses (n = 4 independent samples). b, Immunoblot analysis of OGDH protein abundance in control and OGDH-depleted HUVECs. Cells were generated by lentiviral transduction of FLAG-tagged Cas9 nuclease and control (gCtrl) or OGDH-targeting (gOGDH) gRNAs. c, OCRs in gCtrl- and gOGDH-transduced HUVECs under basal conditions and in response to FCCP (n = 8 independent samples). d, 2HG metabolite levels in gCtrl and gOGDH HUVECs measured by LC–MS (n = 7 (gCtrl) and 8 (gOGDH) independent samples). e, Enantioselective LC–MS measurement of R- and S-2HG levels in gCtrl and gOGDH HUVECs (n = 7 (gCtrl) and 8 (gOGDH) independent samples). f, Cell-proliferation curves comparing gCtrl and gOGDH HUVECs (n = 12 independent samples). g, EdU incorporation in control and OGDH-deficient HUVECs. The percentage of EdU-positive ECs is shown (n = 8 (gCtrl) and 12 (gOGDH) independent samples). h, EdU incorporation in control and cell-permeable 2OG-treated HUVECs. The percentage of EdU-positive ECs is shown (n = 5 independent samples). i, Immunoblot analysis of OGDH, SDHA and FH protein levels in control (gCtrl) and CRISPR–Cas9-engineered HUVECs (gOGDH, gSDHA or gFH). j, LC–MS measurement of 2HG enantiomers showing that OGDH-deficient HUVECs (gOGDH), but not SDHA- or FH-deficient cells, have increased S-2HG levels (n = 8, 7, 8 and 8 independent samples for gCtrl, gOGDH, gSDHA and gFH, respectively). k, EdU incorporation in gCtrl, gOGDH, gSDHA and gFH HUVECs. The percentage of EdU-positive ECs is shown (n = 5, 4, 4 and 4 independent samples for gCtrl, gOGDH, gSDHA and gFH, respectively). Western blot data in b and i are from the respective experiment, processed in parallel, and are representative of at least three independent experiments. For a, c, dh, j and k, the data represent the mean ± s.e.m.; two-tailed unpaired t-test, *P < 0.05, **P < 0.01, ***P < 0.001, ****P < 0.0001, NS, not significant. The numerical data, unprocessed western blots and P values are provided as source data. Source data
Fig. 5
Fig. 5. Loss of endothelial OGDH restricts vascular growth.
a,b, Control (Ogdhfl/fl, Ctrl) and endothelial-restricted Ogdh (Tie2-cre;Ogdhfl/fl, OGDHEC-KO) mutant yolk sacs (a) and embryos (b) at embryonic day 11. 5 (E11.5) showing reduced vascularization of the yolk sac and retarded development of the Ogdh knockout embryos. c, Confocal images of PECAM-stained (grey) P6 retinas isolated from control (Ogdhfl/fl) and inducible endothelial-specific Ogdh mutant mice (Cdh5-creERT2;Ogdhfl/fl; OgdhiEC-KO) following 4-OHT injection from P1 to P4. d, Immunofluorescence staining for ERG (cyan) and PECAM (red) in control and OgdhiEC-KO mice. e, Labelling of EdU (red), ERG (green) and PECAM (blue) of control and OgdhiEC-KO retinas at P6, revealing a decreased number of proliferating ECs (yellow) in OgdhiEC-KO mutants. f, Confocal images of cleaved caspase-3 (yellow), ICAM (cyan) and PECAM (red) labelling in retinas from control and OgdhiEC-KO mice. White arrowheads indicate apoptotic ECs. g, Quantification of retinal angiogenesis at P6 in control and OgdhiEC-KO mice (EC area: n = 10 (control) and 8 (OgdhiEC-KO) samples; number of ECs: n = 10 (control) and 9 (OgdhiEC-KO) samples; EC proliferation: n = 3 (control) and 5 (OgdhiEC-KO) samples). h, OGDH protein expression in ECs isolated from the lungs of Ogdhfl/fl mice followed by transduction with control (AdCtrl) or Cre-encoding (AdCre) adenoviruses. i, S-2HG metabolite levels in AdCtrl and AdCre-transduced lung ECs derived from Ogdhfl/fl mice (n = 3 (AdCtrl) and 5 (AdCre) independent samples). Western blot data in h are from the respective experiment, processed in parallel, and are representative of at least three independent experiments. For g and i, the data represent the mean ± s.e.m.; two-tailed unpaired t-test, **P < 0.01, ***P < 0.001, ****P < 0.0001. The numerical data, unprocessed western blots and P values are provided as source data. Source data
Fig. 6
Fig. 6. FOXO1 induces S-2HG generation by regulating BCAA catabolism.
a, Expression of canonical FOXO1 targets and OGDH complex subunits in HUVECs transduced with a control-encoding (AdCtrl) and FOXO1A3-encoding (AdFOXO1A3) adenovirus. Cells were collected 24 h after transduction and analysed by RNA-seq (n = 3 independent samples). b, Volcano plot showing increased levels of BCAA catabolites in FOXO1A3-expressing HUVECs (n = 4 independent experiments). c, KMV metabolite levels in HUVECs transduced with a doxycycline-inducible control-encoding (iLentiCtrl) or FOXO1A3-encoding lentivirus (iLentiFOXO1A3) (n = 6 (iLentiCtrl) and 10 (iLentiFOXO1A3) independent samples). d, Changes in BCAA metabolites in AdCtrl versus AdFOXO1A3 expressing HUVECs. Data represent the fold-change relative to control (n = 4 independent samples). e, OGDH activity assay in control (PBS, Ctrl) or KMV-treated HUVECs (n = 3 independent experiments). f, Decreased basal and maximal (FCCP) OCRs in HUVECs treated with KMV for 48 h compared to control (n = 5 (control) or 8 (KMV) independent samples). g, 2HG metabolite levels in control and KMV-treated HUVECs measured by LC–MS (n = 9 independent samples). h, 2HG chiral derivatization and enantioselective MS measurement of R- and S-2HG levels in control or KMV-treated HUVECs (n = 9 independent samples). For ah, the data represent the mean ± s.e.m.; two-tailed unpaired t-test, *P < 0.05, **P < 0.01, ***P < 0.001, ****P < 0.0001. The numerical data and P values are provided as source data. Source data
Fig. 7
Fig. 7. The FOXO1-regulated BCAA catabolite KMV limits endothelial proliferation.
a, Heatmap of genes involved in BCAA metabolism that are induced in FOXO1A3-expressing (AdFOXO1A3) HUVECs compared to control (AdCtrl). Transcript levels were assessed at 16, 24 and 32 h post-transduction and analysed by RNA-seq. Genes with a fold-change ≥2 and a P value of <0.05 are shown (n = 3 independent samples). b, RT–qPCR analysis validating the increased expression of BCAA metabolism genes in AdFOXO1A3-transduced HUVECs. Values are normalized to β-actin levels and represented as fold-change relative to control (n = 3 independent samples). c,d, FOXO1, H3K27ac and H3K4me3 ChIP-seq signals at the genomic loci of the DBT (c) and MUT (d) gene. FOXO consensus motifs bound by FOXO1 are indicated in orange. Unbound FOXO motifs are shown in grey. ChIP-seq signals are represented as reads per kilobase million. e, Cell-proliferation curves of HUVECs treated with vehicle (PBS, Ctrl) or KMV for the indicated times (n = 12 independent samples). f, EdU incorporation is reduced in HUVECs treated with KMV for 48 h (n = 6 independent samples). g, Confocal images for PECAM (grey) labelling in P7 mouse retinas showing decreased vascular density after a single intraocular injection of KMV at P5. Mice injected with PBS were used as a control. h, Quantifications of vascular parameters in the retina of control and KMV-injected mice, as indicated (EC area: n = 20 (control) and 24 (KMV) samples; EC branch points: n = 21 (control) and 24 (KMV) samples; EC proliferation: n = 21 (control) and 23 (KMV) samples). i, EdU (red), ERG (green) and PECAM (blue) labelling of control and KMV-injected retinas at P7, revealing decreased endothelial proliferation following KMV treatment. For b, e, f and h, the data represent the mean ± s.e.m.; two-tailed unpaired t-test, *P < 0.05, **P < 0.01, ***P < 0.001, ****P < 0.0001. The numerical data and P values are provided as source data. Source data
Extended Data Fig. 1
Extended Data Fig. 1. Foxo1 promotes a quiescent endothelial phenotype.
a, Immunoblot analysis of quiescence-associated protein markers in HUVECs transduced with a FOXO1A3 (AdFOXO1A3) or control (AdCtrl) adenovirus. A FLAG antibody was used to validate the expression of the FLAG-tagged FOXO1A3 mutant. Tubulin served as loading control. b, Confocal images showing decreased EdU-incorporation in HUVECs transduced with AdFOXO1A3. The analysis was performed 24h after transduction. DAPI was used to identify endothelial nuclei. c, Quantification of EdU-incorporation in AdCtrl and FOXO1A3-expressing HUVECs. Values represent the percentage of EdU-labelled ECs, (n=6, 10 independent samples for AdCtrl and AdFOXO1A3). d, 2HG levels in AdCtrl- and AdFOXO1A3-transduced HUVECs measured by LC-MS, (n=4 independent samples). AU, arbitrary units. e, Immunoblot analysis of HUVECs transduced with a doxycycline-inducible control- (iLentiCtrl) or FOXO1A3-encoding lentivirus (iLentiFOXO1A3) showing expression of the FLAG-tagged FOXO1A3 mutant after doxycycline (Dox) treatment for 48h. The asterisk (*) denotes an unspecific protein detected by the FLAG antibody. f, Immunoblot analysis showing that the FOXO1-induced quiescence signature is reversible. HUVECs transduced with iLentiCtrl or iLentiFOXO1A3 were treated with Dox for 48h, after which Dox was removed from the culture media. HUVECs were then cultured for additional 48h. g, Quantitative RT-PCR (RT-qPCR) showing increased expression of canonical FOXO1 target genes in dense or sparse HUVEC cultures. Values are normalized to β-actin and represent fold-change regulation relative to control, (n=3 independent samples). Western blot data in a, e and f were from the respective experiment, processed in parallel, and are representative of at least three independent experiments. c, d and g, Data represent mean ± s.e.m.; a two-tailed unpaired t-test was used; *P<0.05; **P<0.01; ***P<0.001; ****P<0.0001. The numerical data, unprocessed western blots and P values are provided as source data. Source data
Extended Data Fig. 2
Extended Data Fig. 2. R- and S-2HG reduce the activity of 2-oxoglutarate-dependent dioxygenases in ECs.
a, Immunoblot analysis of HIF1α and HIF2α protein abundance in HUVECs stimulated with cell-permeable R- or S-2HG for 24h. HUVECs treated with vehicle (DMSO) were used as a control (Ctrl). The PHD inhibitor DMOG, which stabilizes HIF protein levels, was used as a positive control. b, Heatmap of hypoxia associated genes that are differentially regulated in control (Ctrl) versus R-2HG or S-2HG-treated HUVECs. DMSO was used as a vehicle control. Cells were stimulated for 24h before total mRNA was collected for RNA-seq analysis, (n=3 independent samples). c, Gene set enrichment analysis (GSEA) showing a HIF gene expression signature in HUVECs treated with R- and S-2HG for 24h when compared to Ctrl. ES, enrichment score; NES, normalized enrichment score; FDR, false discovery rate. d, Immunoblot analysis showing increased histone H3 lysine 27 tri-methylation (K27me3) levels in HUVECs treated with R-2HG or S-2HG when compared to Ctrl. Cells were analysed 24 or 48h after stimulation. Total levels of histone H3 are shown as protein loading control. Western blot data in a and d were from the respective experiment, processed in parallel, and are representative of at least three independent experiments. Unprocessed western blots are provided as source data. Source data
Extended Data Fig. 3
Extended Data Fig. 3. S-2HG is a cell cycle-arresting metabolite.
a, Proliferation curves comparing HUVECs treated with DMSO (Ctrl) or cell-permeable S-2HG, showing a dose-dependent reduction in S-2HG-stimulated HUVECs at the indicated concentrations and time points, (n=10 independent samples). b, Representative flow cytometry density plots showing the cell cycle phase distribution in HUVECs treated with vehicle (Ctrl) or S-2HG for 48 hours. c, Relative abundance of TCA cycle metabolites in Ctrl and S-2HG-treated HUVECs. LC-MS measurements were performed 48h after stimulation, (n=8 independent samples). d, Relative abundance of amino acids in Ctrl and S-2HG-treated HUVECs. LC-MS measurements were performed 48h after stimulation, (n=8 independent samples). e, Representative images and quantification of senescence-associated β-galactosidase (SA-β-Gal) staining showing that S-2HG does not induce cellular senescence. HUVECs were stimulated with DMSO (Ctrl) or S-2HG for 48h. Hydrogen peroxide (H2O2) stimulated cells were used as a positive control, (n=4 independent samples). f, LC3A/B immunoblot analysis showing that S-2HG treatment for 48h does not induce autophagy in ECs. Chloroquine (CQ) treated HUVECs were used as a positive control. g, Visualization of cell cycle progression using the dual fluorescence ubiquitination-based cell cycle indicator (FUCCI) reporter. Cells with red-labelled nuclei (expressing mCherry-hCdt1(30/120)) are in G0/G1 while cells with green labelled nuclei (expressing mVenus-hGeminin(1/110)) are in the S/G2/M cell cycle phase. Yellow nuclei indicate temporal co-expression of both reporters. h, Experimental timeline for the cell cycle analysis in HUVECs transduced with the FUCCI reporter. The ratio between green and red cells indicates the percentage of ECs in S/G2/M compared to G0/G1, respectively. Western blot data in f were from the respective experiment, processed in parallel, and are representative of at least three independent experiments. a and c-e, Data represent mean ± s.e.m.; a two-tailed unpaired t-test was used; *P<0.05; ** P<0.01; ***P<0.001; **** P<0.0001; NS, not significant. The numerical data, unprocessed western blots and P values are provided as source data. Source data
Extended Data Fig. 4
Extended Data Fig. 4. S-2HG promotes a quiescent state in ECs.
a, Gene ontology (GO) analysis showing top GO terms of genes that are downregulated in S-2HG-treated HUVECs as determined by RNA-seq analysis at 24h post treatment. DMSO-treated HUVECs were used as a control (Ctrl), (n=3 independent samples). b, Heatmap showing the top down-regulated genes in the transcriptome of HUVECs treated with S-2HG for 24h. Transcripts highlighted in red are cell-cycle and proliferation related genes. c, GSEA plots of cell division and cell cycle phase transition gene sets in the transcriptomes of HUVECs treated with S-2HG or solvent (Ctrl) for 24h. ES, enrichment score; NES, normalized enrichment score; FDR, false discovery rate. d, S-2HG decreases endothelial protein synthesis. Immunoblot analyses showing reduced incorporation of puromycin (PURO) into nascent polypeptide chains in whole-cell lysates of HUVECs treated with S-2HG or solvent (Ctrl) for 48h. Cycloheximide (CHX) stimulation was used as a positive control to block protein synthesis. Western blot data were from the respective experiment, processed in parallel, and are representative of at least three independent experiments. Unprocessed western blots are provided as source data. Source data
Extended Data Fig. 5
Extended Data Fig. 5. S-2HG limits the angiogenic capacity of ECs.
a, Quantifications of vascular parameters showing reduced endothelial sprouting capacity in S-2HG treated HUVEC spheroids, (n=5 independent samples). b, Experimental timeline for the retinal analysis after intraocular injection of a single dose of vehicle (DMSO, Ctrl) or S-2HG. The images of PECAM-labelled retinas on the right illustrate the extent of angiogenic growth between P5 and P7 in wild-type mice. c, Quantifications of vascular parameters in P7 Ctrl and S-2HG injected mouse retinas as indicated, (Number ECs: n=56, 51 samples for Ctrl and S-2HG; Branching frequency: n=24, 25 samples for Ctrl and S-2HG; EC proliferation for Artery, Capillary and Vein: n=10, 10 samples for Ctrl and S-2HG). a and c, Data represent mean ± s.e.m.; a two-tailed unpaired t-test was used; *P<0.05; ** P<0.01; **** P<0.0001; NS, not significant. The numerical data and P values are provided as source data. Source data
Extended Data Fig. 6
Extended Data Fig. 6. Changes in endothelial mitochondrial metabolism upon FOXO1A3 expression or OGDH depletion.
a, Oxygen consumption rate (OCR) in control (iLentiCtrl) and FOXO1A3-transduced (iLentiFOXO1A3) HUVECs 48h after doxycycline induction. Oligo, oligomycin; FCCP, fluoro-carbonyl cyanide phenylhydrazone; AA / R, Antimycin A / Rotenone, (n=4 independent samples). b, Schematic representation showing the metabolic substrates and products catalysed by the TCA cycle enzymes OGDH, SDH and FH. c, Metabolite levels of 2-oxoglutarate (2OG) and succinate in control (gCtrl) and OGDH-depleted (gOGDH) HUVECs, (2OG: n=8, 8 independent samples for gCtrl and gOGDH; Succinate: n=5, 5 for gCtrl and gOGDH). AU, arbitrary units. d, Confocal images of phalloidin- (grey) labelled HUVEC spheroids showing that 2OG does not affect endothelial sprouting. Images were taken 24h after treatment. Quantifications are shown on the right, (n=3 independent samples). e, Scratch-wound assay quantification of vehicle (Ctrl) and 2OG-treated HUVECs, (n=5 independent samples). f-i, TCA cycle metabolite levels in control (gCtrl), SDHA- (gSDHA), OGDH- (gOGDH) and FH-depleted (gFH) HUVECs, (n=8 independent samples). AU, arbitrary units. j, EdU-incorporation in gCtrl, gSDHA, gOGDH and gFH transduced HUVECs. DAPI was used to identify endothelial nuclei. k, Oxygen consumption rate (OCR) in gCtrl, gOGDH, gSDHA and gFH depleted HUVECs. Measurements were performed under basal conditions and in response to FCCP stimulation, (n=6 independent samples). a, c-i and k, Data represent mean ± s.e.m.; a two-tailed unpaired t-test was used; ** P<0.01; ***P<0.001; **** P<0.0001; NS, not significant. The numerical data and P values are provided as source data. Source data
Extended Data Fig. 7
Extended Data Fig. 7. Loss of endothelial Ogdh impairs vascular growth.
a, Schematic illustration of the strategy to generate a conditional Ogdh knockout allele, in which exons 3 and 4 are flanked by loxP sites (red triangles). The Ogdh genomic locus, the targeting vector, the targeted allele and the SDA- and cre-recombined loci are shown. SDA-Neo-SDA, neomycin resistance cassette flanked by SDA sites. b, Immunofluorescence staining for ERG (cyan) and PECAM1 (PECAM, red) of control (Ctrl, Ogdhfl/fl) and endothelial-restricted Ogdh knockout (OgdhEC-KO, Tie2-cre;Ogdhfl/fl) yolk sacs at E11.5, showing reduced vascular density after Ogdh loss. c, Quantifications of vascular parameters in E11.5 Ctrl and OgdhEC-KO yolk sacs, as indicated, (EC area: n=7, 4 samples for Ctrl and OgdhEC-KO; Number of ECs: n=7, 4 samples for Ctrl and OgdhEC-KO). d, PCR analysis of genomic DNA from control (Ogdh+/+, lane 2; Ogdhfl/+, lane 3; Ogdhfl/fl, lane5) and conditional Ogdh mutant mice (Cdh5-creERT2; Ogdhfl/+, lane4; Cdh5-creERT2;Ogdhfl/fl, lane 6). Lane 1, DNA marker (M). e, Immunoblot analysis of OGDH protein levels in ECs isolated from the liver of 4-OHT-injected Ctrl (Ogdhfl/fl) and OgdhiEC-KO (Cdh5-creERT2;Ogdhfl/fl) mouse mutants. GAPDH served as loading control. f, Quantifications of vascular parameters in P6 Ctrl and OgdhiEC-KO mouse mutants, as indicated (Filopodia per vessel segment: n=10, 8 samples for Ctrl and OgdhiEC-KO; Branching frequency: n=10, 8 samples for Ctrl and OgdhiEC-KO; Regression index: n=5, 3 samples for Ctrl and OgdhiEC-KO). g, Immunostaining showing ICAM2- (ICAM, green), PECAM- (blue), and collagen IV- (COL, red) labelling of P6 retinas from 4-OHT-injected Ctrl and OgdhiEC-KO mice. Western blot data in e were from the respective experiment, processed in parallel, and are representative of at least three independent experiments. c and f, Data represent mean ± s.e.m.; a two-tailed unpaired t-test was used; ** P< 0.01; ***P<0.001; ****P<0.0001; NS, not significant. The numerical data, unprocessed western blots and P values are provided as source data. Source data
Extended Data Fig. 8
Extended Data Fig. 8. FOXO1 regulates genes involved in BCAA catabolism independent of its suppressive effect on MYC signalling.
a, Immunoblot analysis in AdCtrl and AdFOXO1A3-transduced HUVECs showing the protein expression of the OGDH complex subunits. A FLAG antibody was used to validate the expression of the FLAG-tagged FOXO1A3 mutant. Tubulin served as loading control. b, Immunoblot analysis of the BCAA metabolism enzymes ACADSB, MUT and DBT in AdCtrl and AdFOXO1A3 transduced HUVECs. c, Immunoblot analysis of MYC protein levels in control and MYC-depleted HUVECs (gMYC). Cells were generated by lentiviral transduction with FLAG-tagged Cas9, control (gCtrl) or MYC (gMYC) targeting gRNAs. d, Gene set enrichment analysis (GSEA) showing a suppression of MYC-regulated genes in gMYC HUVECs when compared to controls (gCtrl). ES, enrichment score; NES, normalized enrichment score; FDR, false discovery rate. e, Expression of canonical MYC target genes and FOXO1-regulated BCAA genes in gCtrl and gMYC HUVECs. Analysis was performed by RNA-seq, (n=3 independent samples). Western blot data in a-c were from the respective experiment, processed in parallel, and are representative of at least three independent experiments. Data in e represent mean ± s.e.m.; a two-tailed unpaired t-test was used unless otherwise indicated; *P<0.05; **P< 0.01; ***P<0.001; ****P<0.0001; NS, not significant. The numerical data, unprocessed western blots and P values are provided as source data. Source data
Extended Data Fig. 9
Extended Data Fig. 9. Identification of FOXO1 target genes by ChIP-seq.
a, Genome-wide analysis of FOXO1 binding peaks revealed the FOXO1 high-affinity binding sequence as the most enriched motif in the immunoprecipitated chromatin of FOXO1A3-transduced HUVECs. b, Distribution of FOXO1 bindings peaks relative to the transcriptional start site (TSS), showing preferential binding of FOXO1 to genomic regions located at gene promoters near the TSS. c-f, ChIP-seq signals for FOXO1, H3K27Ac and H3K4me3 at the genomic loci of (c) OXCT1, (d) PDK1, (e) PDK4 and (f) MXI1. The FOXO consensus motifs that are bound by FOXO1 are highlighted in orange. ChIP-seq signals are represented as reads per kilobase million (RPKMs).
Extended Data Fig. 10
Extended Data Fig. 10. Genetic PHD inactivation lowers the proliferative activity of ECs.
a, Immunoblot analysis of PHD1/2/3-depleted HUVECs showing regulation of HIF targets and proliferation-associated proteins. Cells were generated by lentiviral transduction with FLAG-tagged Cas9, control- (gCtrl) or PHD1/2/3-targeting gRNAs (gPHD1/2/3). b, EdU-incorporation in PHD1/2/3-depleted HUVECs. DAPI was used to identify ECs nuclei. c, Quantification of EdU-incorporation in gCtrl and gPHD1/2/3-transduced HUVECs. Values represent the percentage of EdU-labelled ECs, (n=20, 24 independent samples for gCtrl and gPHD1/2/3). d, Reduced DNA synthesis in PHD1/2/3-depleted ECs, as assessed by analysing 3H-thymidine incorporation. Values are represented as fold-change relative to control, (n=6 independent samples). Western blot data in a were from the respective experiment, processed in parallel, and are representative of at least three independent experiments. c and d represent mean ± s.e.m.; a two-tailed unpaired t-test was used; **P< 0.01; ****P<0.0001. The numerical data, unprocessed western blots and P values are provided as source data. Source data

Comment in

Similar articles

Cited by

References

    1. Augustin HG, Koh GY. Organotypic vasculature: from descriptive heterogeneity to functional pathophysiology. Science. 2017;357:eaal2379. - PubMed
    1. Potente M, Makinen T. Vascular heterogeneity and specialization in development and disease. Nat. Rev. Mol. Cell Biol. 2017;18:477–494. - PubMed
    1. Paik JH, et al. FoxOs are lineage-restricted redundant tumor suppressors and regulate endothelial cell homeostasis. Cell. 2007;128:309–323. - PMC - PubMed
    1. Wilhelm K, et al. FOXO1 couples metabolic activity and growth state in the vascular endothelium. Nature. 2016;529:216–220. - PMC - PubMed
    1. Salih DA, Brunet A. FoxO transcription factors in the maintenance of cellular homeostasis during aging. Curr. Opin. Cell Biol. 2008;20:126–136. - PMC - PubMed

Publication types

MeSH terms