. 2021 Apr;23(4):341-354.
doi: 10.1038/s41556-021-00653-6. Epub 2021 Apr 1.

A PRC2-independent function for EZH2 in regulating rRNA 2'-O methylation and IRES-dependent translation

Affiliations

A PRC2-independent function for EZH2 in regulating rRNA 2'-O methylation and IRES-dependent translation

Yang Yi et al. Nat Cell Biol. 2021 Apr.

Abstract

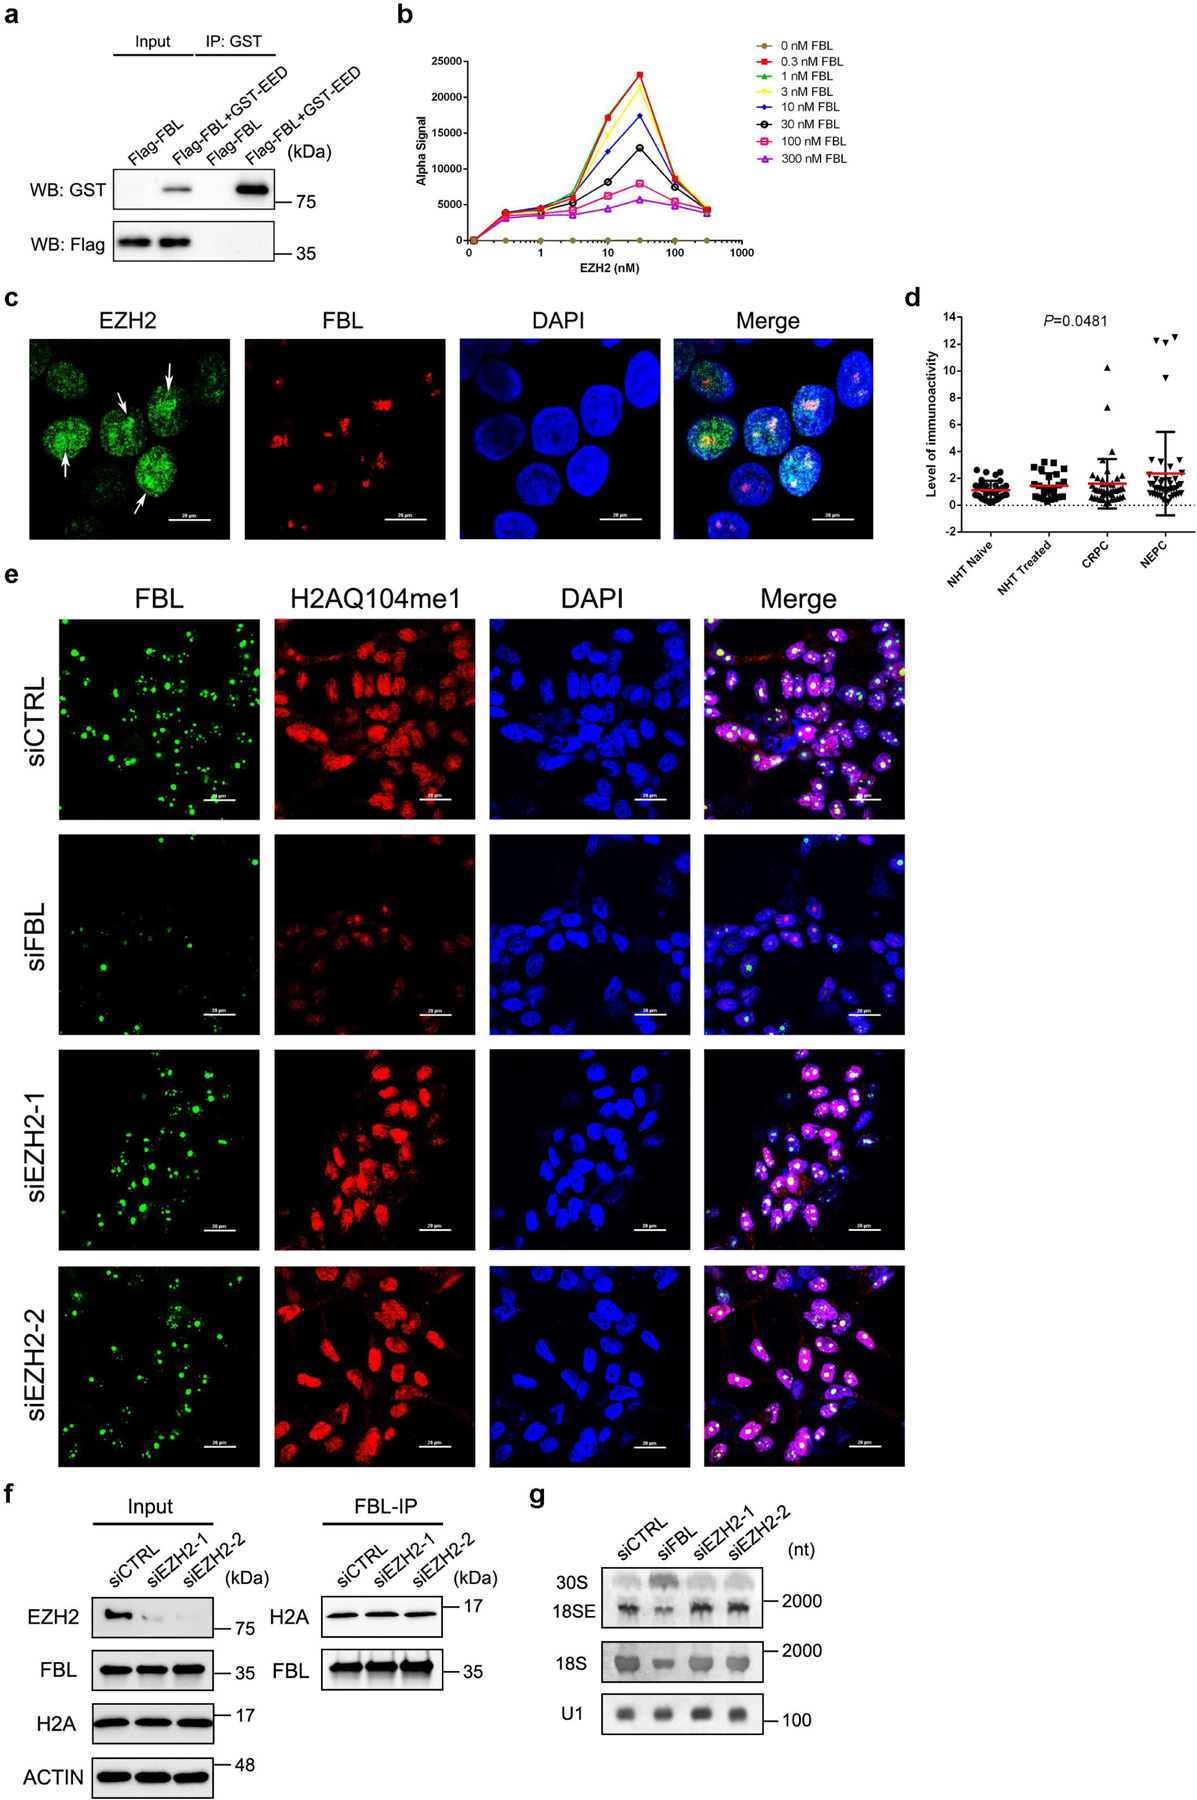
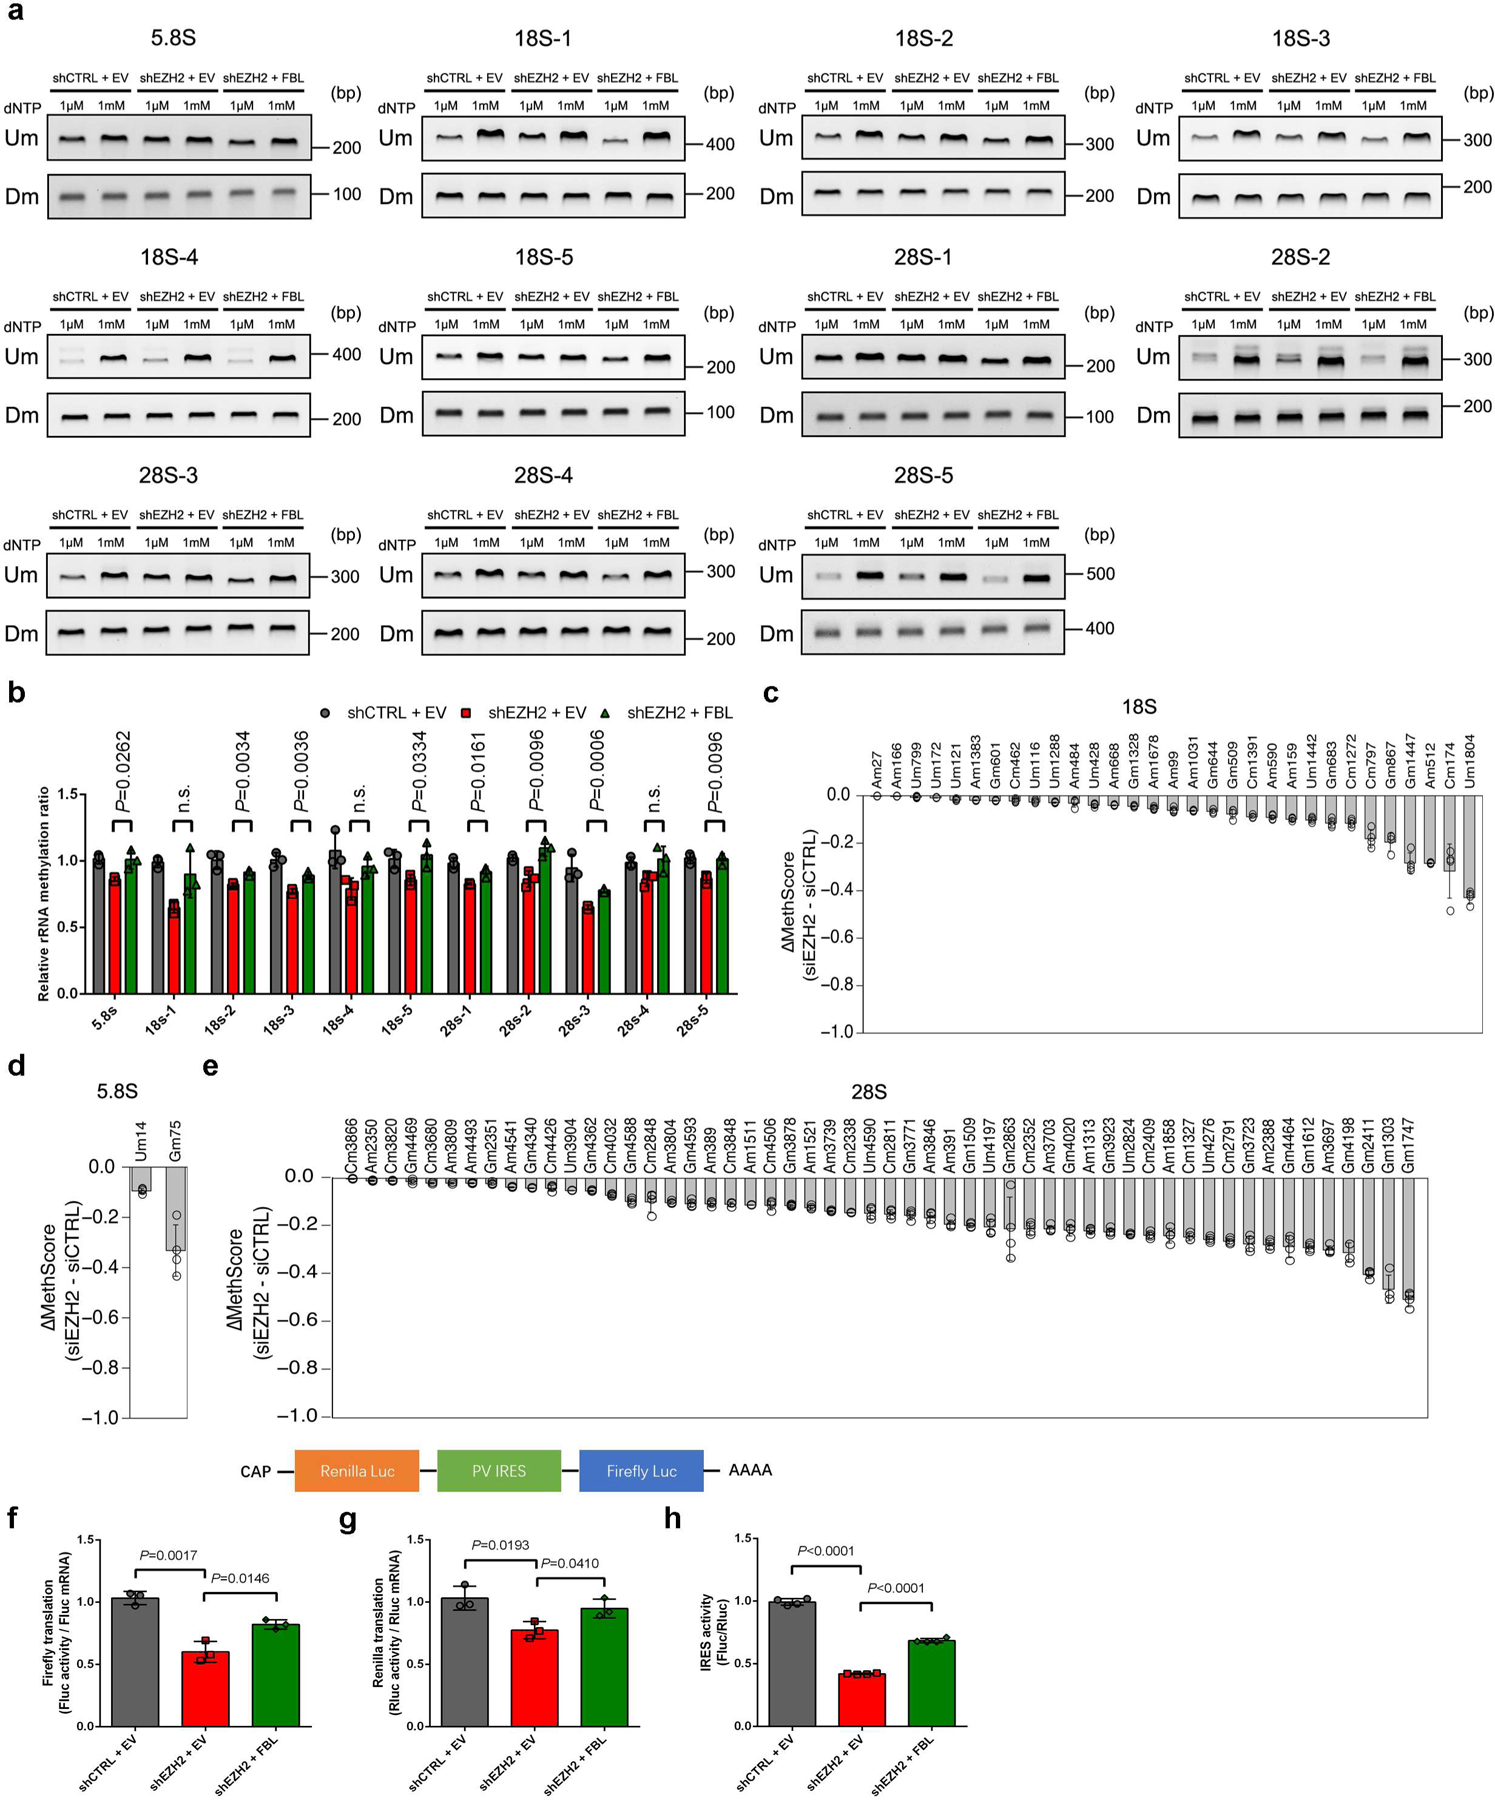
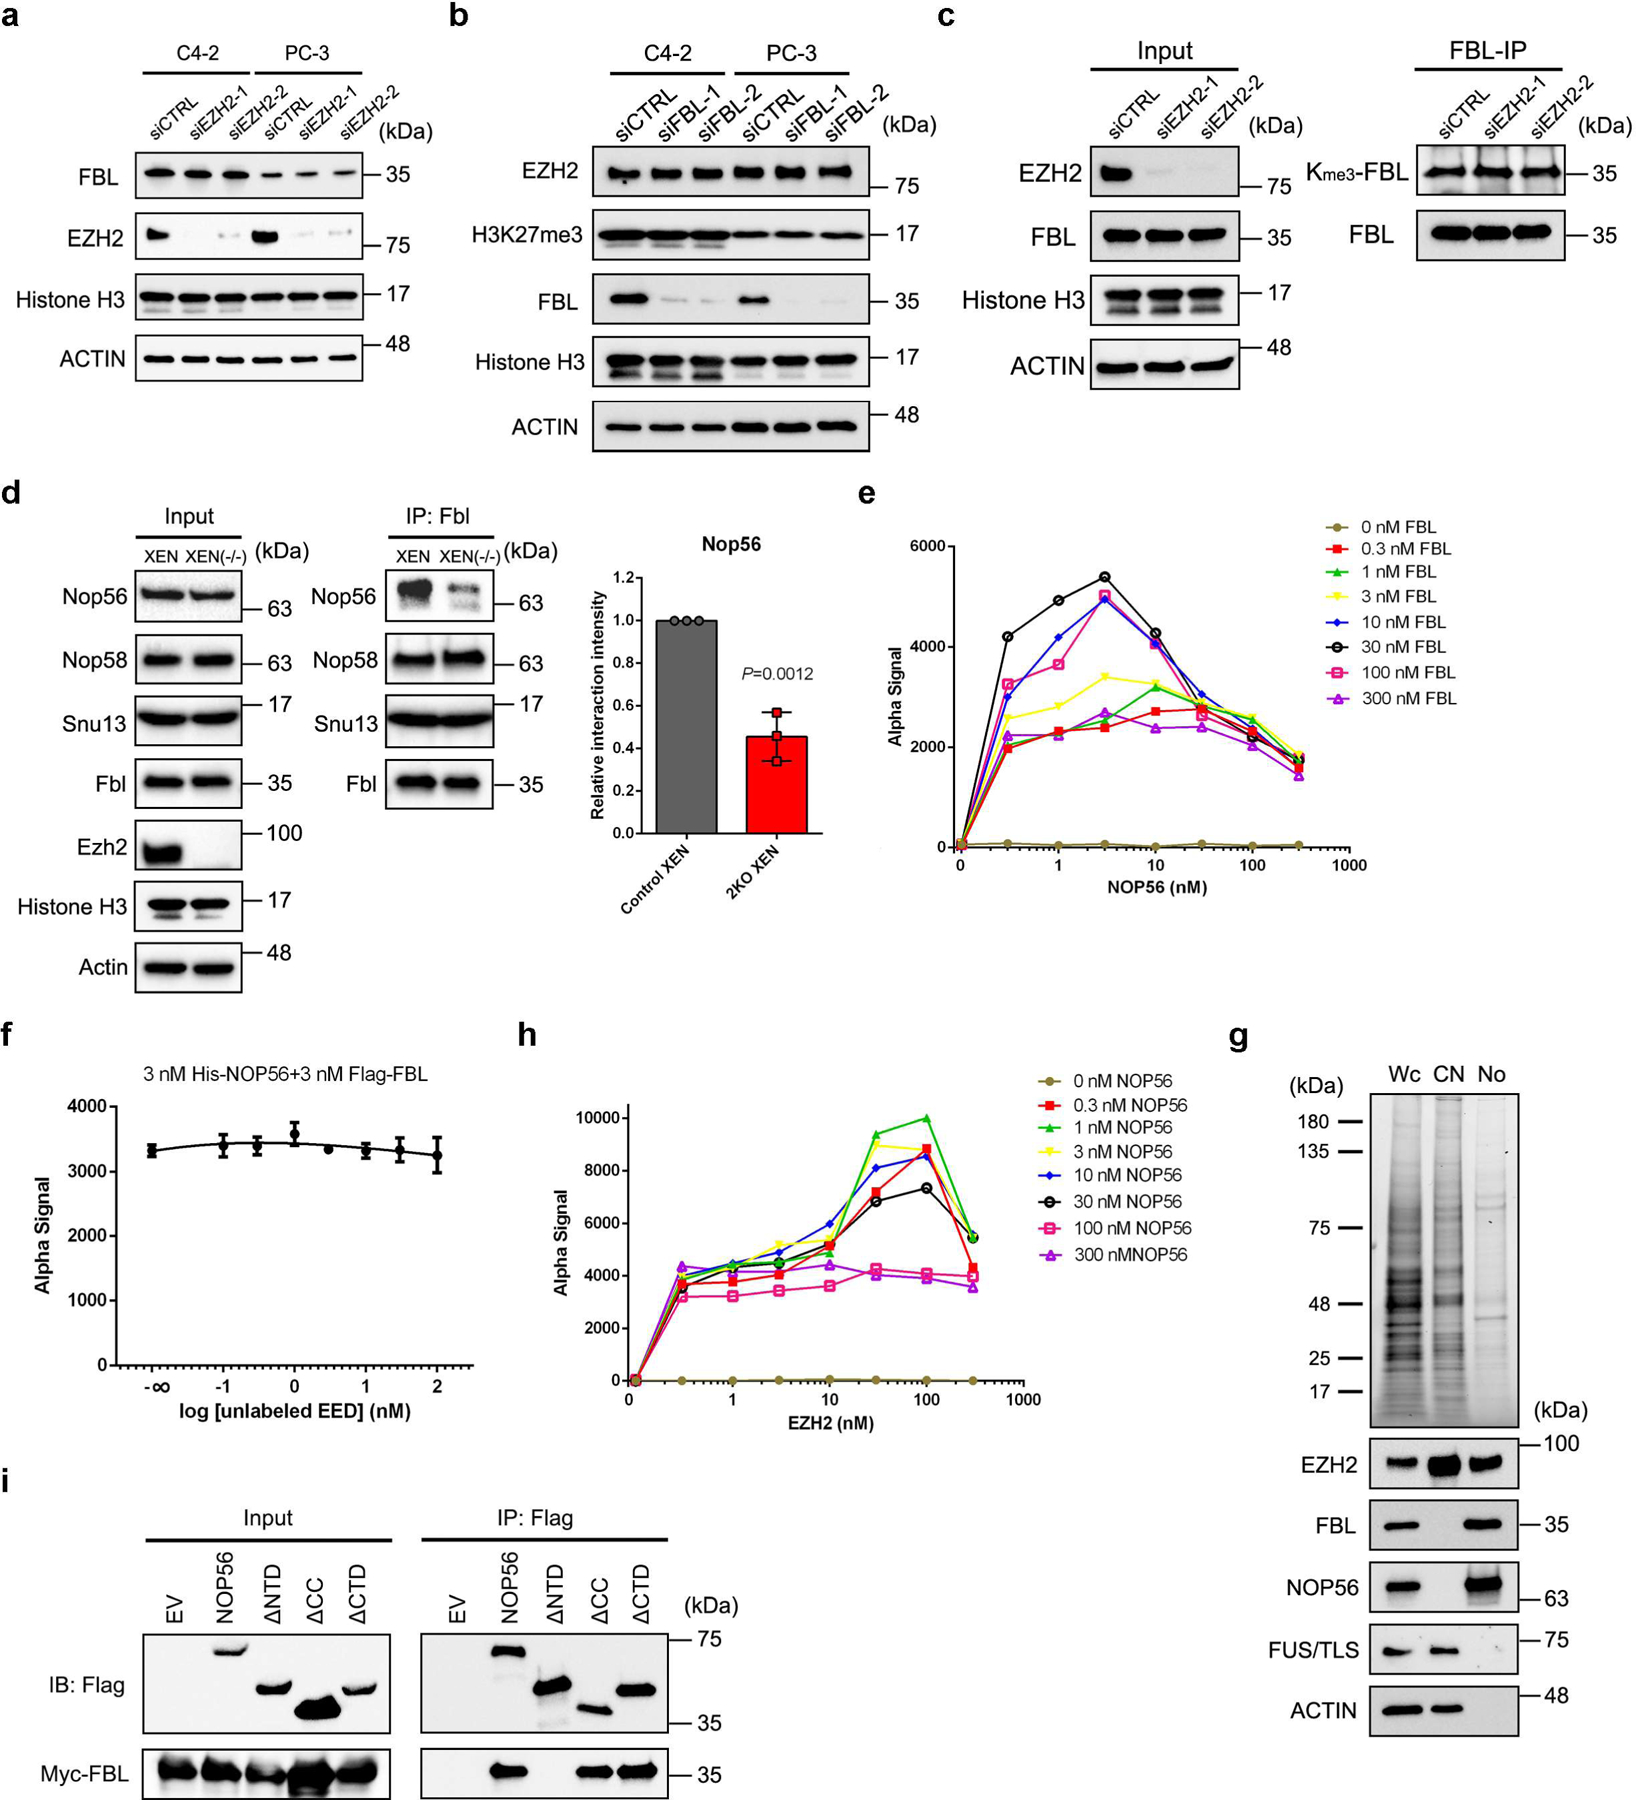
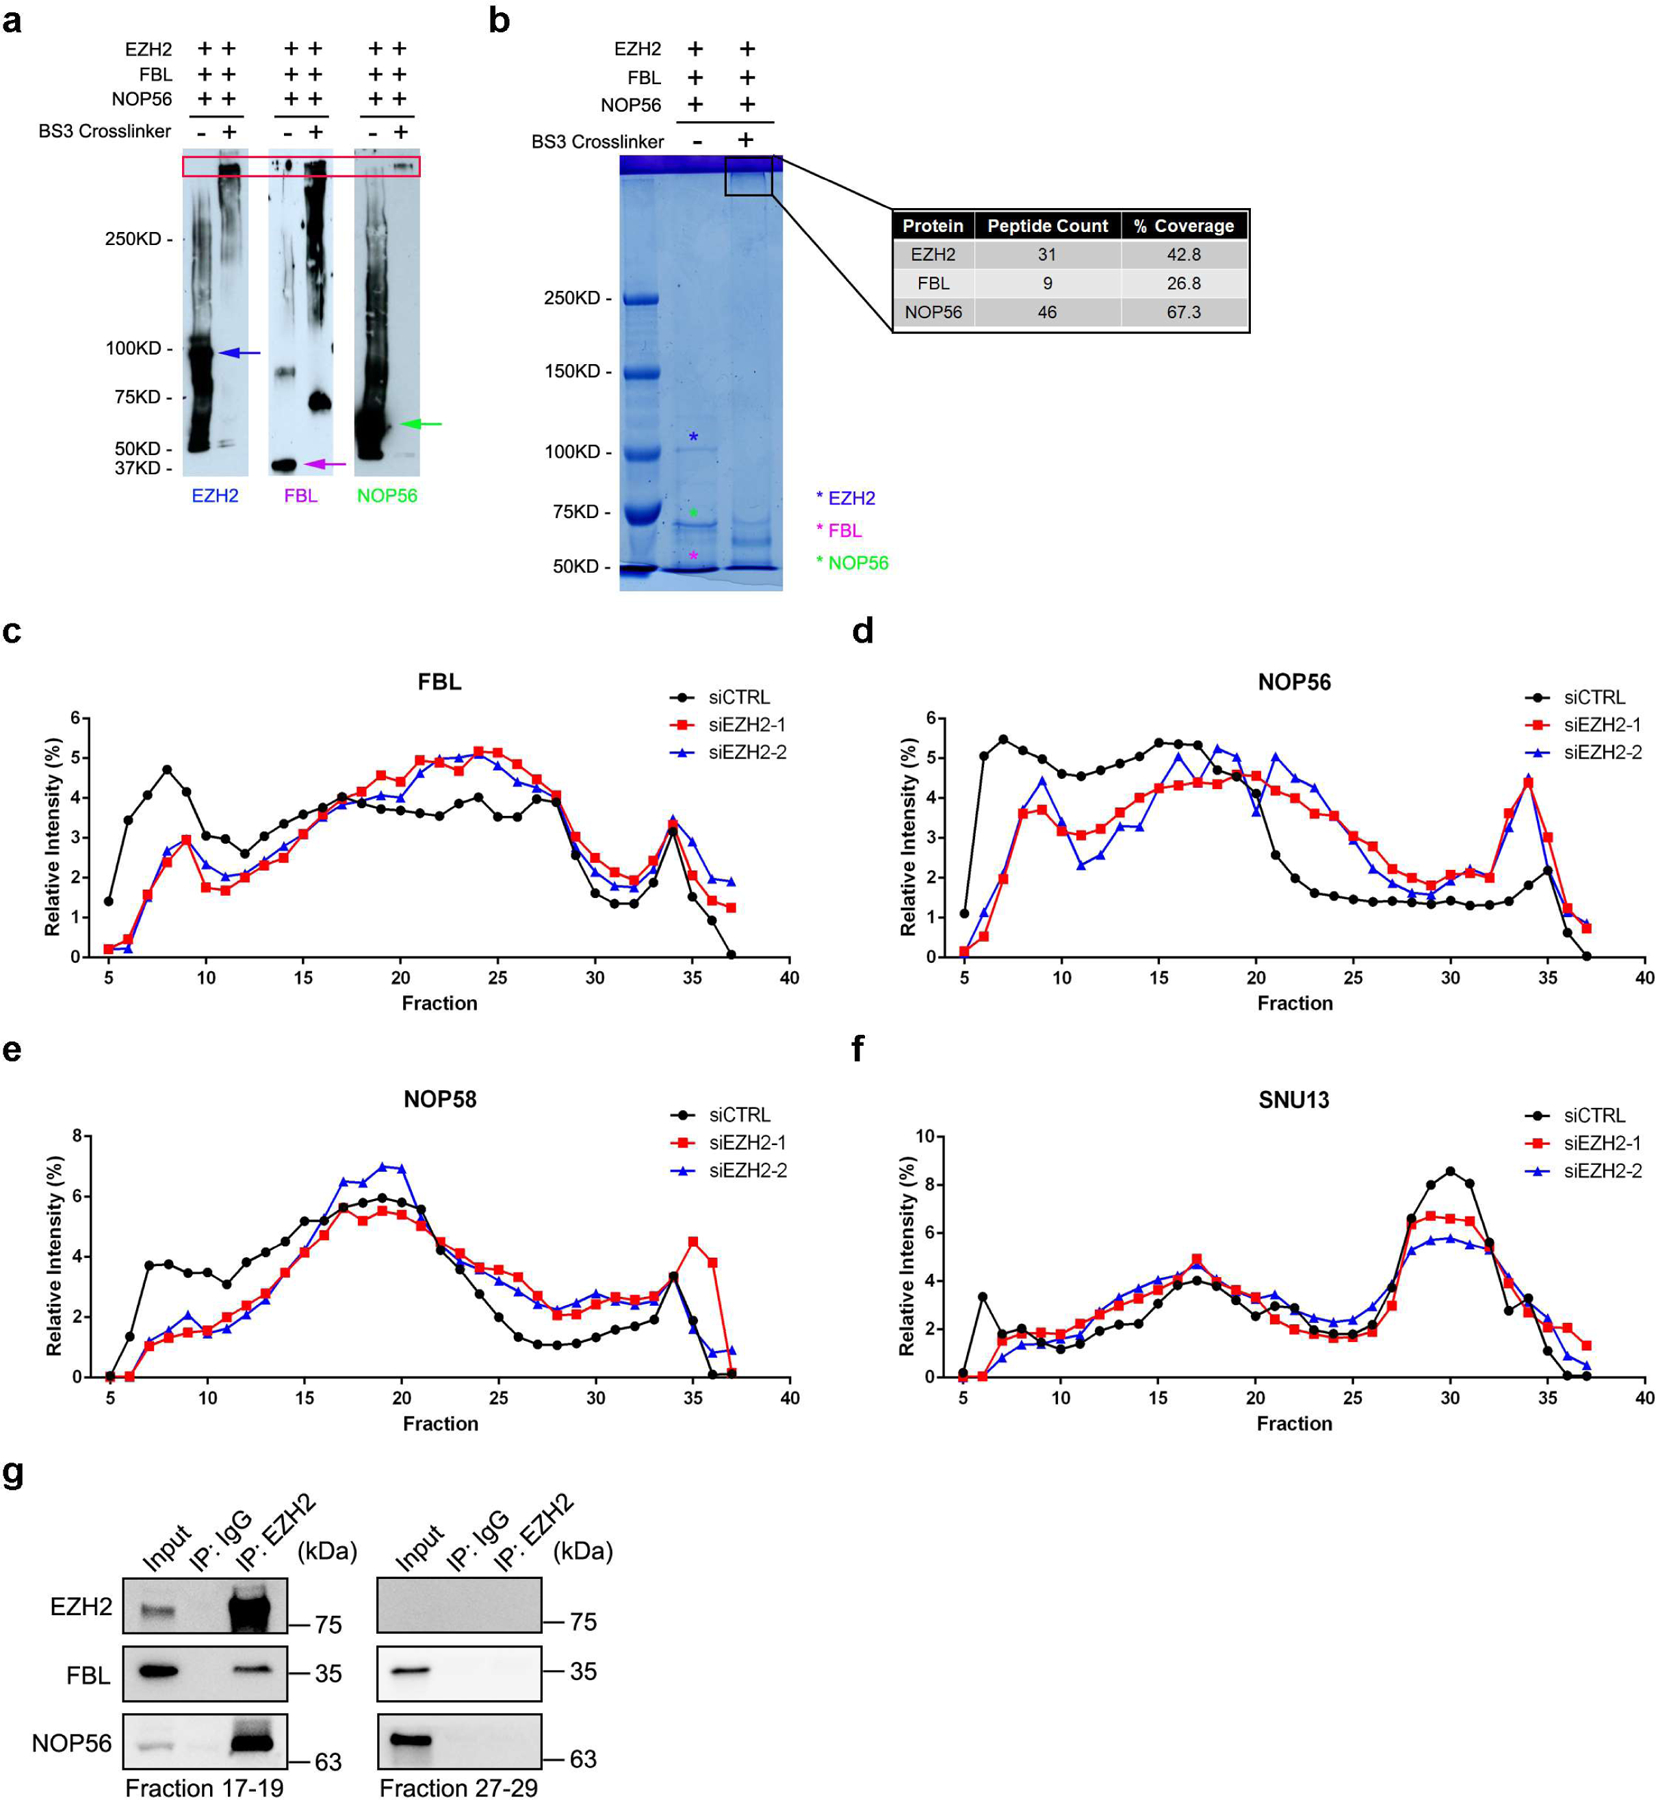
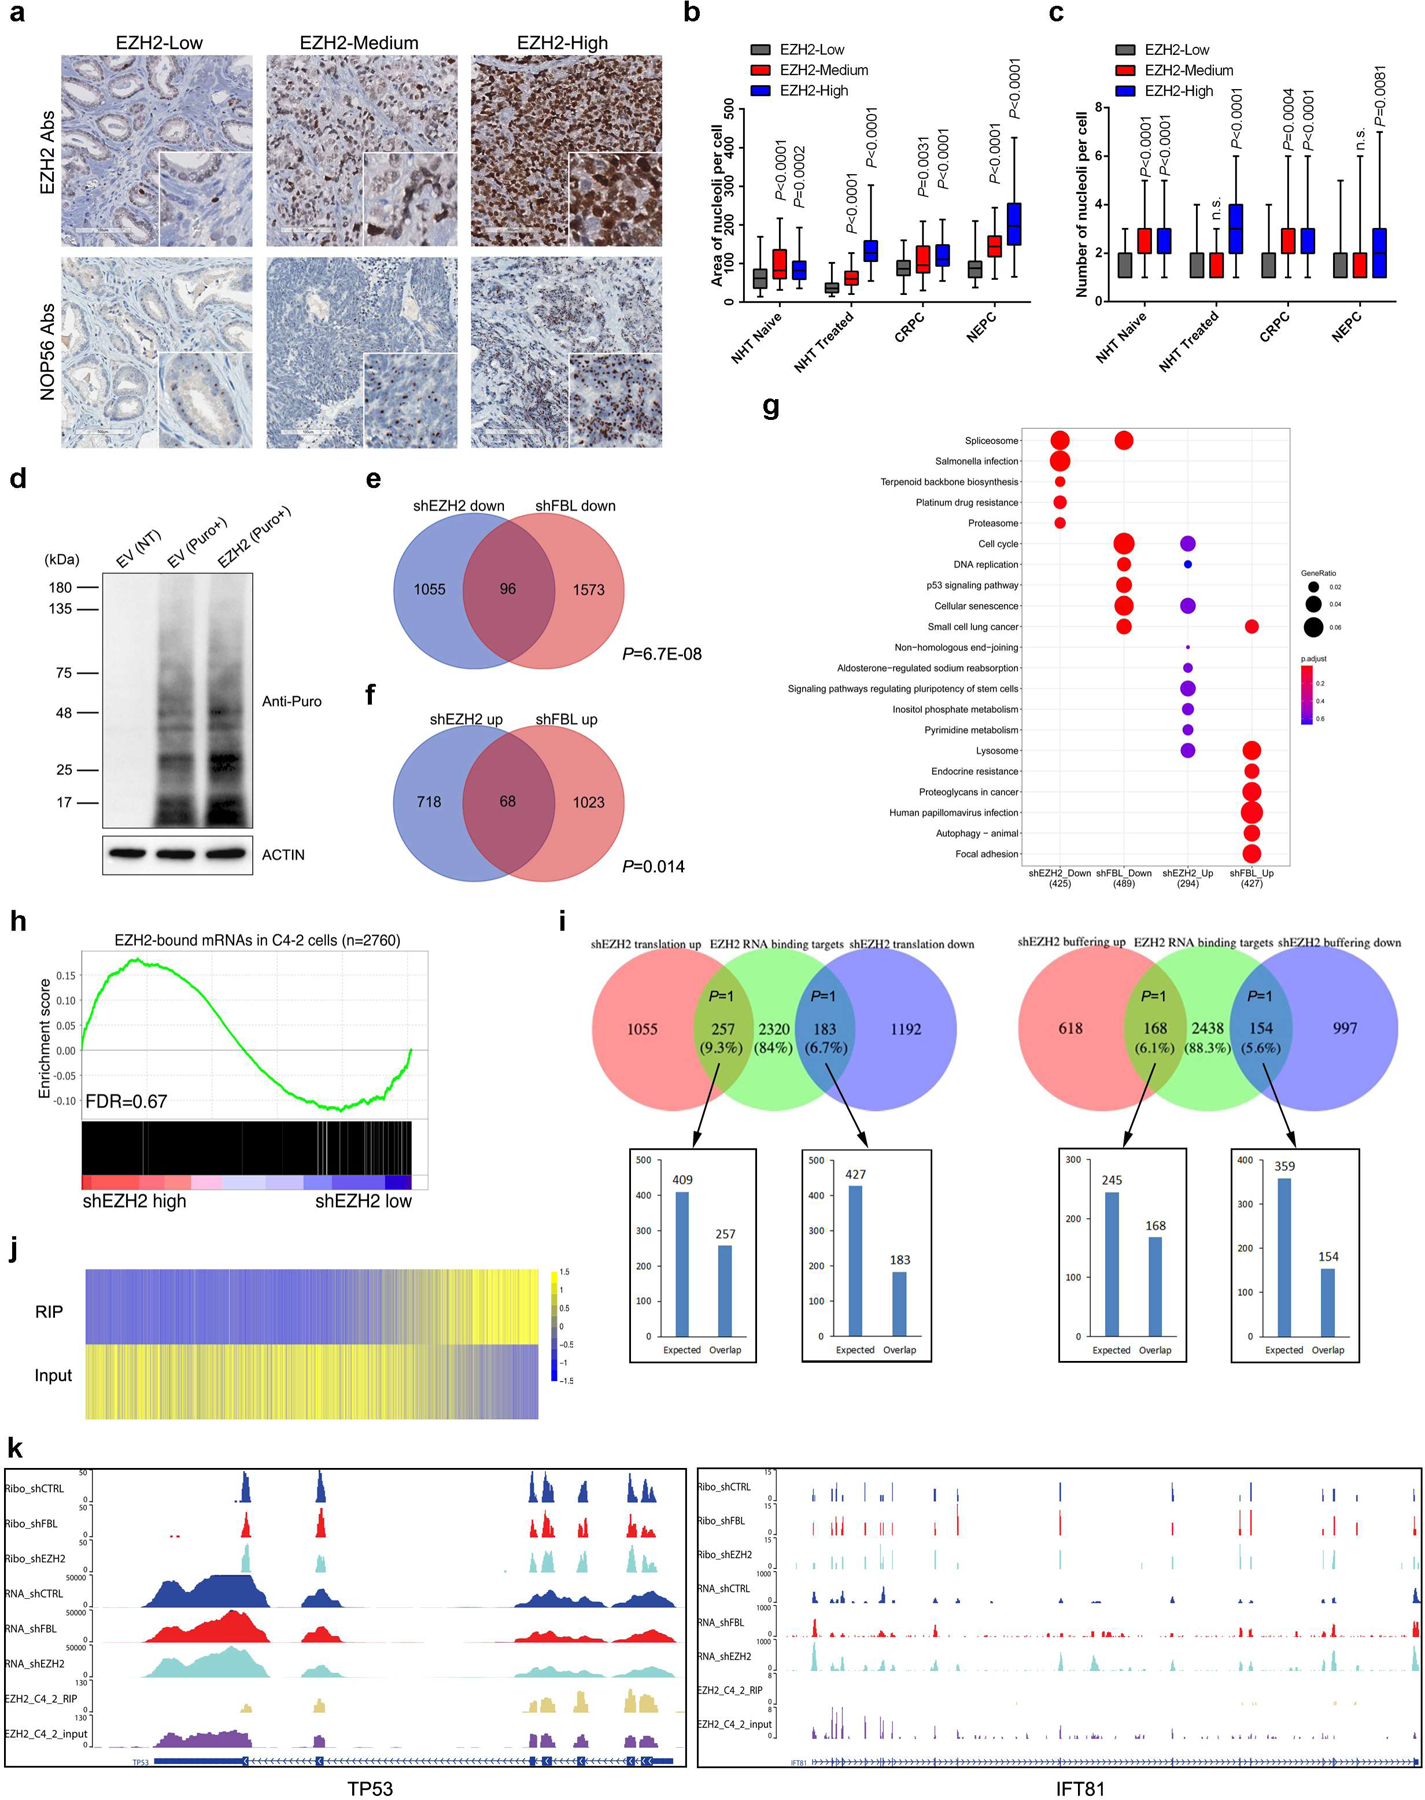
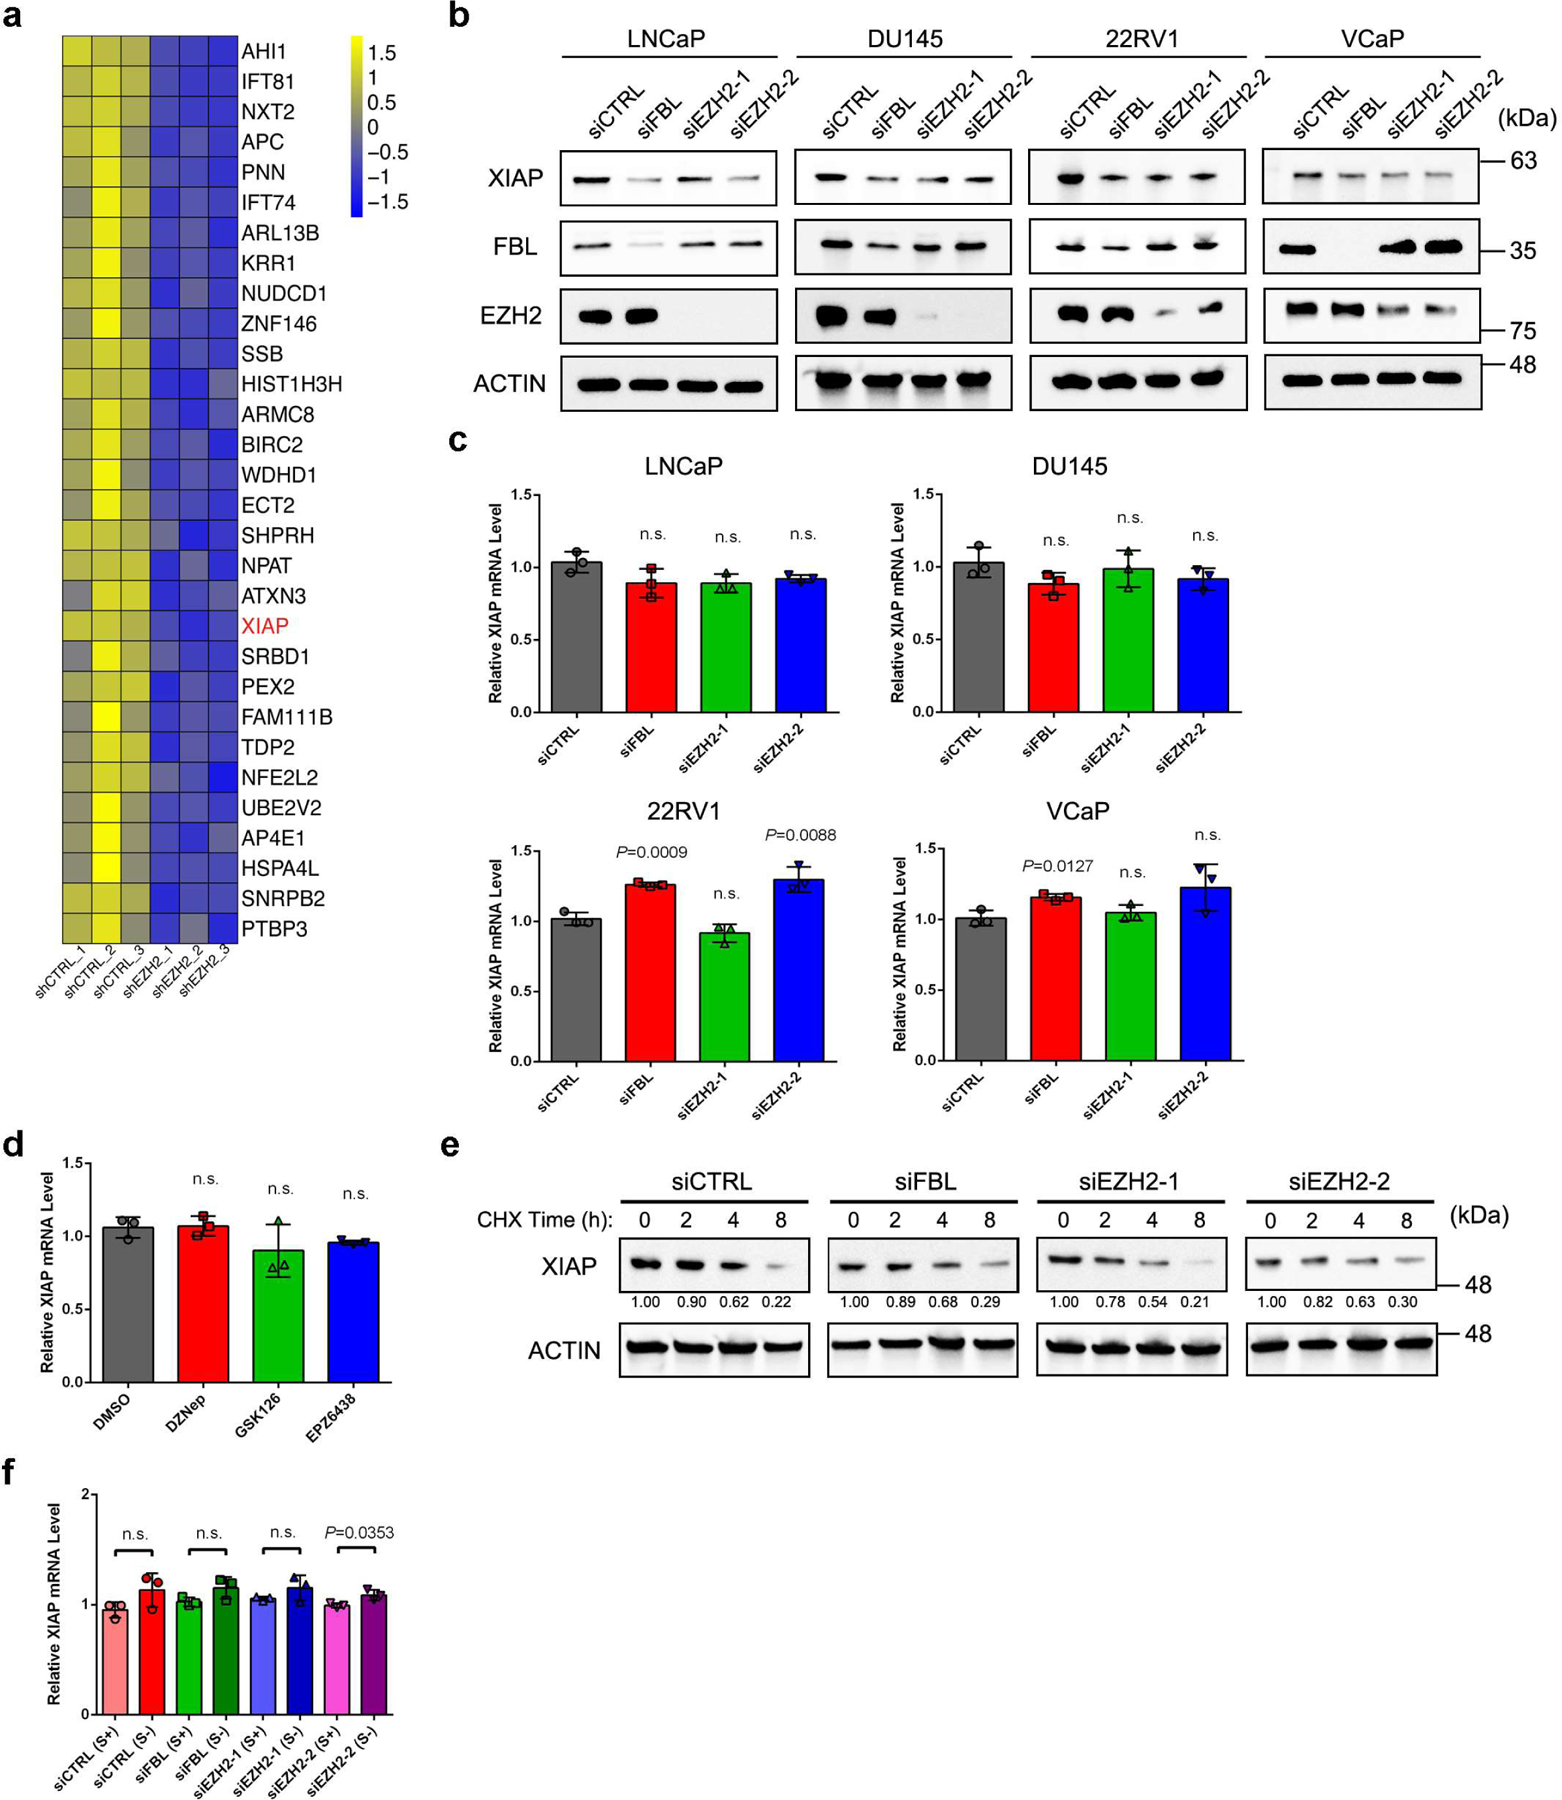
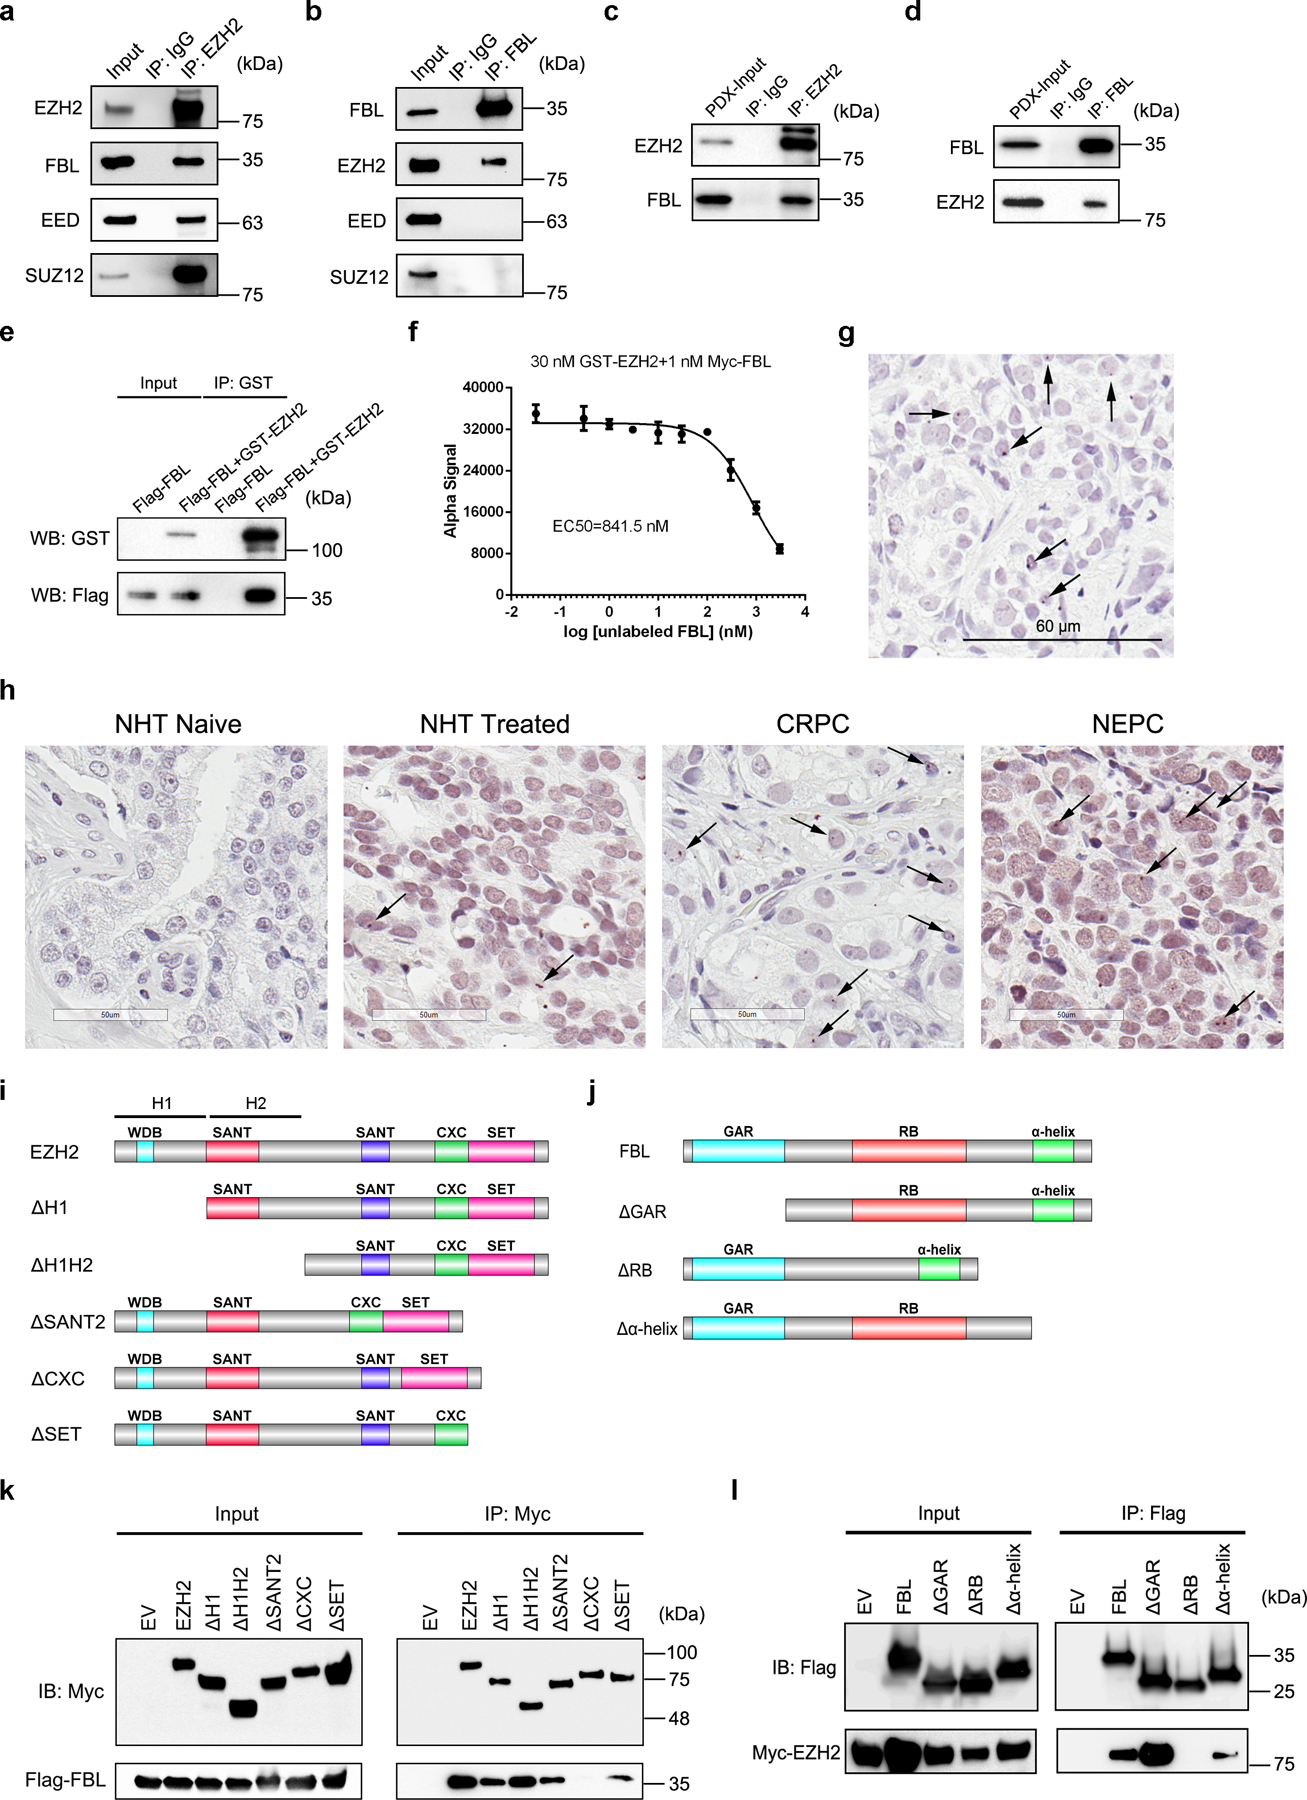
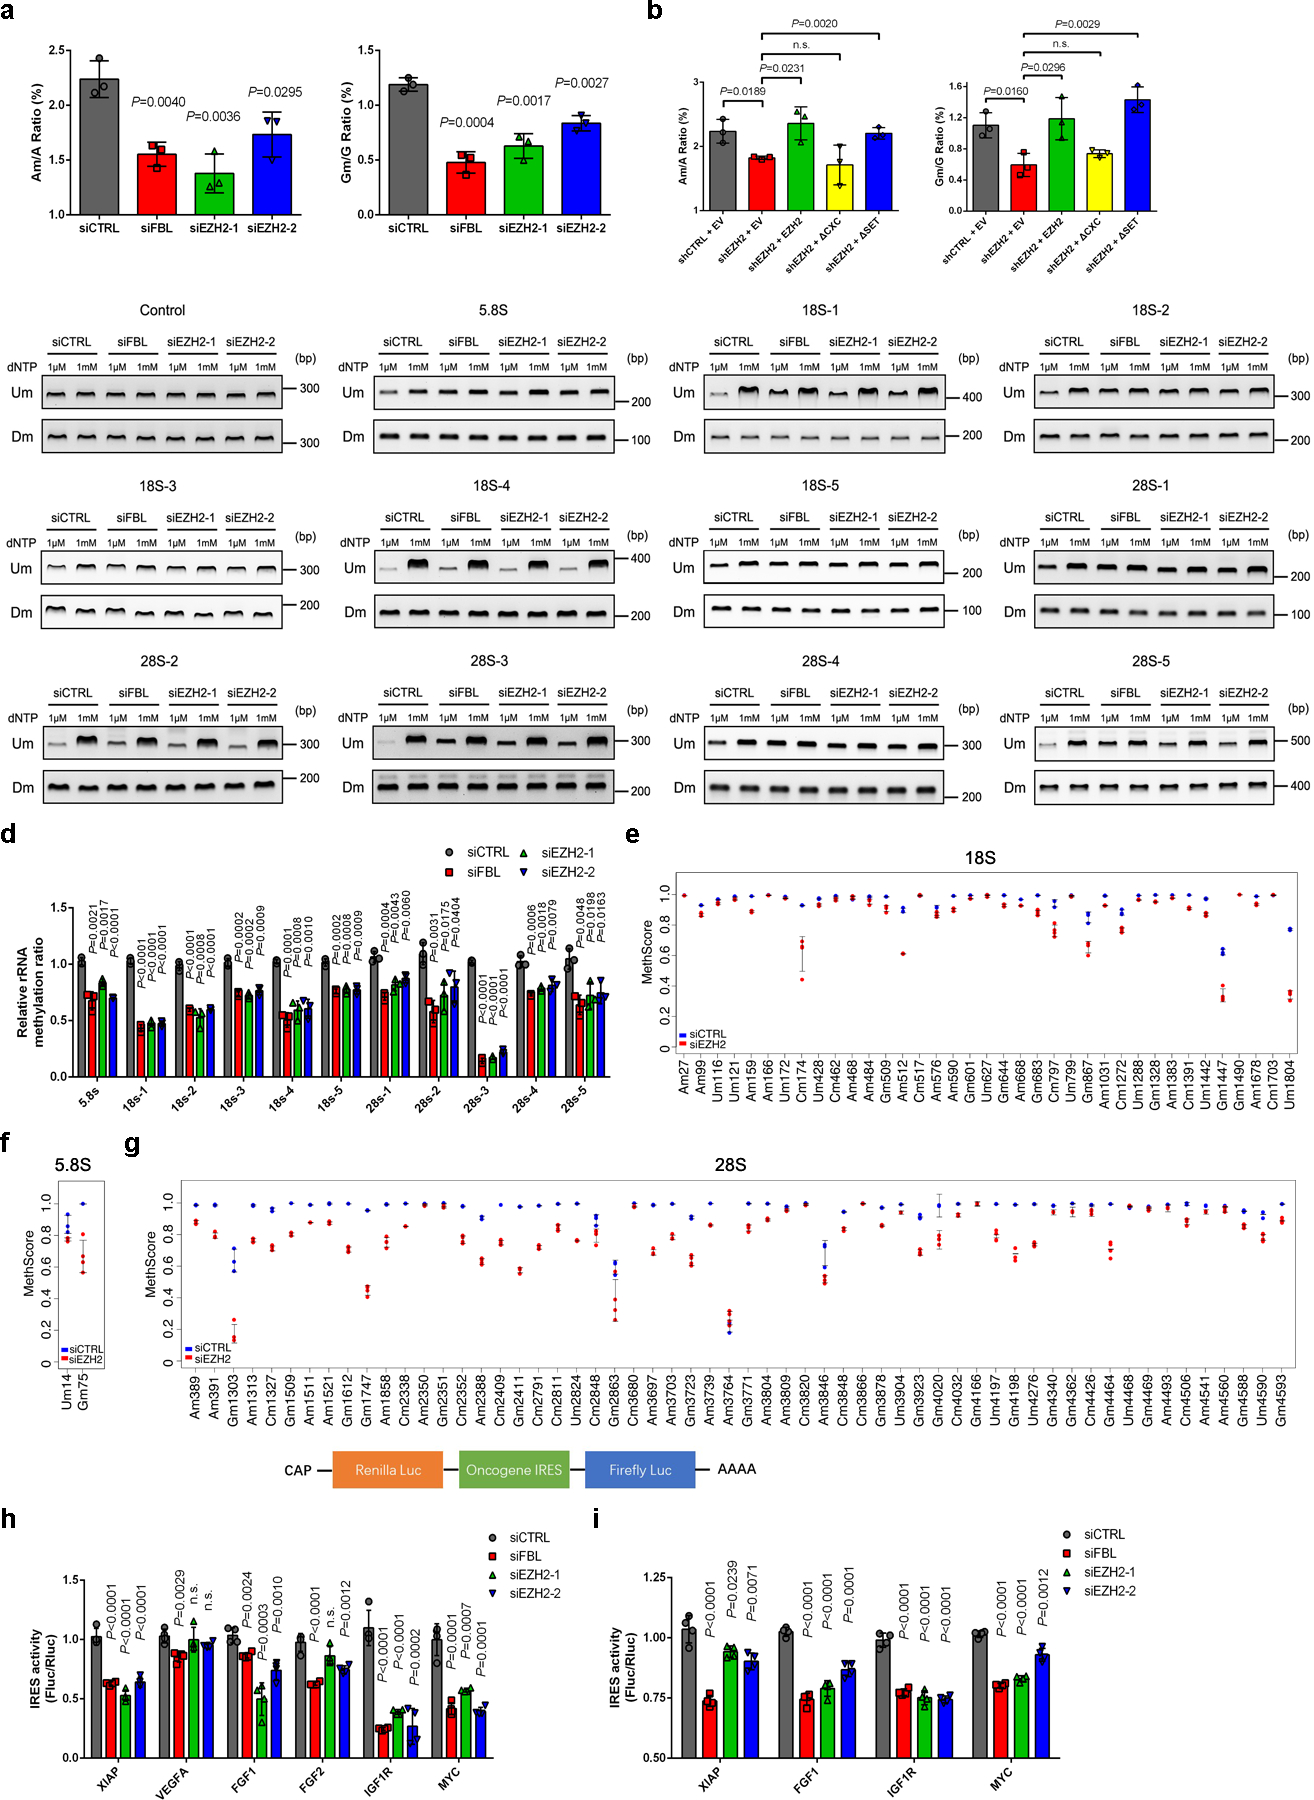
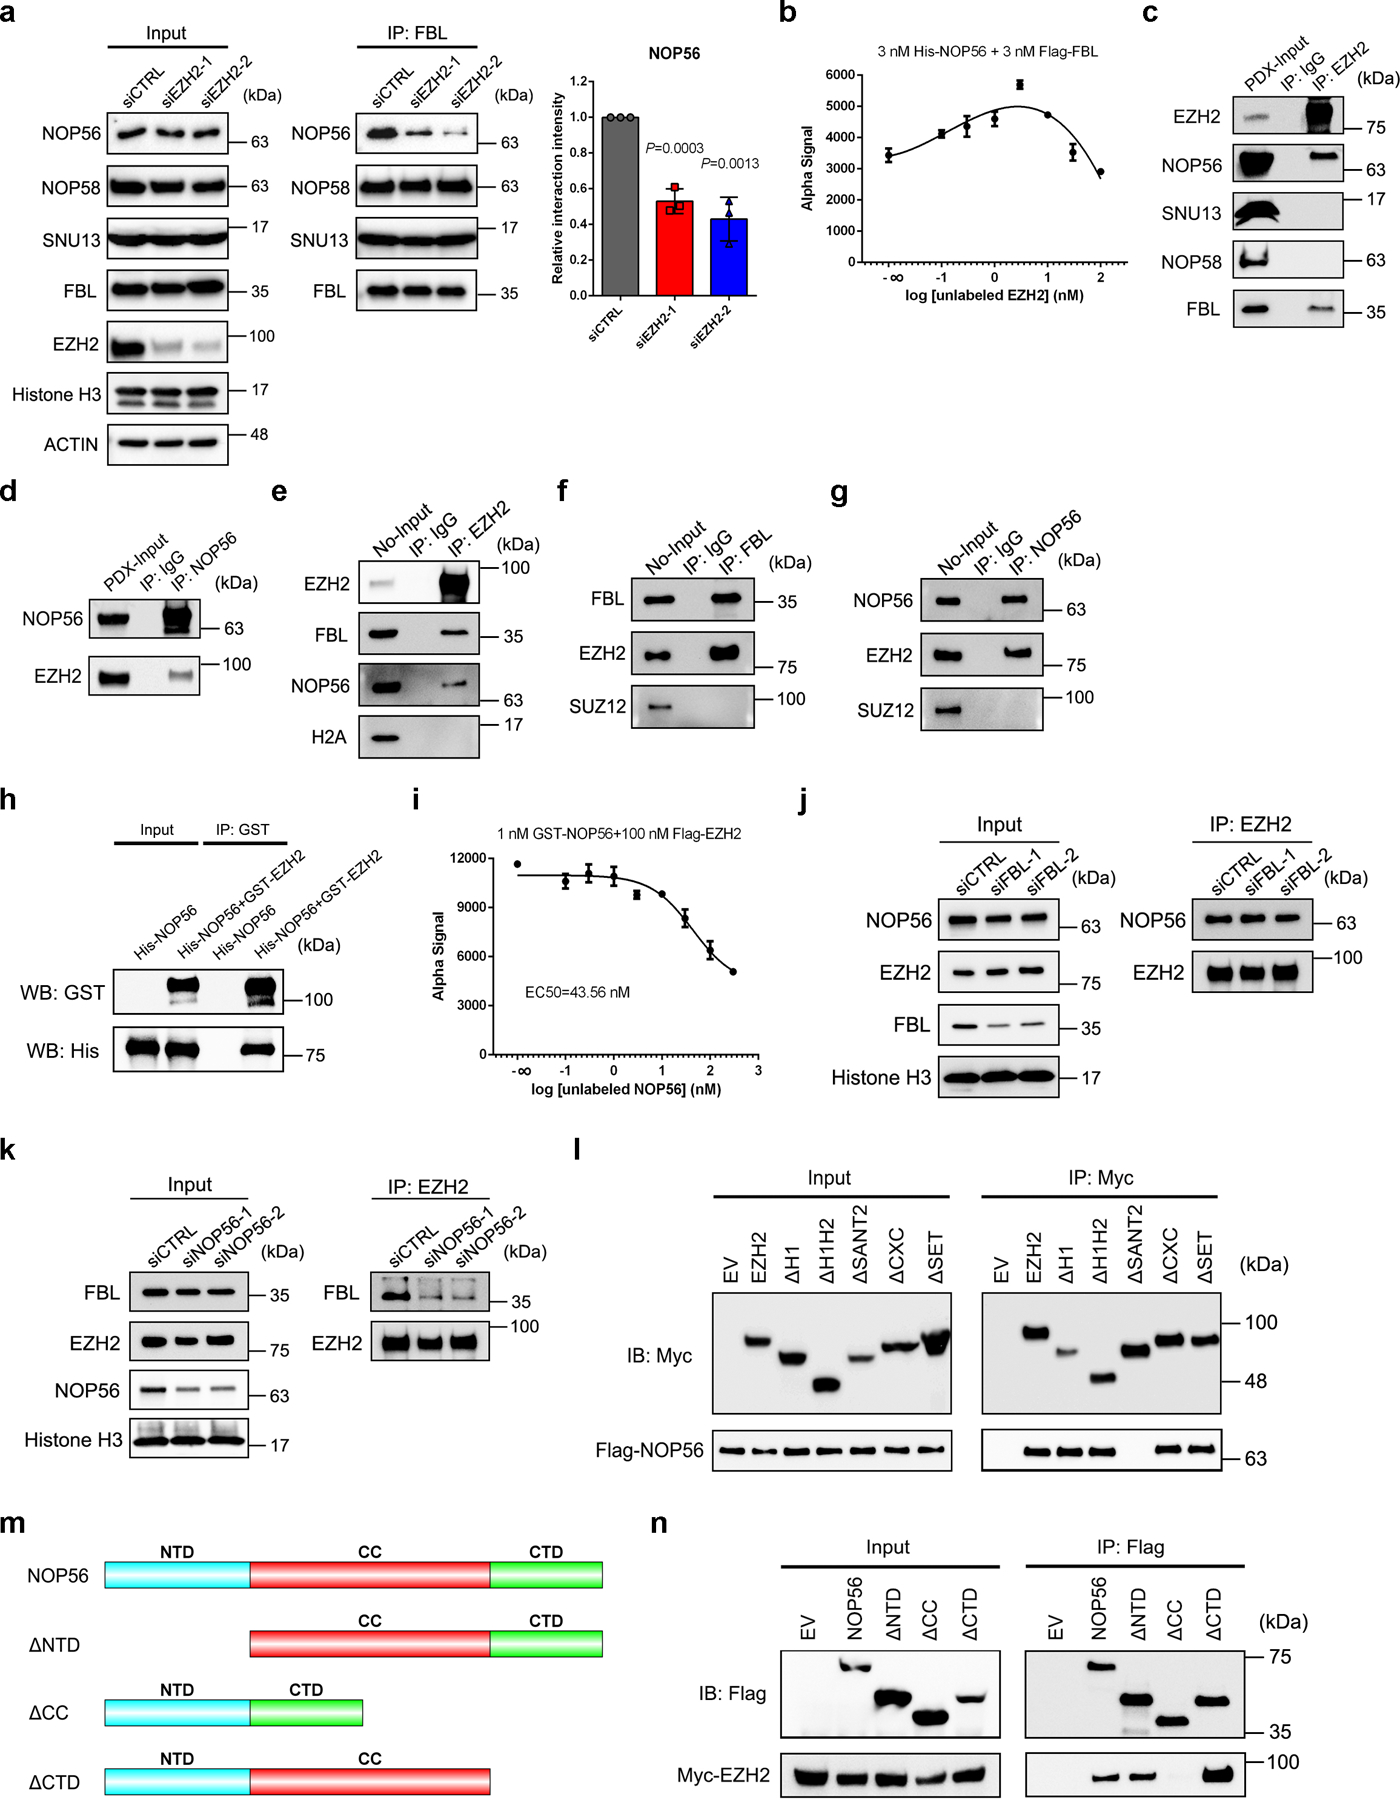
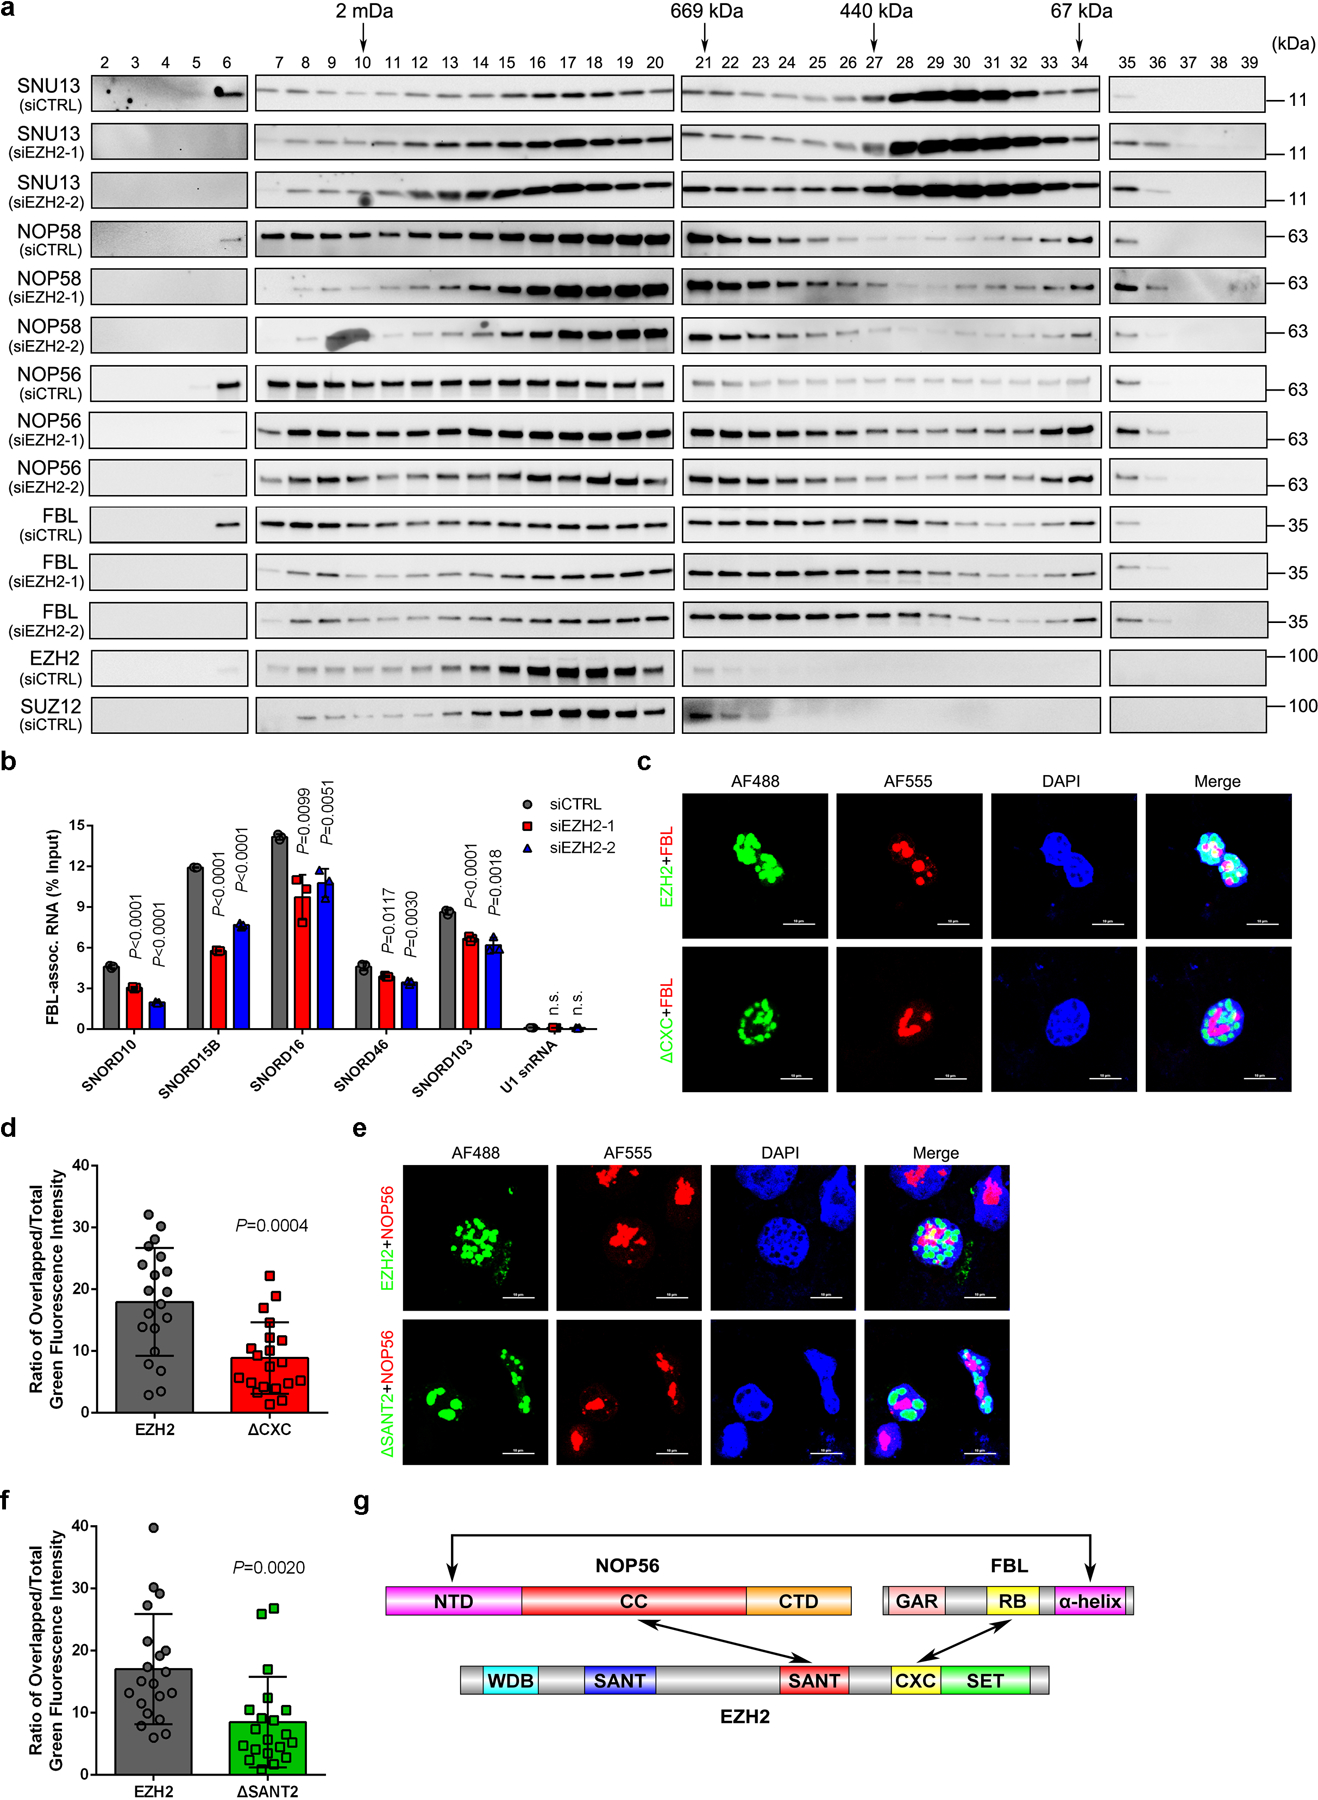
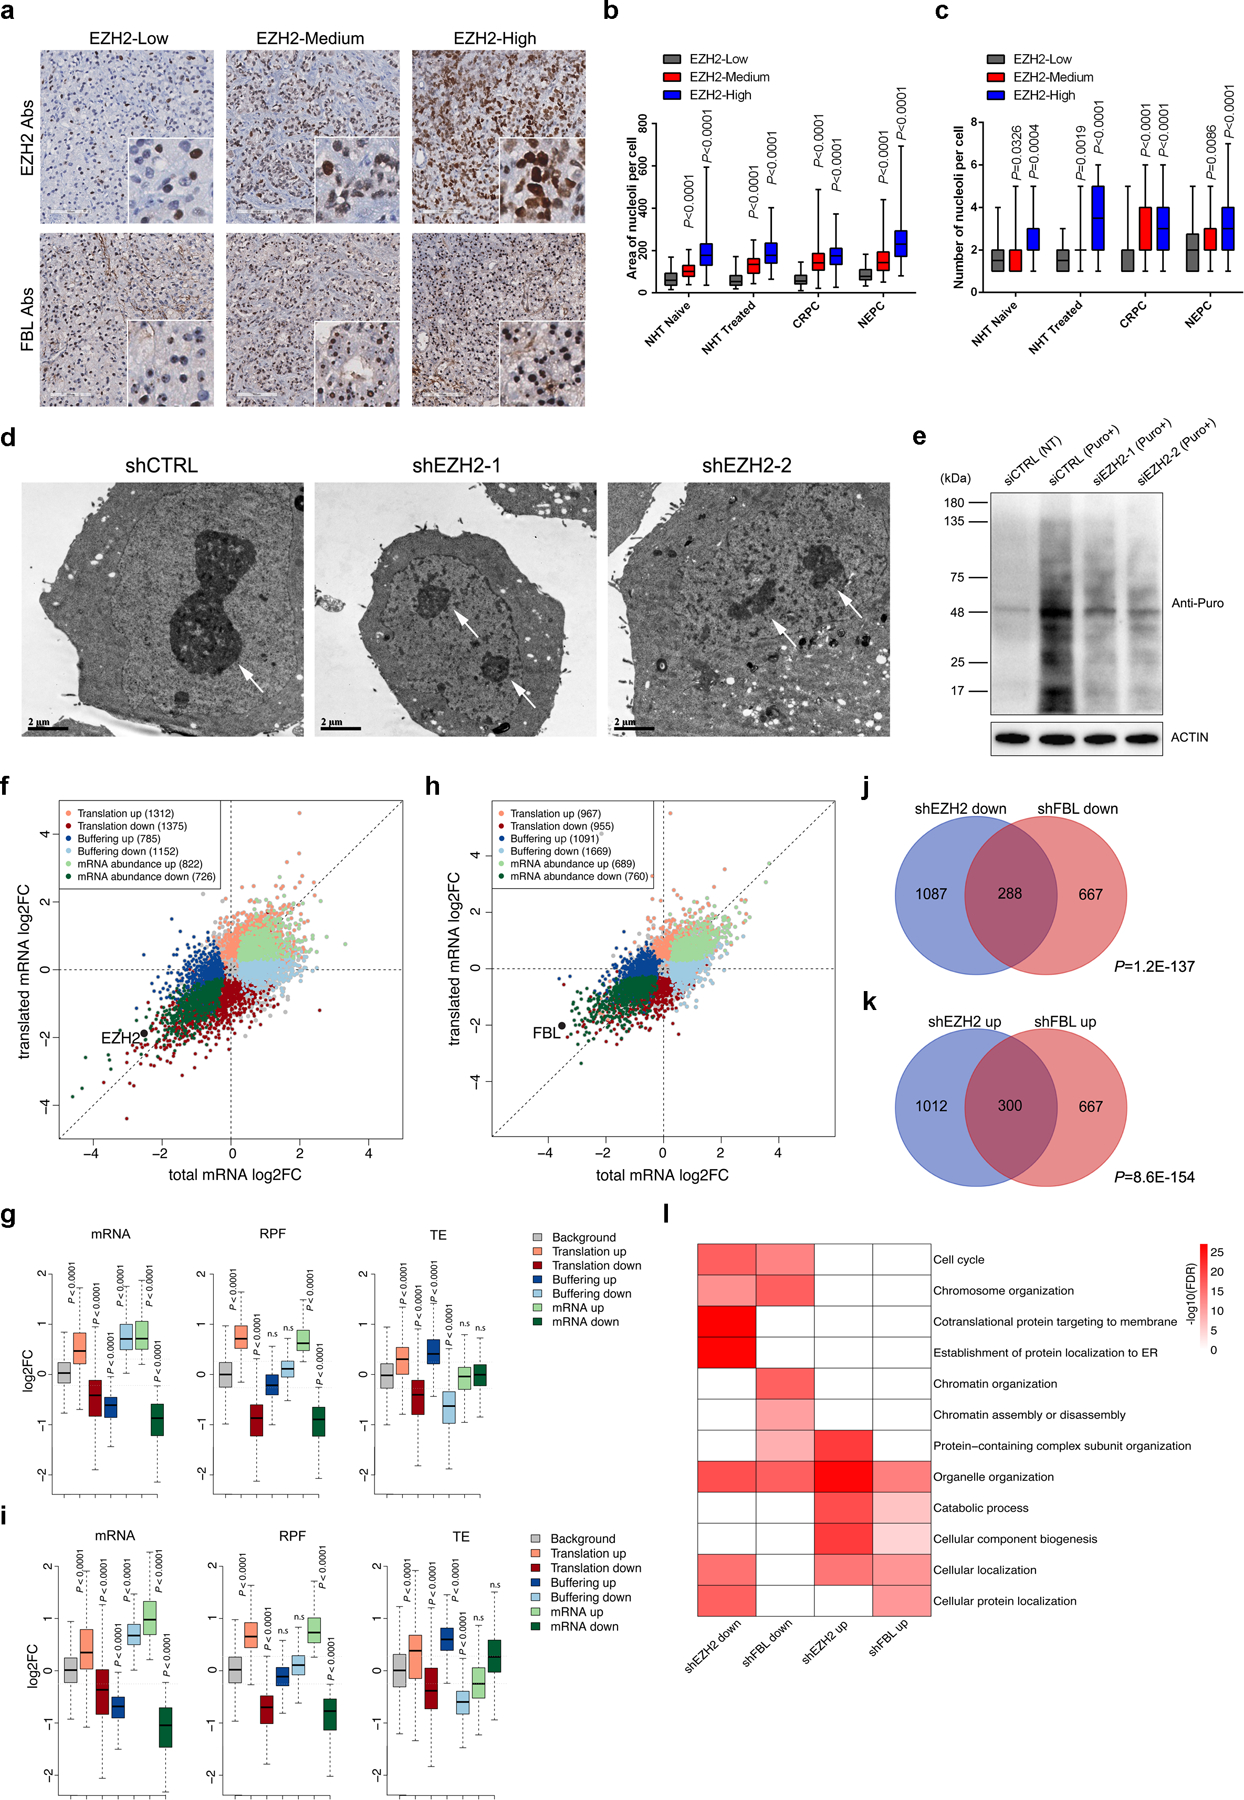
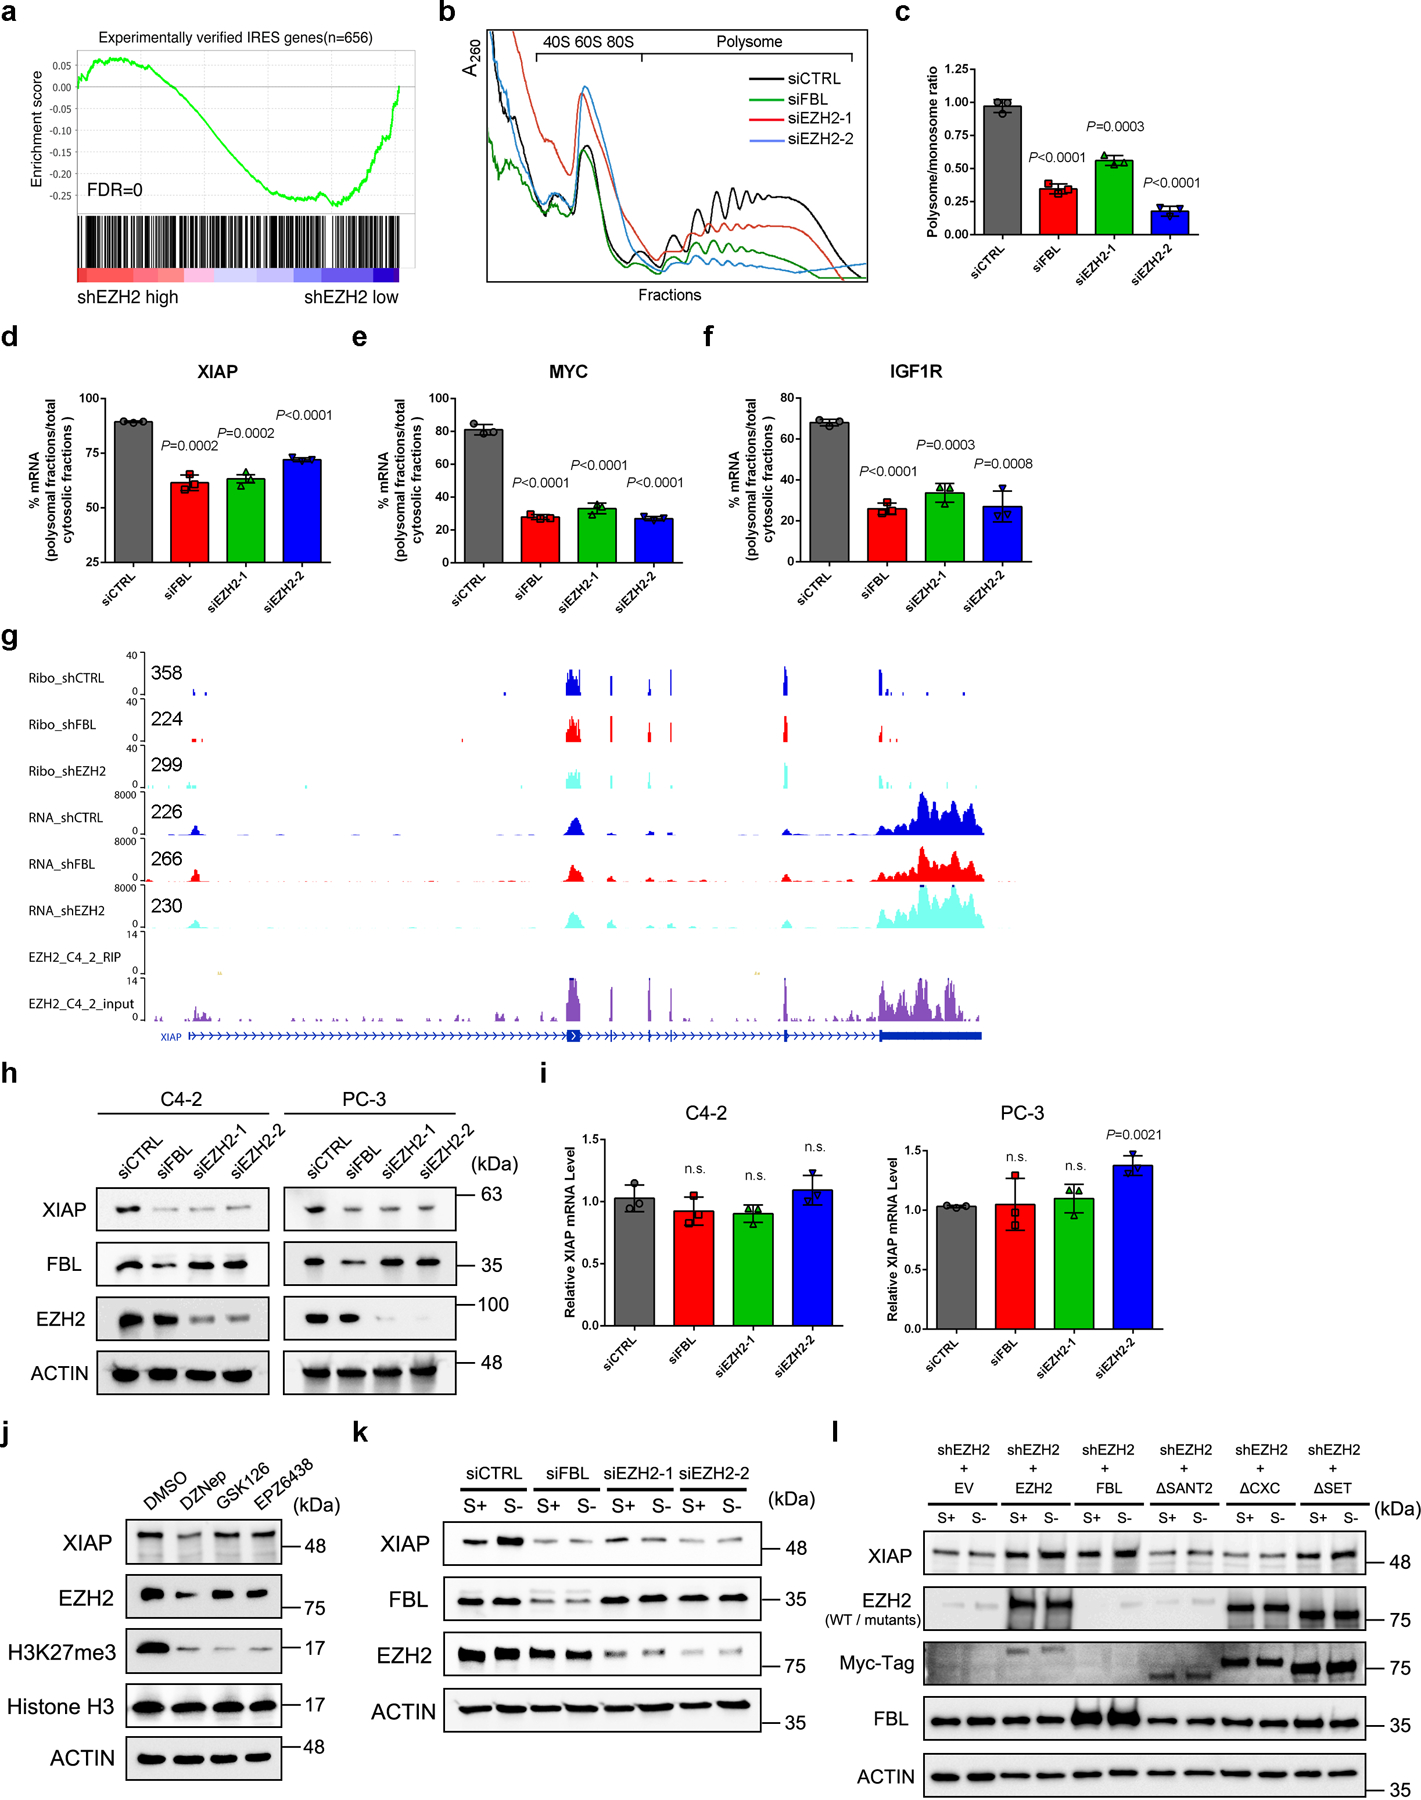
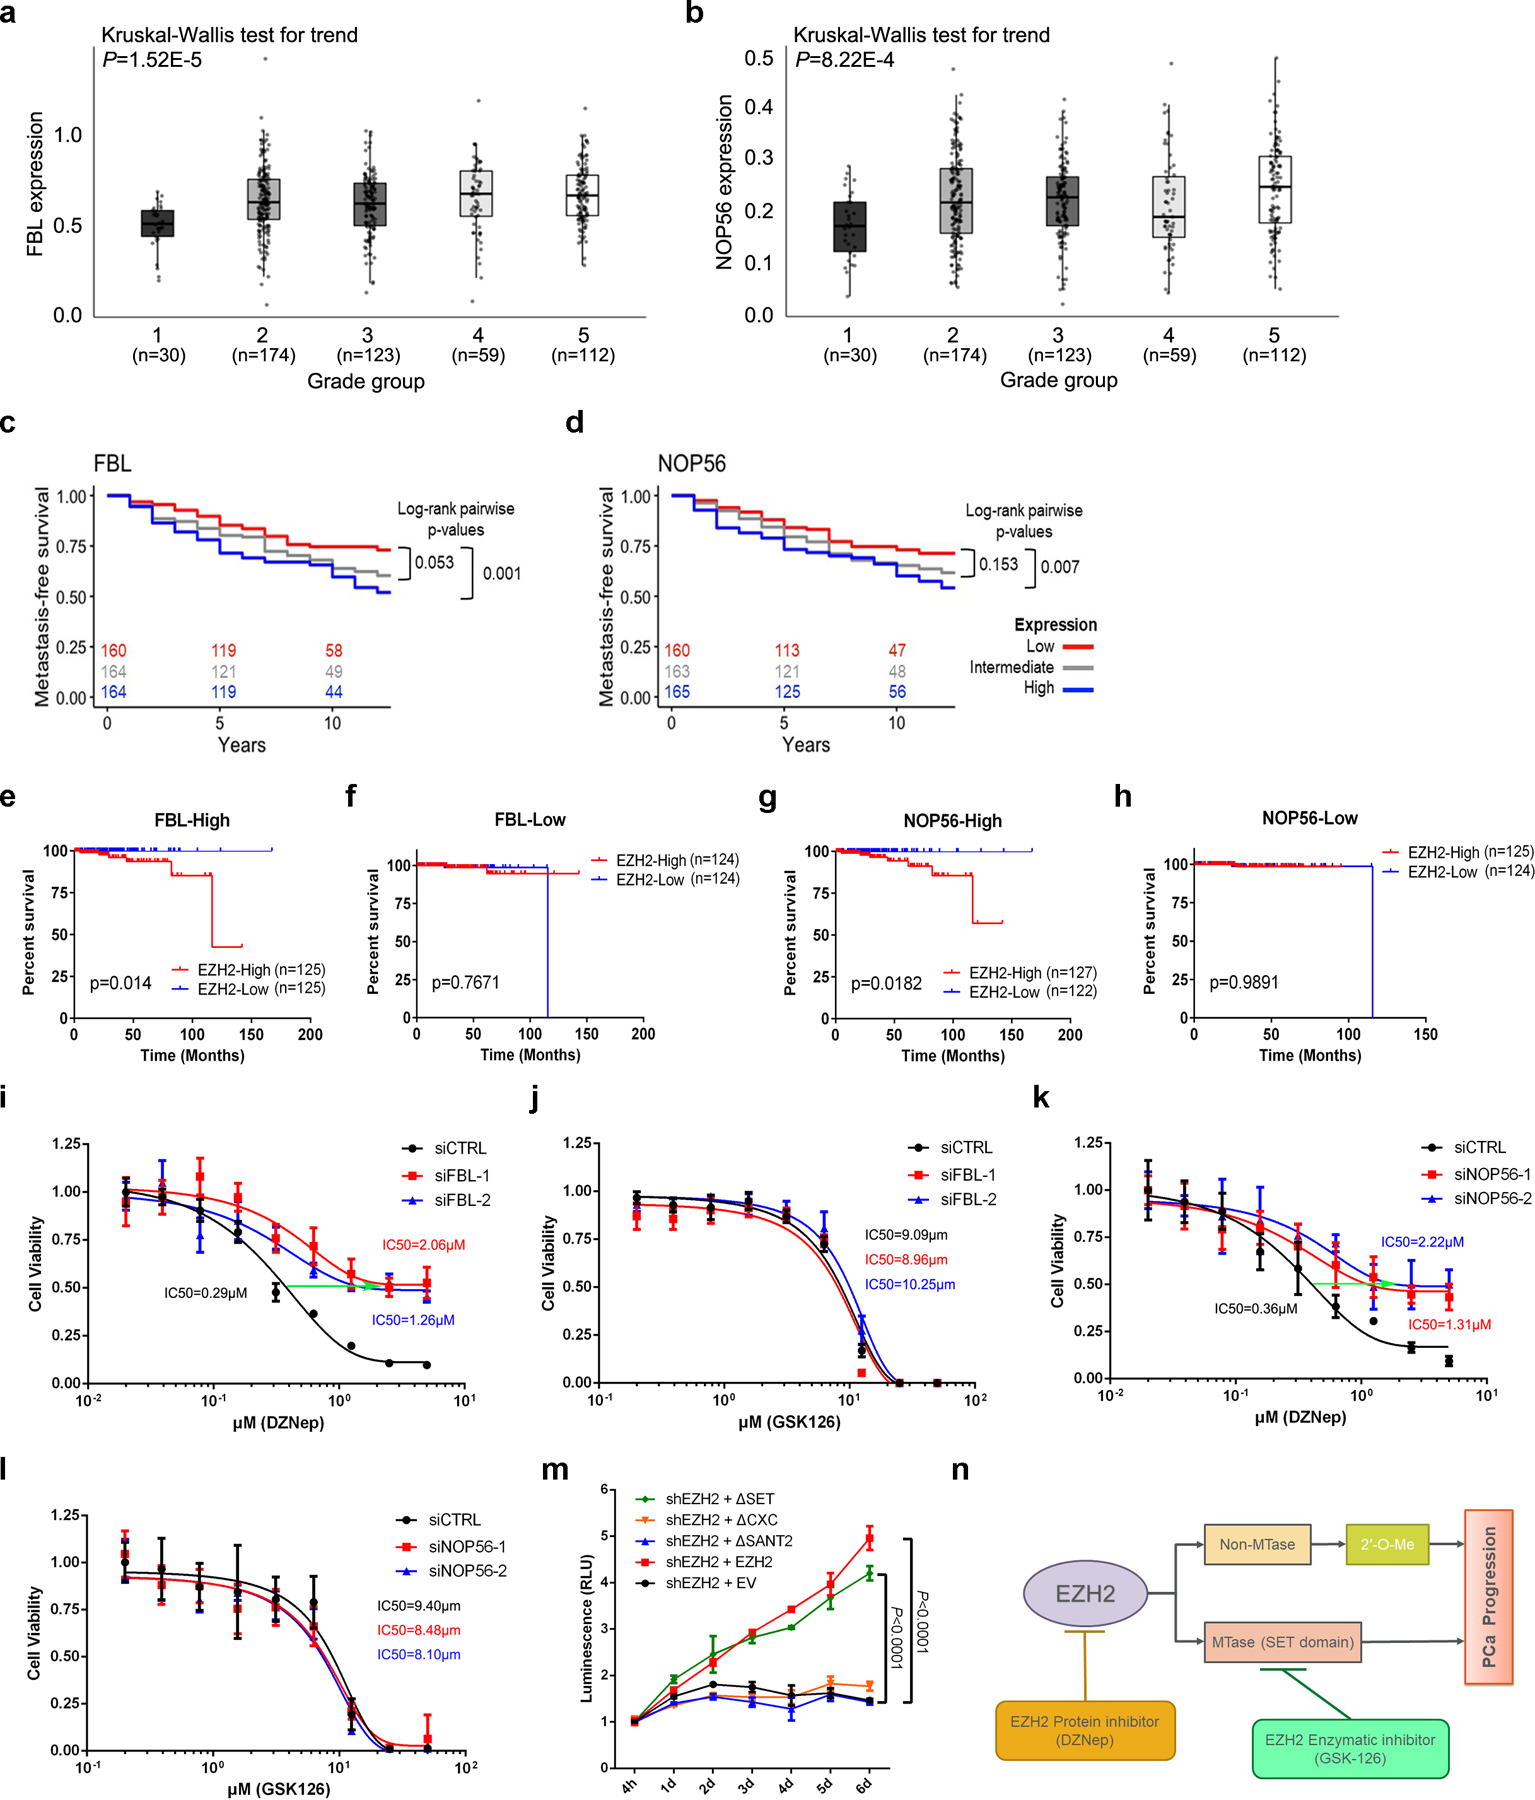
Dysregulated translation is a common feature of cancer. Uncovering its governing factors and underlying mechanism are important for cancer therapy. Here, we report that enhancer of zeste homologue 2 (EZH2), previously known as a transcription repressor and lysine methyltransferase, can directly interact with fibrillarin (FBL) to exert its role in translational regulation. We demonstrate that EZH2 enhances rRNA 2'-O methylation via its direct interaction with FBL. Mechanistically, EZH2 strengthens the FBL-NOP56 interaction and facilitates the assembly of box C/D small nucleolar ribonucleoprotein. Strikingly, EZH2 deficiency impairs the translation process globally and reduces internal ribosome entry site (IRES)-dependent translation initiation in cancer cells. Our findings reveal a previously unrecognized role of EZH2 in cancer-related translational regulation.


Conflict of interest statement

Competing interests

No potential conflict of interest to disclose.

Figures

Extended Data Fig. 1
Extended Data Fig. 1. EZH2 interacts with FBL, but does not affect H2AQ104me modification and 18S rRNA processing
(a) Purified proteins of GST-tagged EED and Flag-tagged FBL were subjected to GST pull down assay, followed by western blot analysis. (b) AlphaLISA cross-titration assay to determine the optimal protein concentration combination of EZH2 and FBL. A hook point is reached at 30 nM GST-tagged EZH2 and 1 nM Myc-tagged FBL. (c) Representative fluorescence images of C4–2 cells with antibodies against endogenous EZH2 (Green) and FBL (Red). The nuclei were visualized by DAPI (Scale bar: 20 μm). Arrows indicate the enrichment of EZH2 signals in the nucleolus. (d) Graph showing the immunoactivity values based on the PLA results from four PCa types. Data represent Mean ± SD from 38 samples in NHT Naïve group, 24 sample in NHT treated group, 42 samples in CRPC group and 43 samples in NEPC group. Statistical significance was determined by One-way ANOVA. (e) Representative confocal images of immunofluorescence staining of C4–2 cells with antibodies against FBL (Green) and H2AQ104me1 (Red). Nuclei were stained with DAPI. Scale bars: 20 μm. (f) Co-IP assay using anti-FBL antibody showing binding of endogenous FBL with histone H2A. (g) Northern blot of RNA from C4–2 cells upon FBL or EZH2 suppression. The 30S and 18SE processing intermediates were detected using the ITS-1 probe while the 18S rRNA and U1 snRNA were hybridized by their corresponding probes. The assays in a-c and e-g have been performed three times with similar results. Statistical source data and unprocessed blots are provided in Source data Extended data Fig. 1.
Extended Data Fig. 2
Extended Data Fig. 2. EZH2 modulates rRNA 2′-O-Me by interacting with FBL
(a) RTL-P assay to detect the 2′-O-Me level in 12 areas in rRNA. Total RNAs were extracted and subjected to reverse transcription (RT) with RT primer at low (1 μM) or high (1 mM) concentration of dNTP, respectively. The obtained cDNA was then amplified with primer pairs corresponding to upstream (Um) or downstream (Dm) regions of specific methylation site(s). This assay has been performed three times with similar results. (b) Densitometric analysis of data from a were shown as signal intensity ratio of PCR products at low dNTP (1 μM) over high dNTP (1 mM) level. Methylation levels in control cells were set close to 1. Data represent Mean ± SD from n=3 biologically independent experiments. (c-e) For the 87 sites in which the 2′-O-Me level was significantly decreased upon EZH2 inhibition (detailed information provided in Supplementary Table 1), the MethScore obtained in control C4–2 cells was subtracted from the one in EZH2-deficient C4–2 cells. Sites are shown in order of increasing difference in MethScore for the 18S (c), 5.8S (d), and 28S (e) rRNAs. Data represent Mean ± SD from n=4 biologically independent experiments. (f, g) Translation efficiency of firefly (f) and renilla luciferase (g) reporters was evaluated as the ratio of luciferase activity over mRNA levels. Luciferase activities were detected by dual-luciferase assay using a bi-cistronic luciferase reporter construct as shown above, while the luciferase mRNA levels were measured by RT-qPCR assay. Data represent Mean ± SD from n=3 biologically independent experiments. (h) The Poliovirus (PV) IRES activity was calculated as the ratio of firefly luciferase activity over renilla luciferase activity. Data represent Mean ± SD from n=4 biologically independent experiments. For all relevant panels, unless otherwise stated, statistical significance was determined by two-tailed Student’s t-test. Statistical source data and unprocessed blots are provided in Source data Extended data Fig. 2.
Extended Data Fig. 3
Extended Data Fig. 3. EZH2 bridges FBL-NOP56 interaction by binding to both proteins
(a) Western blot analysis of FBL protein level in PCa cell lines upon EZH2 knockdown. (b) Western blot analysis of EZH2 and H3K27me3 levels in PCa cell lines upon FBL knockdown. (c) Equal amount of FBL protein in control and EZH2-deficient C4–2 cells were pulled down using anti-FBL antibody followed by western blot to detect its trimethyl-lysine (Kme3) level. (d) Co-IP of Nop56, Nop58 and Snu13 with Fbl in control and Ezh1/Ezh2 double-knockout XEN cells, followed by western blot analysis with indicated antibodies. Graph represents the relative Nop56 protein level coimmunoprecipitated with Fbl in each group. Data represent Mean ± SD (n=3 biologically independent measurements). Interaction intensity at control XEN group was set as 1. Statistical significance was determined by two-tailed Student’s t-test. (e) AlphaLISA cross-titration assay to determine the optimal protein concentration combination of FBL and NOP56. A hook point is reached at 3 nM His-tagged NOP56 and 30 nM Flag-tagged FBL. To achieve best results, a combination of 3 nM His-tagged NOP56 and 3 nM Flag-tagged FBL was used for the subsequent experiments. (f) AlphaLISA displacement assay showing that FBL-NOP56 interaction is unaffected by EED. Data represent Mean ± SD for n=3 biologically independent experiments. (g) After nucleolar isolation, proteins in each fraction were separated by SDS-PAGE and visualized by UV (upper panel). Distributions of EZH2, FBL (nucleolar marker), NOP56, FUS/TLS (nucleoplasmic marker) and β-actin (cytoplasmic marker) in each fraction were detected by western blot (lower panel). Wc: whole cells; CN: cytoplasm + nucleoplasm; No: nucleoli. (h) AlphaLISA cross-titration assay to determine the optimal protein concentration combination of Flag-tagged-EZH2 and GST-tagged-NOP56. A hook point is reached at 100 nM Flag-tagged-EZH2 and 1 nM GST-tagged-NOP56. (i) Co-IP of Myc-tagged FBL with full-length or truncation mutants of Flag-tagged NOP56. The assays in a-c, e and g-i have been performed three times with similar results. Statistical source data and unprocessed blots are provided in Source data Extended data Fig. 3.
Extended Data Fig. 4
Extended Data Fig. 4. EZH2 alters box C/D snoRNP assembly
(a) Mixtures of recombinant EZH2, FBL and NOP56 proteins with or without BS3 crosslinking were subjected to SDS-PAGE, followed by western blot analysis using their own antibodies to visualize the location of cross-linked species. (b) Gel band containing cross-linked proteins was subjected to Mass Spectrometry analyses to detect the presence of all three proteins. (c-f) Densitometric analysis of data from Fig. 4a were shown as distribution proportion of FBL (c)/NOP56 (d)/NOP58 (e)/SNU13 (f) protein in each fraction. (g) Fractions 17–19 and 27–29 from control C4–2 cell nuclear extracts were subjected to co-IP assay using anti-EZH2 antibody. The assays in a-b and g have been performed three times with similar results. Statistical source data and unprocessed blots are provided in Source data Extended data Fig. 4.
Extended Data Fig. 5
Extended Data Fig. 5. EZH2 regulates the translation process independently of its mRNA-binding capacities
(a) Representative Immunohistochemistry staining images of PCa TMA slides using the indicated antibodies (Abs). (b, c) Graph showing the relative nucleolar area (b) and nucleolar number (c) per cell by counting 60 cells from three TMA cores representing each group. The ends of box are the upper and lower quartiles and box spans the interquartile range. Median is marked by a vertical line inside the box and whiskers represent for the highest and lowest observations. NHT, neoadjuvant hormonal therapy; CRPC, castration-resistant PCa; NEPC, neuroendocrine PCa. (d) Global protein synthesis in control and EZH2-overexpressing C4–2 cells were detected by Puromycylation assay followed by western blot. Expression of β-actin was used as reference. (e, f) Venn diagram to show overlap between genes from “buffering” mode upon EZH2 or FBL deficiency. P values were calculated by one-tailed Fisher’s exact test. (g) KEGG pathway analysis of genes from “buffering” mode upon EZH2 or FBL deficiency. (h) GSEA analysis of genes bound by EZH2 to test their enrichment with TE changes after EZH2 knockdown. (i) Venn diagram to show overlap between genes from two TE-altered groups after EZH2 knockdown and EZH2 RNA binding targets in C4–2 cells. P values were calculated by one-tailed Fisher’s exact test. (j) Heatmap to show EZH2 RIP-seq and Input signals for TE-altered genes in EZH2-deficient C4–2 cells. (k) Representative genome browser tracks to show Ribo-seq, RNA-seq and public EZH2 RIP-seq data at the loci of TP53 (a known mRNA binding target of EZH2) and IFT81 (an identified TE-altered gene after EZH2 inhibition). For all relevant panels, unless otherwise stated, statistical significance was determined by two-tailed Student’s t-test. The assays in a and d have been performed three times with similar results. Statistical source data and unprocessed blots are provided in Source data Extended data Fig. 5.
Extended Data Fig. 6
Extended Data Fig. 6. EZH2 promotes XIAP IRES-dependent translation
(a) Heatmap to show TE changes for the top 30 IRES genes which underwent TE down-regulation after EZH2 inhibition, as revealed from gene set enrichment analysis (GSEA). (b) Western blot analysis of XIAP protein level upon FBL or EZH2 depletion in LNCaP, DU145, 22RV1 and VCaP cells. (c) RT-qPCR analysis of XIAP mRNA level upon FBL or EZH2 depletion in LNCaP, DU145, 22RV1 and VCaP cells. Data represent Mean ± SD from n=3 biologically independent experiments. (d) RT-qPCR analysis of XIAP mRNA level in C4–2 cells after treatment of various EZH2 inhibitors as indicated. Data represent Mean ± SD from n=3 biologically independent experiments. (e) CHX treatment assay was performed to monitor the degradation of XIAP protein in control, FBL-deficient and EZH2-deficient cells. The relative protein level is shown under the bands. (f) RT-qPCR analysis of XIAP mRNA level upon serum starvation in control, FBL-deficient and EZH2-deficient C4–2 cells. Data represent Mean ± SD from n=3 biologically independent experiments. For all relevant panels, unless otherwise stated, statistical significance was determined by two-tailed Student’s t-test. The assays in b and e have been performed three times with similar results. Statistical source data and unprocessed blots are provided in Source data Extended data Fig. 6.
Extended Data Fig. 7
Extended Data Fig. 7. Contributions of FBL and NOP56 in PCa tumorigenesis
(a) Wound healing assay was conducted to evaluate the migration potential of PC-3 cells after FBL depletion. The healing of wounded cell layer was monitored under a microscope every 24 h. Graph showing the rate of filling of the scratched area by cells. Data represent Mean ± SD from n=3 biologically independent experiments. The knockdown efficiency of FBL was validated by western blot. (b) Wound healing assay was conducted to evaluate the migration potential of PC-3 cells after NOP56 depletion. The healing of wounded cell layer was monitored under a microscope every 24 h. Graph showing the rate of filling of the scratched area by cells. Data represent Mean ± SD from n=3 biologically independent experiments. The knockdown efficiency of NOP56 was validated by western blot. (c, d) Boyden chamber invasion assay was performed to determine the invasive capability of PC-3 cells after FBL depletion (c) or NOP56 depletion (d). Graph showing the number of migrated cells passing through Matrigel at 24 h. Data represent Mean ± SD from n=5 random fields per filter. (e, f) Tumor formation in nude mice injected with control, FBL-deficient or NOP56-deficient PC-3 cells. The images of xenograft tumors at the end point of measurement were shown in e. Tumor volume was measured by caliper twice a week and plotted in f. Data represent Mean ± SD from n=8 tumors in each group. Statistical significance was determined by two-way ANOVA. For all relevant panels, unless otherwise stated, statistical significance was determined by two-tailed Student’s t-test. Statistical source data and unprocessed blots are provided in Source data Extended data Fig. 7.
Extended Data Fig. 8
Extended Data Fig. 8. Model of the implication of EZH2 in control of gene expression
EZH2 plays a dual-role to regulate gene expression. On one hand, EZH2 inhibits DNA transcription by catalyzing H3K27me3 marks in a PRC2-dependent manner; On the other hand, EZH2 activates mRNA translation by enhancing the functionality of FBL through a non-lysine methyltransferase role. Hence, EZH2 could exert its oncogenic functions by coordination of transcriptional inhibition (i.e., tumor suppressors) and promotion of translation (i.e., pro-oncogenic, anti-apoptotic, and survival proteins) during cancer progression.
Figure 1.
Figure 1.. EZH2 directly interacts with FBL in PCa cells and tissues
(a, b) C4–2 cells were lysed and subjected to co-IP assay using anti-EZH2 (a) or anti-FBL antibody (b), followed by western blot analysis with indicated antibodies. Rabbit IgG was set as a negative control. (c, d) PCa PDX LuCaP 35CR tissues were lysed and subjected to co-IP assay using anti-EZH2 (c) or anti-FBL antibody (d), followed by western blot analysis with indicated antibodies. Rabbit IgG was set as a negative control. (e) Purified proteins of GST-tagged EZH2 and Flag-tagged FBL were subjected to GST pull down assay, followed by western blot analysis with indicated antibodies. (f) Inhibition of GST-tagged EZH2 and Myc-tagged FBL binding by unlabeled FBL in AlphaLISA displacement assay. Data represent Mean ± SD for n=3 biologically independent experiments. (g) Image of Proximity Ligation Assay showing an interaction between EZH2 and FBL in PDX tumor. Positive staining corresponds to immunoperoxidase staining (brown dots marked by arrows). Scale bar=60 μm. (h) Representative images of Proximity Ligation Assay showing an interaction between EZH2 and FBL in different types of PCa tissues. Positive staining corresponds to immunoperoxidase staining (brown dots marked by arrows). Scale bar=50 μm. (i) Domain organization of EZH2 protein and its truncation mutants. The homology domain 1 (H1) contains WDB domain, while the homology domain 2 (H2) contains the first SANT domain. (j) Domain organization of FBL protein and its truncation mutants. (k) Co-IP of Flag-tagged FBL with full-length or truncation mutants of Myc-tagged EZH2, followed by western blot analysis with indicated antibodies. (l) Co-IP of Myc-tagged EZH2 with full-length or truncation mutants of Flag-tagged FBL, followed by western blot analysis with indicated antibodies. The assays in a-e, g-h and k-l have been performed three times with similar results. Statistical source data and unprocessed blots are provided in Source data Fig. 1.
Figure 2.
Figure 2.. EZH2 modulates rRNA 2′-O-Me by interacting with FBL
(a) The 2′-O-Me levels of adenosine (A) and guanosine (G) in total RNA were quantified by LC-MS/MS. Data represent Mean ± SD from n=3 biologically independent experiments. Am: 2′-O methylated adenosine; Gm: 2′-O methylated guanosine. (b) Rescue assay showing that ectopic expression of full-length EZH2 or EZH2ΔSET, but not EZH2ΔCXC, restored the 2′-O-Me levels in EZH2-deficient cells, as measured by LC-MS/MS. Data represent Mean ± SD from n=3 biologically independent experiments. (c) RTL-P assay to detect the 2′-O-Me level in rRNA. Total RNAs were subjected to reverse transcription (RT) with RT primer at low (1 μM) or high (1 mM) concentration of dNTP, respectively. The obtained cDNA was then amplified with primer pairs corresponding to upstream (Um) or downstream (Dm) regions of specific methylation site(s). This assay has been performed three times with similar results. (d) Densitometric analysis of data from c were shown as signal intensity ratio of PCR products at low dNTP (1 μM) over high dNTP (1 mM) level. Methylation levels in control cells were set close to 1. Data represent Mean ± SD from n=3 biologically independent experiments. (e-g) MethScore values for each 2′-O methylated nucleotide in 18S (e), 5.8S (f) and 28S (g) rRNAs from control and EZH2-deficient C4–2 cells. MethScore is equal to the ratio of 2′-O-Me at each modified nucleotide. Data represent Mean ± SD from n=3 biological replicates for control cells and n=4 for EZH2-deficient cells. The detailed results were shown in Supplementary Table 1. (h) Each of the indicated reporter plasmids was transfected into C4–2 cells and IRES-dependent translation (Fluc/Rluc) from IRES elements of six cancer-relevant genes was measured through dual-luciferase assay. Data represent Mean ± SD from n=4 biologically independent experiments. (i) RNA was transcribed in vitro from each of the indicated plasmids and transfected into C4–2 cells, followed by dual-luciferase assay. Data represent Mean ± SD from n=4 biologically independent experiments. For all relevant panels, unless otherwise stated, statistical significance was determined by two-tailed Student’s t-test. Statistical source data and unprocessed blots are provided in Source data Fig. 2.
Figure 3.
Figure 3.. EZH2 bridges FBL-NOP56 interaction by binding to both proteins
(a) Co-IP of box C/D snoRNP components NOP56, NOP58 and SNU13 with FBL in control and EZH2-deficient C4–2 cells, followed by western blot analysis with indicated antibodies. Graph represents the relative NOP56 protein level coimmunoprecipitated with FBL in each group. Data represent Mean ± SD (n=3 biologically independent measurements). Interaction intensity at control group was set as 1. Statistical significance was determined by two-tailed Student’s t-test. (b) AlphaLISA displacement assay showing that FBL-NOP56 interaction is strengthened by EZH2. Data represent Mean ± SD for n=3 biologically independent experiments. (c, d) PDX tissues were lysed and subjected to co-IP assay using anti-EZH2 (c) or anti-NOP56 (d) antibody, followed by western blot analysis with indicated antibodies. Rabbit IgG was set as a negative control. (e-g) Purified nucleoli (No) from C4–2 cells were lysed and subjected to co-IP assay using anti-EZH2 (e), anti-FBL (f) or anti-NOP56 antibody (g), followed by western blot analysis with indicated antibodies. Rabbit IgG was set as a negative control. (h) Purified proteins of GST-tagged EZH2 and His-tagged NOP56 were subjected to GST pull down assay, followed by western blot analysis with indicated antibodies. (i) Inhibition of GST-tagged NOP56 and Flag-tagged EZH2 binding by unlabeled NOP56 in AlphaLISA displacement assay. Data represent Mean ± SD for n=3 biologically independent experiments. (j) Co-IP of NOP56 with EZH2 in control and FBL-deficient C4–2 cells, followed by western blot analysis with indicated antibodies. (k) Co-IP of FBL with EZH2 in control and NOP56-deficient C4–2 cells, followed by western blot analysis with indicated antibodies. (l) Co-IP of Flag-tagged NOP56 with full-length or truncation mutants of Myc-tagged EZH2, followed by western blot analysis with indicated antibodies. (m) Domain organization of NOP56 protein and its truncation mutants. (n) Co-IP of Myc-tagged EZH2 with full-length or truncation mutants of Flag-tagged NOP56, followed by western blot analysis with indicated antibodies. The assays in c-h, j-l and n have been performed three times with similar results. Statistical source data and unprocessed blots are provided in Source data Fig. 3.
Figure 4.
Figure 4.. Formation of EZH2-FBL-NOP56 trimer facilitates box C/D snoRNP assembly
(a) Nuclear extracts from control and EZH2-deficient C4–2 cells were subjected to size-exclusion and the protein levels of FBL, NOP56, NOP58 and SNU13 were determined by western blot analysis in all samples. Protein distributions of EZH2 and SUZ12 in control cells were also detected as references. This assay has been performed three times with similar results. (b) RIP-qPCR assay to monitor the binding of snoRNAs to FBL in control and EZH2-deficient C4–2 cells. Data represent Mean ± SD from n=3 biologically independent experiments. U1 snRNA, which is not a binding target of FBL, was used as a control. (c, d) Representative fluorescence images of C4–2 cells expressing GFP-EZH2 or GFP-EZH2ΔCXC. The nucleoli were co-stained using anti-FBL antibody followed by an Alexa Fluor 555-conjugated secondary antibody and the nuclei were visualized by DAPI (Scale bar: 10 μm). Graph represents the nucleolar proportion of EZH2 estimated by the ratio of nucleolar GFP intensity to nuclear GFP intensity of individual cells (Mean ± SD, n=20 cells analyzed over 3 independent experiments). (e, f) Representative fluorescence images of C4–2 cells expressing GFP-EZH2 or GFP-EZH2ΔSANT2. The nucleoli were co-stained using anti-NOP56 antibody followed by an Alexa Fluor 555-conjugated secondary antibody and the nuclei was visualized by DAPI (Scale bar: 10 μm). Graph represents the nucleolar proportion of EZH2 estimated by the ratio of nucleolar GFP intensity to nuclear GFP intensity of individual cells (Mean ± SD, n =20 cells analyzed over 3 independent experiments). (g) Schematic diagram of EZH2-FBL-NOP56 trimer. For all relevant panels, unless otherwise stated, statistical significance was determined by two-tailed Student’s t-test. Statistical source data and unprocessed blots are provided in Source data Fig. 4.
Figure 5.
Figure 5.. EZH2 regulates the translation process in a positive manner
(a) Representative Immunohistochemistry staining images of PCa TMA slides using indicated antibodies (Abs). (b, c) Graph showing the relative nucleolar area (b) and nucleolar number (c) per cell by counting 60 cells from three TMA cores representing each group. The ends of box are upper and lower quartiles and box spans the interquartile range. Median is marked by a vertical line inside the box and whiskers represent for the highest and lowest observations. NHT, neoadjuvant hormonal therapy; CRPC, castration-resistant PCa; NEPC, neuroendocrine PCa. (d) Representative electron micrographs showing nucleolus in control or EZH2-deficient C4–2 cells (Scale bar: 2 μm). Arrows indicate nucleoli. (e) Global protein synthesis in control and EZH2-deficient C4–2 cells were detected by Puromycylation assay followed by western blot. Expression of β-actin was used as reference. (f-i) Scatter plot to show expression changes of mRNA levels and RPFs between control and EZH2-deficient C4–2 cells (f) or FBL-deficient C4–2 cells (h). Genes were colored according to their regulation mode defined by anota2seq. A threshold of absolute fold change (FC) > 1.2, P < 0.05 was used. Box plots of g and i showed the log2 fold change (Log2FC) of the mRNA, RPF and TE in f and h, respectively. The ends of the box are the upper and lower quartiles and the box spans the interquartile range. The median is marked by a vertical line inside the box and the whiskers represent for 1.5x inter-quartile range. P values were calculated by two-tailed Wilcoxon rank-sum test. A threshold of the absolute Log2FC >0.3, P <0.05 was used. (j, k) Venn diagram to show overlap between genes from “translation” mode upon EZH2 or FBL deficiency. P values were calculated by one-tailed Fisher’s exact test. (l) GO enrichment analysis of genes from “translation” mode upon EZH2 or FBL deficiency. For all relevant panels, unless otherwise stated, statistical significance was determined by two-tailed Student’s t-test. The assays in a and e have been performed three times with similar results. Statistical source data and unprocessed blots are provided in Source data Fig. 5.
Figure 6.
Figure 6.. EZH2 promotes XIAP IRES-dependent translation
(a) GSEA analysis using a list of 656 IRES genes showed a negative enrichment of putative IRES genes associated with the TE changes after EZH2 knockdown. (b) Cytoplasmic polysome patterns of control, FBL-deficient and EZH2-deficient C4–2 cells were denoted. (c) Quantification of the ratio of polysomes to the monosomes (80S). Data represent Mean ± SD from n=3 biologically independent experiments. (d-f) Quantification of the ratio of polysomal-bound XIAP (d), MYC (e) and IGF1R (f) mRNA to the total cytoplasmic mRNA of their own. Data represent Mean ± SD from n=3 biologically independent experiments. (g) Representative genome browser tracks to show Ribo-seq, RNA-seq and public EZH2 RIP-seq data around the XIAP locus. The normalized Ribo-seq and RNA-seq signals at 5′ upstream of XIAP gene were labeled on the left of each gene track. (h) Western blot analysis of XIAP protein level upon FBL or EZH2 depletion in C4–2 and PC-3 cells. (i) RT-qPCR analysis of XIAP mRNA level upon FBL or EZH2 depletion in C4–2 and PC-3 cells. Data represent Mean ± SD from n=3 biologically independent experiments. (j) Western blot analysis of XIAP protein level in C4–2 cells after treatment of various EZH2 inhibitors as indicated. (k) Serum starvation assay followed by western blot to detect the induction of XIAP expression in control, FBL-deficient and EZH2-deficient C4–2 cells. (l) Rescue assay showing that ectopic expression of EZH2ΔSET, but not EZH2ΔSANT2 or EZH2ΔCXC, restored induction of XIAP expression in EZH2-deficient cells, as measured by western blot. It is noted that the EZH2ΔSANT2 mutant could not be detected by anti-EZH2 antibody used here since this antibody targets to residues in SANT2 domain specifically. For all relevant panels, unless otherwise stated, statistical significance was determined by two-tailed Student’s t-test. The assays in h and j-l have been performed three times with similar results. Statistical source data and unprocessed blots are provided in Source data Fig. 6.
Figure 7.
Figure 7.. Contributions of FBL and NOP56 in EZH2-driven PCa tumorigenesis
(a, b) Comparison of FBL (a) or NOP56 (b) mRNA levels in PCa patient samples with different Gleason grades using JHMI cohort. The ends of the box are the upper and lower quartiles and the box spans the interquartile range. The median is marked by a vertical line inside the box and the whiskers represent for 1.5x interquartile range. The significance of trend was calculated by two-sided Kruskal-Wallis test. ‘n’ represents the number of patients included in the analyses. (c, d) The association between FBL (c) or NOP56 (d) expression and metastasis-free survival time of PCa patients was analyzed by Kaplan–Meier analysis using JHMI cohort. For each group, the number of patients remained at each time-point was indicated. (e, f) The association between EZH2 expression and survival time of PCa patients with high FBL expression (e) or low FBL expression (f) was analyzed by Kaplan-Meier analysis using TCGA dataset. ‘n’ represents the number of patients included in the analyses. (g, h) The association between EZH2 expression and survival time of PCa patients with high NOP56 expression (g) or low NOP56 expression (h) was analyzed by Kaplan-Meier analysis using TCGA dataset. ‘n’ represents the number of patients included in the analyses. (i, j) IC50 shift assay showing the IC50 curve of EZH2 inhibitors DZNep (i) and GSK126 (j) in control or FBL-deficient C4–2 cells. Data represent Mean ± SD from n=6 biologically independent experiments. (k, l) IC50 shift assay showing the IC50 curve of EZH2 inhibitors DZNep (k) and GSK126 (l) in control or NOP56-deficient C4–2 cells. Data represent Mean ± SD from n=6 biologically independent experiments. (m) Cell viability assay was used to assess the proliferative capacity of EZH2-deficient C4–2 cells overexpressing full-length or truncated EZH2. Data represent Mean ± SD from n=3 biologically independent experiments. Statistical significance was determined by two-tailed Student’s t-test. (n) Schematic diagram depicting two distinctive functions of EZH2 during cancer development. PCa, prostate cancer; MTase, methyltransferase. Statistical source data are provided in Source data Fig. 7.

References

    1. Pelletier J, Thomas G & Volarevic S Ribosome biogenesis in cancer: new players and therapeutic avenues. Nature reviews. Cancer 18, 51–63 (2018). - PubMed
    1. Polikanov YS, Melnikov SV, Soll D & Steitz TA Structural insights into the role of rRNA modifications in protein synthesis and ribosome assembly. Nature structural & molecular biology 22, 342–344 (2015). - PMC - PubMed
    1. Sharma S & Lafontaine DLJ ‘View From A Bridge’: A New Perspective on Eukaryotic rRNA Base Modification. Trends in biochemical sciences 40, 560–575 (2015). - PubMed
    1. Monaco PL, Marcel V, Diaz JJ & Catez F 2’-O-Methylation of Ribosomal RNA: Towards an Epitranscriptomic Control of Translation? Biomolecules 8 (2018). - PMC - PubMed
    1. Massenet S, Bertrand E & Verheggen C Assembly and trafficking of box C/D and H/ACA snoRNPs. RNA biology 14, 680–692 (2017). - PMC - PubMed

Publication types

MeSH terms