. 2021 May;6(5):672-681.
doi: 10.1038/s41564-021-00882-3. Epub 2021 Apr 1.

Detection of respiratory syncytial virus defective genomes in nasal secretions is associated with distinct clinical outcomes

Affiliations

Detection of respiratory syncytial virus defective genomes in nasal secretions is associated with distinct clinical outcomes

Sébastien A Felt et al. Nat Microbiol. 2021 May.

Abstract

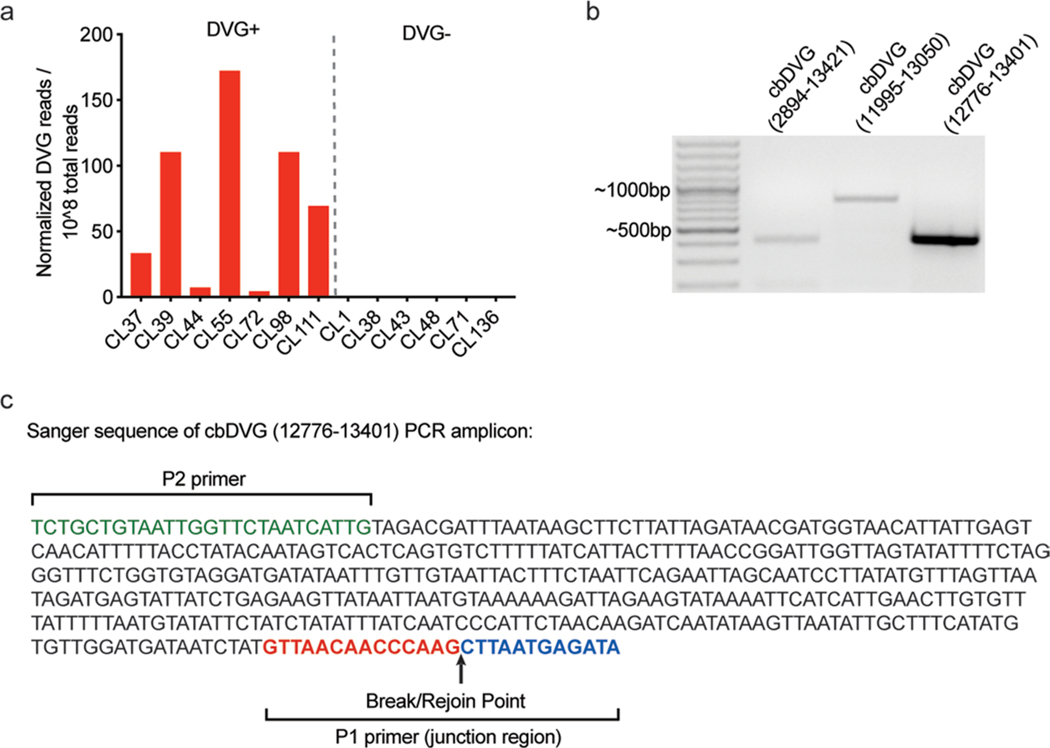
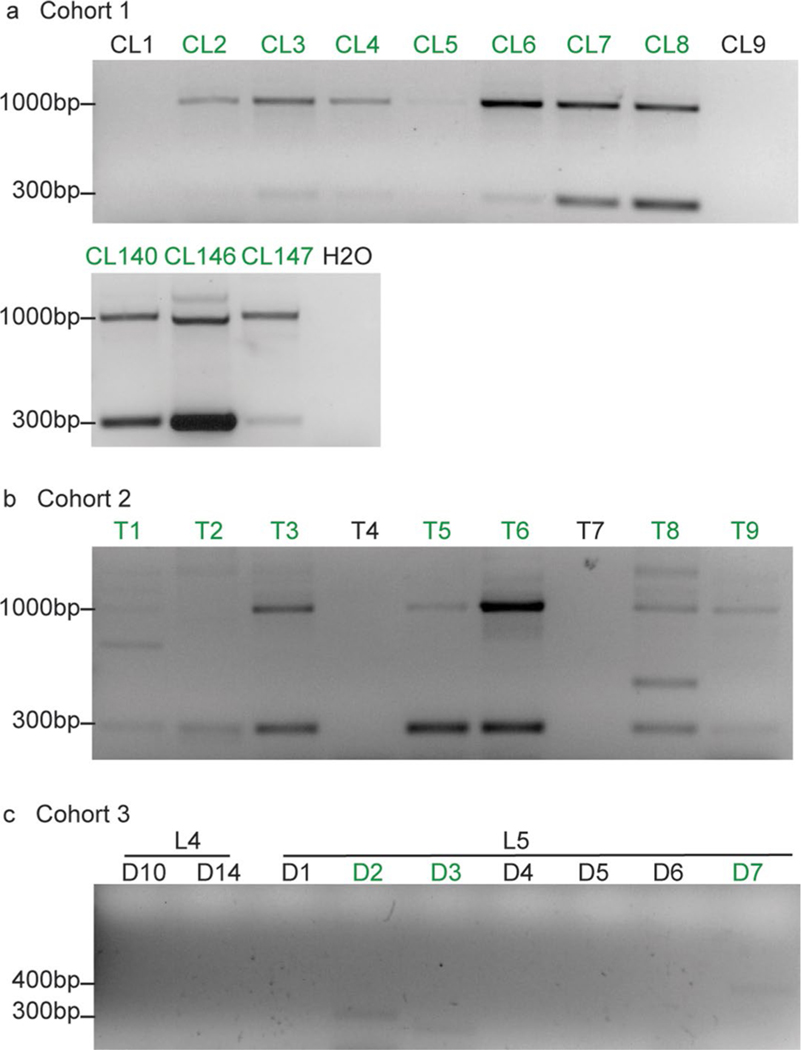
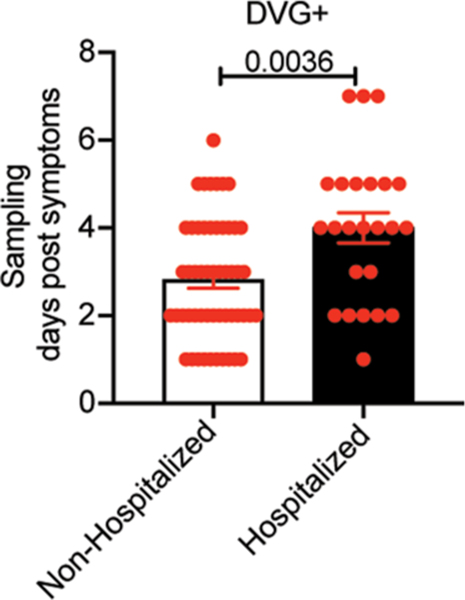
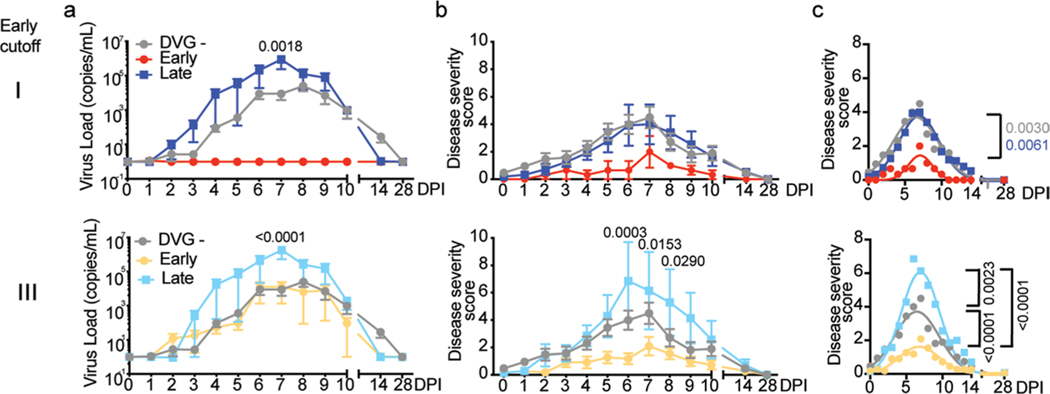
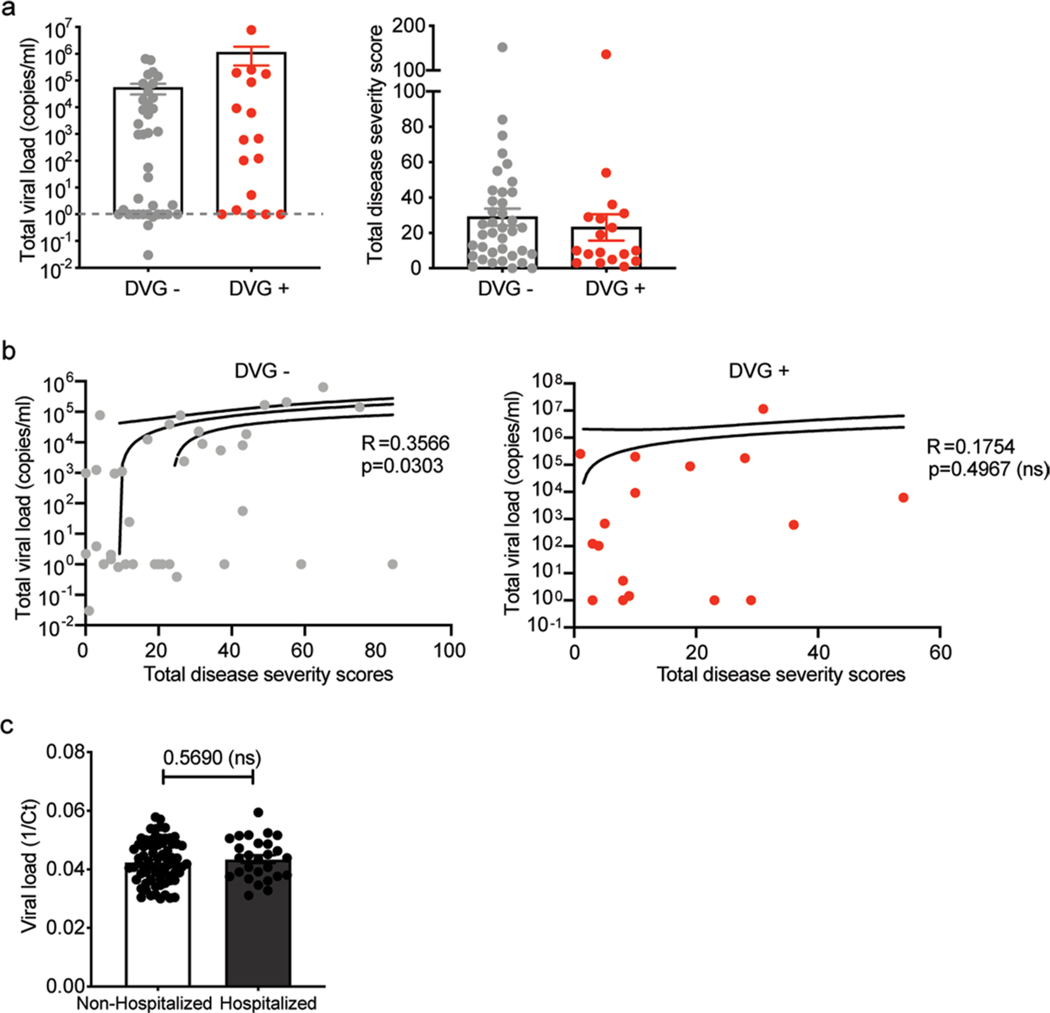
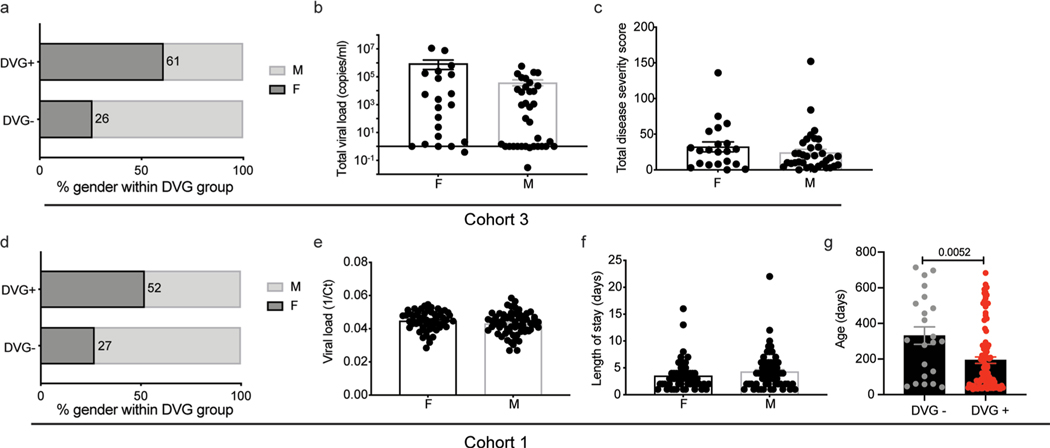
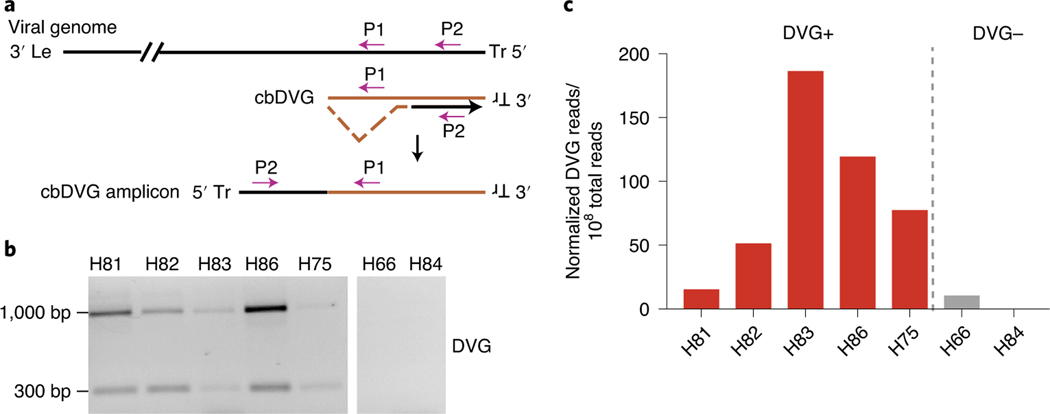
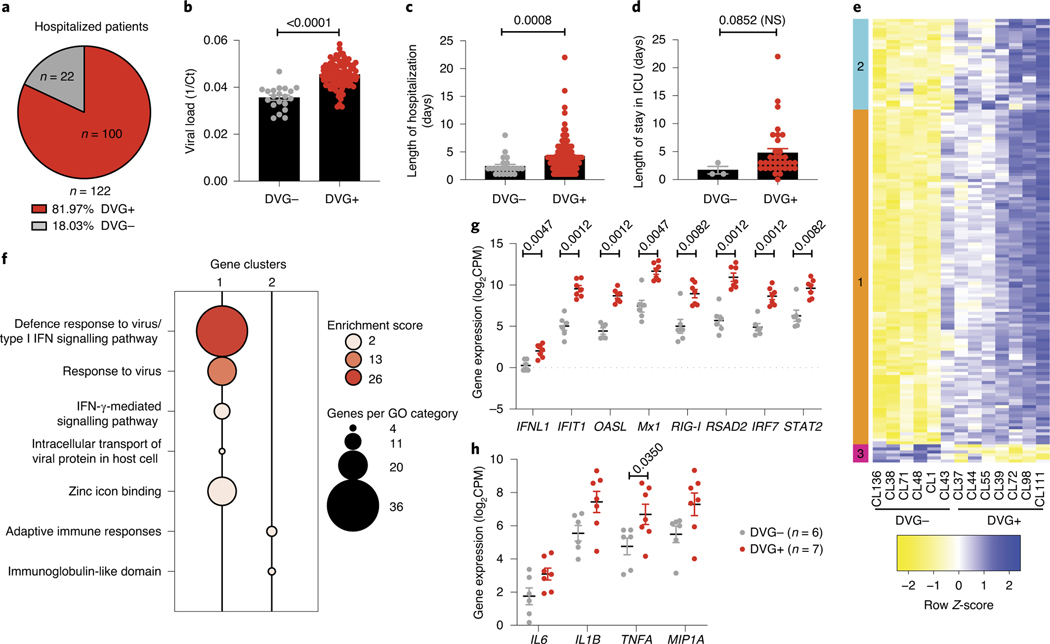
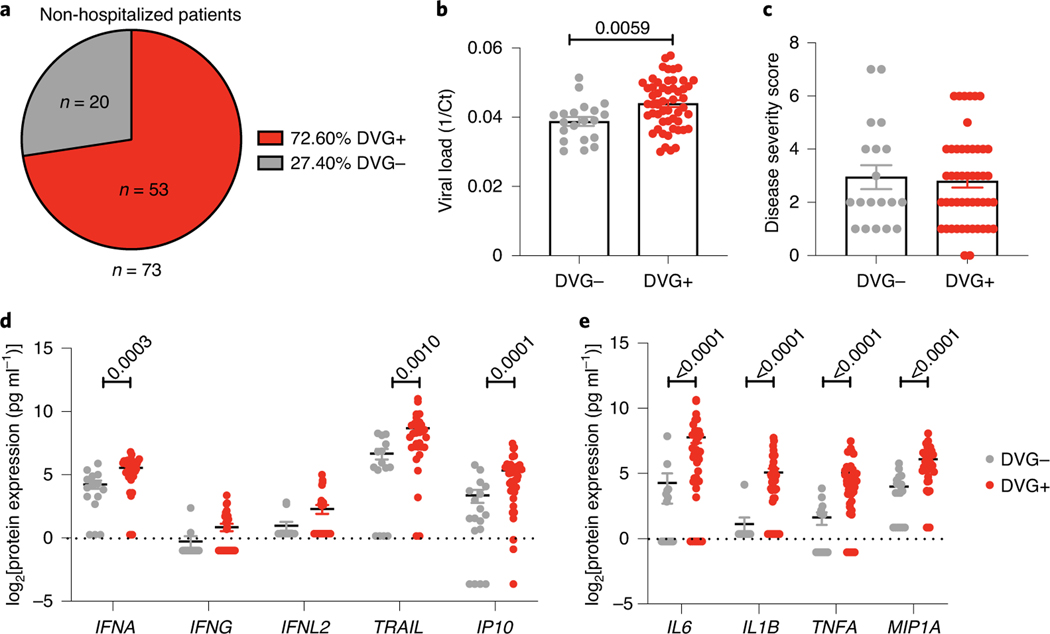
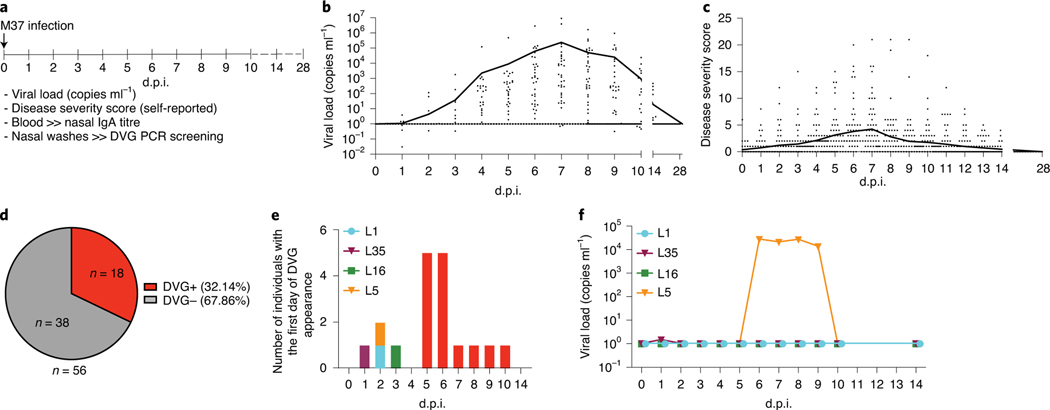
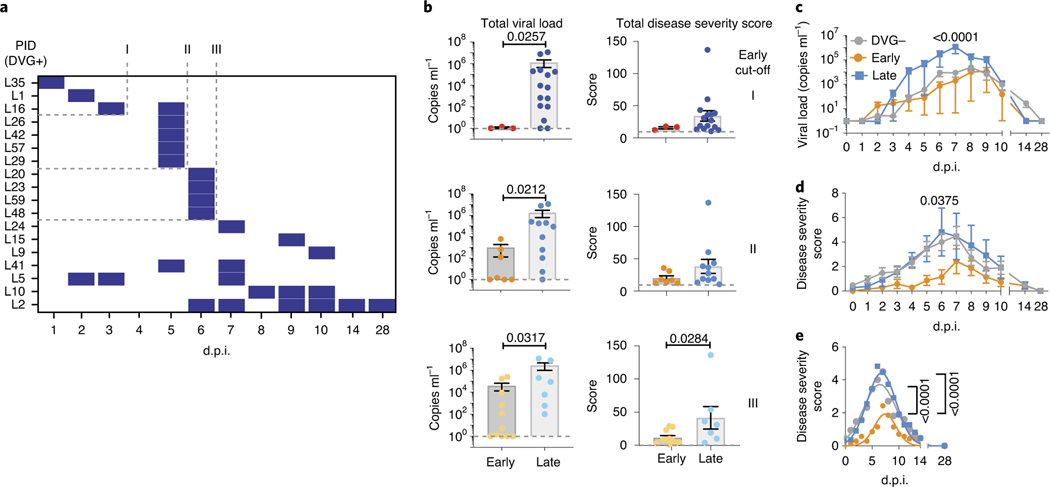
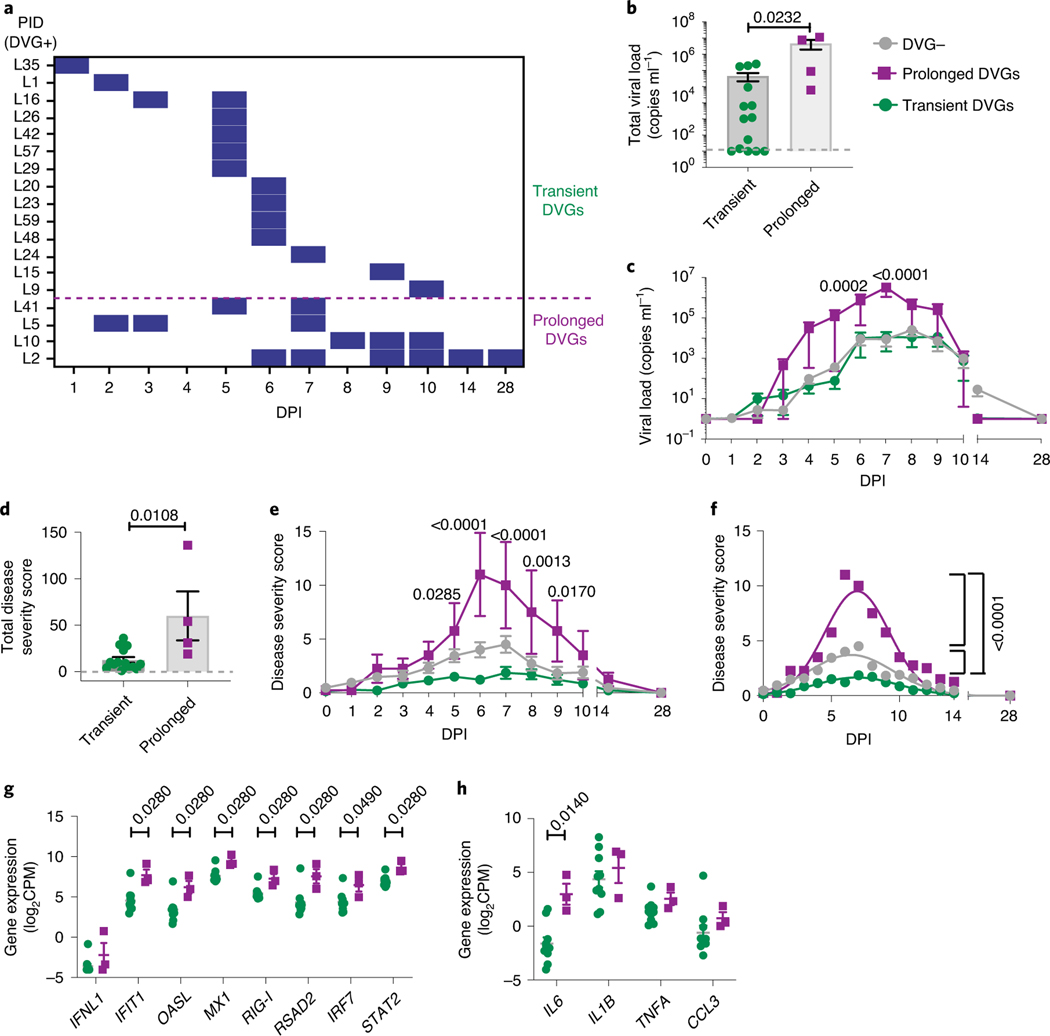
Respiratory syncytial virus (RSV) causes respiratory illness in children, immunosuppressed individuals and the elderly. However, the viral factors influencing the clinical outcome of RSV infections remain poorly defined. Defective viral genomes (DVGs) can suppress virus replication by competing for viral proteins and by stimulating antiviral immunity. We studied the association between detection of DVGs of the copy-back type and disease severity in three RSV A-confirmed cohorts. In hospitalized children, detection of DVGs in respiratory samples at or around the time of admission associated strongly with more severe disease, higher viral load and a stronger pro-inflammatory response. Interestingly, in experimentally infected adults, the presence of DVGs in respiratory secretions differentially associated with RSV disease severity depending on when DVGs were detected. Detection of DVGs early after infection associated with low viral loads and mild disease, whereas detection of DVGs late after infection, especially if DVGs were present for prolonged periods, associated with high viral loads and severe disease. Taken together, we demonstrate that the kinetics of DVG accumulation and duration could predict clinical outcome of RSV A infection in humans, and thus could be used as a prognostic tool to identify patients at risk of worse clinical disease.


Figures

Extended Data Fig. 1 |
Extended Data Fig. 1 |. Confirmation of rT-PCr and rNA-seq/VoDKA methods with paediatric patient samples.
a, Thirteen hospitalized paediatric patients from cohort 1 were divided into 2 groups based of PCR screening: DVG PCR+ (left) and DVG PCR- (right). DVG reads identified for each patient using the RNA-seq/VODKA pipeline were normalized to 108 total reads. b, Specific primers for unique cbDVG junction regions were designed based on cbDVG sequences identified by RNA-seq/VODKA in sample H75. The numbers in parenthesis indicate break and rejoin positions targeted by the primers in sample H75. Amplicons were of the expected sizes (left to right: 417bp, 804bp and 436bp). c, cbDVG band from sample H75 12776–13401 was gel extracted and confirmed by Sanger’s sequencing. P2 primer sequence is labeled in green and P1 primer sequence (spanning the junction region) is labeled in red and blue to show break/rejoin point.
Extended Data Fig. 2 |
Extended Data Fig. 2 |. representative DNA gel pictures of Cohorts 1, 2 and 3.
Positive PCR results were marked in green. H2O was added as a negative control for each PCR as shown in (a). a, same results were observed for all samples for two independent repeats. b, same results were observed for most samples for 4 independent repeats. T1, T2, T4 and T7 were positive 2, 3, 1 and 1 time out of 4 total repeats, respectively. c, same results were observed for most samples for two independent repeats. D3 and D7 were positive 1 time out of 4 total repeats.
Extended Data Fig. 3 |
Extended Data Fig. 3 |. cbDVg+ patients in the non-hospitalized group were sampled earlier than that in the hospitalized group.
In Cohort 2, there are 73 non-hospitalized patients and 27 hospitalized patients. Days post the onset of symptoms were recorded at the time of sampling. Within cbDVG+ patients, days post the onset of symptoms was compared between non-hospitalized group and hospitalized group. Data are shown as mean±SEM. Significance upon two-tailed Mann-Whitney test.
Extended Data Fig. 4 |
Extended Data Fig. 4 |. Cut off i and iii for early appearance of cbDVgs were also associated with lower viral loads and disease severity scores in experimentally infected subjects.
Kinetics of viral load (a) and disease severity score (b) among negative (n=38), Early (cutoff I n=3; cutoff III n=11), and Late (cutoff I n=15; cutoff III n=7) groups were compared. Data are plotted over time and trendline represents mean±SEM. Significant P value for two-way ANOVA with Bonferroni post hoc test are indicated for Early vs Late groups. Best-fit curves for kinetics of disease severity scores from negative, Early, and Late groups were calculated using nonlinear Gaussian model (c). The best-fit values for amplitude of the negative, Early and Late group curves were compared.
Extended Data Fig. 5 |
Extended Data Fig. 5 |. Viral load is not the sole viral factor that impact rSV disease severity.
a, Total viral load and total disease severity score were compared between cbDVG+ (n=18) and cbDVG- (n=38) individuals in Cohort 3. Data are shown as mean±s.e.m. b, Total viral load and total disease severity scores were correlated within cbDVG+ (n=17) and cbDVG- (n=37) group separately in Cohort 3. One outlier in each group was eliminated upon testing using Grubbs’ test in Prism. P value was tested from the correlation between total clinical scores and viral load using nonparametric spearman correlation. Dashed line represent the 95% confidence for the slopes. c, In Cohort 2, viral load was compared between non-hospitalized (n=73) and hospitalized (n=27) individuals. Data are shown as mean±s.e.m. No significance upon two-tailed Mann-Whitney test.
Extended Data Fig. 6 |
Extended Data Fig. 6 |. impact of sex and age on cbDVg generation in different cohorts.
In Cohort 3, a, the percentage of female and male patients within the cbDVG+ (11:7 ratio) and cbDVG- (10:28 ratio) groups were compared with the percentage of female subjects shown within the bars. (b-c) showing the comparison of viral load (b) and disease severity (c) between females (n=21) and males (n=35). Data are shown as mean±s.e.m. In Cohort 1, (d) the percentage of female and male patients within the cbDVG+ (52:48 ratio) and cbDVG- (6:16) groups were compared with the percentage of female subjects shown within the bars. (e-f) showing the comparison of viral load (e) and length of stay (f) between females (n=56, n=58) and males (n=62, n=64). Data are shown as mean±s.e.m. g, Age was compared between cbDVG+ (n=100) and cbDVG- (n=22) patients. Data are shown as mean±s.e.m. Significance upon Mann-Whitney test.
Fig. 1 |
Fig. 1 |. cbDVg screening methods and sensitivity.
a, Scheme of the PCR strategy for cbDVG detection. Le: leader sequence on the 3′-untranslated region (UTR) of the viral genome; Tr: trailer sequence on the 5′ UTR of the viral genome; P1: specific primer used in both reverse transcription and PCR; P2: specific primer used only during PCR. b, Representative PCR results for seven paediatric samples. Five cbDVG-positive and two cbDVG-negative samples are shown. c, Graph of cbDVG reads normalized to 108 total reads obtained from our RNA-seq/VODKA pipeline.
Fig. 2 |
Fig. 2 |. cbDVg+ hospitalized paediatric patients have higher viral load and more severe clinical outcomes.
a, Pie chart showing percentages and actual numbers of cbDVG+ and cbDVG− patients in hospitalized paediatric Cohort 1. bd, Viral load (b), length of hospitalization (c) and ICU days (d) were compared in patients with (n = 100, red) and without cbDVGs (n = 22, grey). Viral load was determined by Ct values from qPCR and is plotted as 1/Ct. Disease severity was determined by the length of hospitalization. Data are shown as mean ± s.e.m. Thirteen samples were used to perform RNA-seq to examine their transcriptional profiling. e, Hierarchical clustering and heatmap representation of differential expressed genes between cbDVG− and cbDVG+ patients. Colour based on row Z-score. Clusters 1 and 2 indicate the genes that were upregulated in cbDVG+ patients and cluster 3 indicates the genes that were downregulated in cbDVG+ patients. f, Bubble chart showing Gene Ontology (GO) enrichment analysis. Bubble size indicates the number of genes associated with each term. Bubble colour intensity indicates the enrichment score of GO terms overrepresented in that cluster of genes. Cluster 3 did not have any GO categories with an enrichment score above 2. g, Scattered dot plots showing expression of IFNL1 and representative interferon-stimulated genes (ISGs). h, Scattered dot plots showing representative pro-inflammatory cytokines from cbDVG− (n = 6; grey) and cbDVG+ (n = 7; red) hospitalized paediatric patients. Data are shown as mean ± s.e.m. Significant P values for two-tailed Mann–Whitney test are indicated. IFN, interferon; CPM, counts per million.
Fig. 3 |
Fig. 3 |. cbDVg+ non-hospitalized paediatric patients do not have worse respiratory disease than cbDVg− patients.
a, Pie chart showing the percentage and actual number of cbDVG+ and cbDVG− patients among non-hospitalized paediatric patients detected by PCR. b,c, In the 73 non-hospitalized infants, viral load (b) and disease severity score (c) were compared in patients with (n = 53, red) and without cbDVGs (n = 20, grey). Viral load was determined by Ct values from RT–qPCR and is plotted as 1/Ct. d,e, Scattered dot plots showing (d) expression of IFNA and representative ISGs and (e) representative pro-inflammatory cytokines from cbDVG− (n = 15–18; grey) and cbDVG+ (n = 30–41; red) non-hospitalized paediatric patients. Data are shown as mean ± s.e.m. Significant P values for two-tailed Mann–Whitney test are indicated.
Fig. 4 |
Fig. 4 |. cbDVg appearance is independent of viral load.
a, Study design of Cohort 3. Healthy adult volunteers were experimentally infected with RSV A M37. Disease severity, viral load, nasal IgA titre and nasal washes were analysed for all indicated time points. b,c, Each data point represents the (b) viral load or (c) disease severity score of individual participants at designated days post infection. The black lines connect the daily mean value for all patients. Viral load was examined by RT–qPCR and absolute quantification was calculated using a plasmid DNA standard curve (Methods). All ‘0’ viral load values were replaced with ‘1’ for graphing in the log scale. d, cbDVG PCR was performed to determine cbDVG presence or absence in nasal washes. The pie chart indicates the percentage and actual number of cbDVG+ and cbDVG− patients in this cohort. e, Graphical representation of the number of individuals with first day of cbDVG detection at the indicated day post inoculation (d.p.i.). Red colour represents the individuals with the first day of cbDVG detection after day 4 post inoculation. Coloured bars indicate the individuals with cbDVGs detection before day 4. f, Kinetics of viral load in the four individuals with first cbDVG detection before day 4 post inoculation.
Fig. 5 |
Fig. 5 |. Early appearance of cbDVgs associates with lower viral loads and disease severity scores in experimentally infected subjects.
a, Criteria for early cbDVG appearance and clearance. The heatmap indicates the time points when cbDVGs were detected in samples from 18 cbDVG+ volunteers. Coded patient IDs (PID) are indicated on the left. Three cut-offs used to define cbDVGs as ‘Early’ are indicated: first detection within 3 d.p.i. (I), 5 d.p.i. (II) and 6 d.p.i. (III). For all three cut-offs, DVGs had to be cleared within the first 6 days of infection to be considered ‘Early’. All other patients were considered ‘Late’ cbDVG producers. b, Comparison of total viral load (left) and disease severity score (right) between Early and Late groups for all three cut-offs. For Early groups n = 3 (cut-off I), n = 7 (cut-off II) and n = 11 (cut-off III) and Late groups n = 15 (cut-off I), n = 11 (cut-off II) and n = 7 (cut-off III). Each dot represents the total score or viral load from individual participants and data are shown as mean ± s.e.m. Significant P values for two-tailed Mann–Whitney test are indicated. c,d, Cut-off II was selected to show the comparison of the kinetics of (c) viral load and (d) disease severity score among negative (n = 38), Early (n = 7) and Late (n = 11) groups. Data are plotted over time and trendline represents mean ± s.e.m. Significant P values for two-way analysis of variance (ANOVA) with Bonferroni post-hoc test for Early versus Late groups are indicated. e, Best-fit curves for kinetics of disease severity scores from negative (n = 38), Early (n = 7) and Late (n = 11) groups were calculated using a nonlinear Gaussian model. The best-fit values for amplitude of the negative, Early and Late group curves were compared.
Fig. 6 |
Fig. 6 |. Prolonged detection of cbDVgs associates with higher viral loads and worse clinical outcomes.
a, Criteria for prolonged and transient cbDVG detection. For the Prolonged group, cbDVGs had to be detected on at least 2 days and still be present beyond 6 d.p.i. The rest of the volunteers were considered part of the Transient group. The purple dashed line indicates the division between the Transient and Prolonged groups. b,c, Total viral load (b) and viral load over time (c) were compared between the Transient (n = 14) and Prolonged (n = 4) groups. d,e, Total disease severity score (d) and disease severity score over time (e) were compared between the Transient (n = 14) and Prolonged (n = 4) groups. f, The best-fit curves for the kinetics of disease severity score from the negative (n = 38), Transient (n = 14) and Prolonged (n = 4) groups were calculated and compared using a nonlinear Gaussian model. The best-fit values for amplitude of all three curves are shown. g,h Scattered dot plots showing (g) expression of IFNL1 and ISGs and (h) representative pro-inflammatory cytokines from the Transient (n = 10) and the Prolonged (n = 3) groups. Data are shown as mean ± s.e.m. Significant P values for two-tailed Mann–Whitney test (b,d,g,h) and two-way ANOVA with Bonferroni post-hoc test (c,e) are indicated for Transient versus Prolonged groups.

Similar articles

Cited by

References

    1. Hall CB et al. The burden of respiratory syncytial virus infection in young children. N. Engl. J. Med. 360, 588–598 (2009). - PMC - PubMed
    1. Pneumonia Etiology Research for Child Health (PERCH) Study Group. Causes of severe pneumonia requiring hospital admission in children without HIV infection from Africa and Asia: the PERCH multi-country case–control study. Lancet 394, 757–779 (2019). - PMC - PubMed
    1. Falsey AR, Hennessey PA, Formica MA, Cox C & Walsh EE Respiratory syncytial virus infection in elderly and high-risk adults. N. Engl. J. Med. 352, 1749–1759 (2005). - PubMed
    1. Shi T et al. Global, regional, and national disease burden estimates of acute lower respiratory infections due to respiratory syncytial virus in young children in 2015: a systematic review and modelling study. Lancet 390, 946–958 (2017). - PMC - PubMed
    1. Meissner HC et al. Immunoprophylaxis with palivizumab, a humanized respiratory syncytial virus monoclonal antibody, for prevention of respiratory syncytial virus infection in high risk infants: a consensus opinion. Pediatr. Infect. Dis. J. 18, 223–231 (1999). - PubMed

Publication types