. 2021 Jul;24(7):930-940.
doi: 10.1038/s41593-021-00827-3. Epub 2021 Apr 1.

Gain of toxic function by long-term AAV9-mediated SMN overexpression in the sensorimotor circuit

Affiliations

Gain of toxic function by long-term AAV9-mediated SMN overexpression in the sensorimotor circuit

Meaghan Van Alstyne et al. Nat Neurosci. 2021 Jul.

Abstract

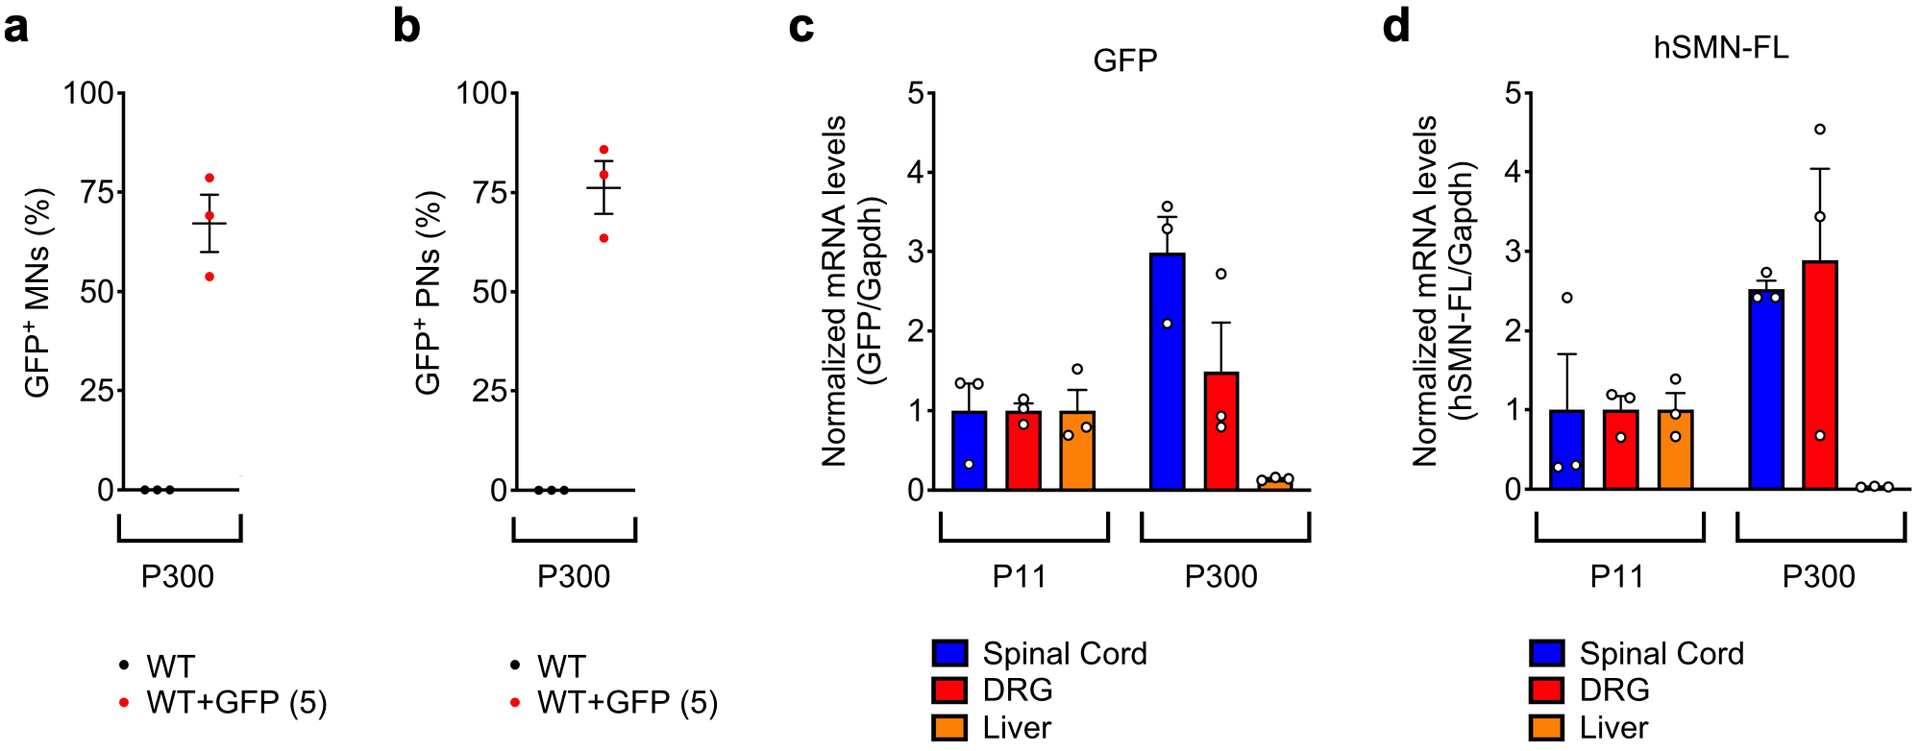
The neurodegenerative disease spinal muscular atrophy (SMA) is caused by deficiency in the survival motor neuron (SMN) protein. Currently approved SMA treatments aim to restore SMN, but the potential for SMN expression beyond physiological levels is a unique feature of adeno-associated virus serotype 9 (AAV9)-SMN gene therapy. Here, we show that long-term AAV9-mediated SMN overexpression in mouse models induces dose-dependent, late-onset motor dysfunction associated with loss of proprioceptive synapses and neurodegeneration. Mechanistically, aggregation of overexpressed SMN in the cytoplasm of motor circuit neurons sequesters components of small nuclear ribonucleoproteins, leading to splicing dysregulation and widespread transcriptome abnormalities with prominent signatures of neuroinflammation and the innate immune response. Thus, long-term SMN overexpression interferes with RNA regulation and triggers SMA-like pathogenic events through toxic gain-of-function mechanisms. These unanticipated, SMN-dependent and neuron-specific liabilities warrant caution on the long-term safety of treating individuals with SMA with AAV9-SMN and the risks of uncontrolled protein expression by gene therapy.


Conflict of interest statement

Competing Interests

The authors declare no competing interests.

Figures

Extended Data Fig. 1 /
Extended Data Fig. 1 /. Long-term AAV9-mediated SMN overexpression decreases sensory-motor synaptic transmission of proprioceptive neurons.
a-c, Representative EMG recordings from the footpad of uninjected (a) and either AAV9-GFP (5) (b) or AAV9-SMN (5) (c) treated WT mice at P300 using a stimulation frequency of 0.1Hz. This analysis captures both proprioceptive synaptic function (H-reflex) and motor neuron function (M-response), and the H/M ratio can determine a preferential deficit in either response. Arrows point to the stimulus artifact. d, Amplitude of the M-response from the same groups as shown in (a-c). The box-and-whiskers graph shows the median, interquartile range, minimum and maximum (n=8 animals). Statistics were performed with one-way ANOVA with Tukey’s post hoc test. (ns) no significance. P=0.9741, F2, 21=0.02629. e, Amplitude of H-reflex from the same groups as shown in (a-c). The box-and-whiskers graph shows the median, interquartile range, minimum and maximum (n=8 animals). Statistics were performed with one-way ANOVA with Tukey’s post-hoc test. (*) P<0.05. WT vs SMN(5): P=0.0420, q=3.684, df=21. f, Ratio of H-reflex and M-response from the same groups as shown in (a-c). The box-and-whiskers graph shows the median, interquartile range, minimum and maximum (n=8 animals). Statistics were performed with one-way ANOVA with Tukey’s post hoc test. (*) P<0.05. WT vs SMN(5): P=0.0103, q=4.592, df=21. g, Repetitive nerve stimulation at different frequencies from 0.1 to 50 Hz does not change the amplitude of the M-response recorded from the footpad of uninjected and either AAV9-GFP (5) or AAV9-SMN (5) treated WT mice at P300. The box-and-whiskers graph shows the median, interquartile range, minimum and maximum from the following number of animals: WT (0.1–10Hz n=8; 20–50Hz n=6); WT+AAV-GFP(5) (n=8); WT+AAV-SMN(5) (0.1–10Hz n=8; 20Hz n=7; 50Hz n=6). Statistics were performed with one-way ANOVA with Tukey’s post hoc test. (ns) no significance. WT: P=0.9938, F4, 31=0.05630; WT+AAV-GFP(5): P=0.6199, F4, 35=0.06660; WT+AAV-SMN(5): P=0.5344, F4, 32=0.07997;
Extended Data Fig. 2 /
Extended Data Fig. 2 /. Effects of AAV9-SMN on motor neuron survival, C-boutons and NMJ innervation in WT mice.
a, ChAT immunostaining of L5 spinal segments from uninjected, AAV9-GFP (5), AAV9-SMN (5) injected WT mice at P150. Scale bar=100μm. b, Soma size of motor neurons (MNs) from the same groups as in (a) at P150. The violin plot shows the median (solid line) and interquartile range (dotted lines) from the following number of motor neurons (WT, n=227 neurons; WT + GFP(5), n=234 neurons; WT + SMN(5), n=234 neurons) from 3 animals per group. Statistics were performed with one-way ANOVA with Tukey’s post hoc test. (ns) no significance. P=0.3083, F3, 449=1.180. c, Percentage of the number of L5 LMC motor neurons (MNs) per 75μm section relative to WT in the same groups as in (a) at P150. The box-and-whiskers graph shows the median, interquartile range, minimum and maximum from the following number of sections (WT, n=36 sections; WT + GFP(5), n=31 sections; WT + SMN(5), n=43 sections) from 3 animals per group. Statistics were performed with one-way ANOVA with Tukey’s post hoc test. (*) P<0.05; (**) P<0.01. WT vs SMN(5): P=0.0284, q=3.678, df=107; GFP(5) vs SMN(5): P=0.0064, q=4.420, df=107. d, ChAT immunostaining of L5 LMC motor neurons from uninjected, AAV9-GFP (5), AAV9-SMN (5 and 10) injected WT mice at P300. Scale bar=25μm. e, Total number of ChAT+ C-boutons on L5 LMC motor neurons (MNs) from the same groups as in (d) at P150 and P300. The box-and-whiskers graph shows the median, interquartile range, minimum and maximum from the following numbers of neurons and animals at P150 (WT, n=39 neurons, n=3 animals; WT + GFP(5), n=37 neurons, n=3 animals; WT + SMN(5), n=49 neurons, n=3 animals) and P300 (WT, n=28 neurons, n=3 animals; WT + GFP(5), n=31 neurons, n=3 animals; WT + SMN(5), n=36 neurons, n=3 animals; WT + SMN(10), n=14 neurons, n=4 animals). Statistics were performed with one-way ANOVA with Tukey’s post hoc test. (ns) no significance. For motor neurons at P150, P=0.9855, F2, 122=0.01456. For motor neurons at P300, P=0.0651, F3, 105=2.481. f, NMJ immunostaining of EDL muscles with Neurofilament-M (NF-M, blue), Synaptophysin (SYP, green) and bungarotoxin (BTX, red) from the same groups as in (a) at P300. Scale bar=25μm. g, Percentage of innervated, partially innervated and denervated NMJs in the EDL muscle from the same groups as in (a) at P150 and P300. Data represent mean and SEM (n=3 animals). Statistics were performed with two-way ANOVA with Tukey’s post hoc test. (*) P<0.05. For innervated NMJs: SMN(5) P150 vs SMN(5) P300: P=0.0346, q=4.588, df=42; SMN(5) P150 vs SMN(10) P300: P=0.0317, q=4.636, df=42.
Extended Data Fig. 3 /
Extended Data Fig. 3 /. Effects of AAV9-SMN on motor neuron survival, soma size and NMJ innervation in SMA mice.
a, ChAT (red) immunostaining of L2 motor neurons from untreated WT (SMNΔ7) mice and either AAV9-GFP (5) or AAV9-SMN (5) treated SMA mice at the indicated times. Scale bars=75μm (P11) and 100μm (P190). b, NMJ immunostaining with Neurofilament-M (NF-M, blue), Synaptophysin (SYP, green) and bungarotoxin (BTX, red) of QL muscles from the same groups as in (a). Scale bar=25μm (P11) and 50μm (P190). c, Soma size of motor neurons (MNs) from the same groups as in (a) at P11 and P190. The violin plot shows the median (solid line) and interquartile range (dotted lines) from the following number of motor neurons at P11 WT (SMNΔ7), n=230 neurons; SMA + GFP(5), n=185 neurons; SMA + SMN(5), n=175 neurons) and P190 (WT (SMNΔ7), n=231 neurons; SMA + SMN(5), n=164 neurons) from 3 animals per group. Statistics were performed with one-way ANOVA with Tukey’s post hoc test. (**) P<0.01; (****) P<0.0001. WT (SMNΔ7) P11 vs SMA+GFP(5) P11: P<0.0001, q=7.696, df=980; SMA+GFP(5) P11 vs SMA+SMN(5) P11: P=<0.0001, q=7.714, df=980; WT (SMNΔ7) P190 vs SMA+SMN(5) P190: P=0.0058, q=4.841, df=980. d, Percentage of the number of motor neurons (MNs) per 75μm section relative to WT (SMNΔ7) in the same groups as in (a) at P11 and P190. The box-and-whiskers graph shows the median, interquartile range, minimum and maximum from the following number of sections and animals at P11 WT (SMNΔ7), n=48 sections, n=3 animals; SMA + GFP(5), n=58 sections, n=6 animals; SMA + SMN(5), n=56 sections n=6 animals) and P190 (WT (SMNΔ7), n=42 sections, n=3 animals; SMA + SMN(5), n=41 sections, n=3 animals). Statistics were performed with one-way ANOVA with Tukey’s post hoc test. (**) P<0.01; (***) P<0.001; (ns) no significance. WT (SMNΔ7) P11 vs SMA+GFP(5) P11: P<0.0001, q=13.58, df=241; WT (SMNΔ7) P11 vs SMA+SMN(5) P11: P<0.0001, q=8.359, df=241; SMA+GFP(5) P11 vs SMA+SMN(5) P11: P=0.0018, q=5.364, df=241; WT (SMNΔ7) P190 vs SMA+SMN(5) P190: P<0.0001, q=8.108, df=241; SMA+SMN(5) P11 vs SMA+SMN(5) P190: P=0.9927, q=0.6110, df=241. e, Percentage of innervated, partially innervated and denervated NMJs relative to WT (SMNΔ7) in the QL muscle from the same groups as in (b) at P11 and P190. Data represent mean and SEM (n=3 animals). Statistics were performed with two-way ANOVA with Tukey’s post hoc test. (****) P<0.0001; (ns) no significance. For innervated NMJs: WT (SMNΔ7) P11 vs SMA+GFP(5) P11: P<0.0001, q=10.72, df=30; SMA+GFP(5) P11 vs SMA+SMN(5) P11: P<0.0001, q=7.789, df=30; SMA+SMN(5) P11 vs SMA+SMN(5) P190: P=0.9999, q=0.2233, df=30. f, Total number of PV+ proprioceptive neurons (PNs) in L2 DRGs from untreated WT (SMNΔ7) mice and AAV9-SMN (5) treated SMA mice at P190. Data represent mean and SEM (n=3 DRGs from n=3 animals). Statistics were performed with unpaired Student’s t-test. (ns) no significance. P=0.9106, t=0.1196, df=4
Extended Data Fig. 4 /
Extended Data Fig. 4 /. Efficiency of AAV9 transduction and long-term transgene expression in tissues of WT mice.
a, Percentage of GFP+ L5 LMC motor neurons from uninjected and AAV9-GFP (5) injected WT mice at P300. Data represent mean and SEM (n=3 animals). b, Percentage of GFP+ proprioceptive neurons in L5 DRGs from the same groups as in (a) at P300. Data represent mean and SEM (n=3 animals). c, RT-qPCR analysis of GFP mRNA in spinal cord, DRG and liver from WT mice injected with AAV9-GFP (5) at P11 and P300. Data represent mean and SEM (n=3 animals) normalized to Gapdh mRNA and expressed relative to levels at P11 set as 1. d, RT-qPCR analysis of full-length human SMN (hSMN-FL) mRNA in spinal cord, DRG and liver from WT mice injected with AAV9-SMN (5) at P11 and P300. Data represent mean and SEM (n=3 animals) normalized to Gapdh mRNA and expressed relative to levels at P11 set as 1.
Extended Data Fig. 5 /
Extended Data Fig. 5 /. AAV9-SMN leads to persistent SMN overexpression in the spinal cord and DRGs but not the liver of SMA mice.
a-c, RT-qPCR analysis of hSMN-FL mRNA levels in spinal cord (a), DRG (b) and liver (c) of uninjected WT (SMNΔ7) mice and SMA mice injected with either AAV9-GFP (5) or AAV9-SMN (5) at the indicated times. Data represent mean and SEM (n=3 animals) normalized to Gapdh mRNA and expressed relative to levels in WT (SMNΔ7) mice set as 1. Statistics were performed with one-way ANOVA with Tukey’s post hoc test. (*) P<0.05; (****) P<0.0001; (ns) no significance. For spinal cord: SMA+SMN(5) P11 vs SMA+SMN(5) P190: P=0.5887, q=2.111, df=10. For DRG: SMA+SMN(5) P11 vs SMA+SMN(5) P190: P=0.0396, q=4.866, df=10. For liver: SMA+SMN(5) P11 vs SMA+SMN(5) P190: P<0.0001, q=16.28, df=10. d-e, Western blot analysis of spinal cord (d) and liver (e) from the same groups as in (a). SMN expression was analyzed with antibodies that specifically detect only human SMN (hSMN) or both human and mouse SMN (pan-SMN). Cropped images are shown. f, Quantification of total SMN protein levels from the Western blot analysis in (d). Data represent mean and SEM (n=3 animals) normalized to Gapdh and expressed relative to levels in WT (SMNΔ7) mice set as 1. Statistics were performed with one-way ANOVA with Tukey’s post hoc test. (****) P<0.0001; (***) P<0.001. WT (SMNΔ7) P11 vs SMA+GFP(5) P11: P<0.0001, q=24.80, df=10; WT (SMNΔ7) P11 vs WT (SMNΔ7) P190: P=0.0001, q=11.12, df=10; WT (SMNΔ7) P11 vs SMA+SMN(5) P190: P=0.0003, q=9.975, df=10; SMA+SMN(5) P11 vs SMA+SMN(5) P190: P<0.0001, q=11.23, df=10. g, Quantification of human SMN protein levels from the Western blot analysis in (d). Data represent mean and SEM (n=3 animals) normalized to Gapdh and expressed relative to levels in WT (SMNΔ7) mice set as 1. Statistics were performed with one-way ANOVA with Tukey’s post hoc test. (****) P<0.0001; (***) P<0.001; (**) P<0.01; (*) P<0.05. WT (SMNΔ7) P11 vs SMA+GFP(5) P11: P=0.0165, q=5.671, df=10; WT (SMNΔ7) P11 vs SMN(5) P11: P<0.0001, q=25.08, df=10; WT (SMNΔ7) P11 vs SMA+SMN(5) P190: P=0.0009, q=8.513, df=10. SMA+SMN(5) P11 vs SMA+SMN(5) P190: P<0.0001, q=16.57, df=10. h, Quantification of total SMN protein levels from the Western blot analysis in (e). Data represent mean and SEM (n=3 animals) normalized to Gapdh and expressed relative to levels in WT (SMNΔ7) mice set as 1. Statistics were performed with one-way ANOVA with Tukey’s post hoc test. (****) P<0.0001. WT (SMNΔ7) P11 vs SMA+SMN(5) P11: P<0.0001, q=13.08, df=10; SMA+SMN(5) P11 vs SMA+SMN(5) P190: P<0.0001, q=15.56, df=10.
Extended Data Fig. 6 /
Extended Data Fig. 6 /. AAV9-SMN drives cytoplasmic aggregation of overexpressed SMN in motor circuit neurons of mouse models.
a, ChAT (red) and SMN (green) immunostaining of L5 LMC motor neurons (MNs) from uninjected and either AAV9-GFP (5) or AAV9-SMN (5) injected WT mice at P11 and P150. Scale bar=10μm. b, Percentage of L5 LMC motor neurons (MNs) with SMN aggregates in the same groups as in (a) at P300. Data represent mean and SEM (n=3 animals). c, PV (red) and SMN (green) immunostaining of L5 DRG proprioceptive neurons (PNs) from uninjected and either AAV9-GFP (5) or AAV9-SMN (5) injected WT mice at P11 and P150. Scale bar=10 μm. d, Percentage of L5 DRG proprioceptive neurons (PNs) with SMN aggregates in the same groups as in (c) at P300. Data represent mean and SEM (n=3 animals). e, ChAT (red) and SMN (green) immunostaining of L2 motor neurons (MNs) from WT (SMNΔ7) mice and either AAV9-GFP (5) or AAV9-SMN (5) injected SMA mice at the indicated time points. Scale bar=10μm. f, Percentage of L2 motor neurons (MNs) with SMN aggregates in the same groups as in (e) at P190. Data represent mean and SEM (n=3 animals). g, PV (red) and SMN (green) immunostaining of L2 DRG proprioceptive neurons (PNs) from the same groups as in (e). Scale bar=10μm. h, Percentage of L2 proprioceptive neurons (PNs) with SMN aggregates in the same groups as in (g) at P190. Data represent mean and SEM (n=3 animals).
Extended Data Fig. 7 /
Extended Data Fig. 7 /. AAV9-mediated SMN overexpression induces cytoplasmic aggregation of SmB in motor circuit neurons of mouse models.
a, ChAT (red) and SmB (green) immunostaining of L5 LMC motor neurons (MNs) from uninjected and either AAV9-GFP (5) or AAV9-SMN (5) injected WT mice at P11 and P150. Scale bar=10μm. b, PV (red) and SmB (green) immunostaining of L5 DRG proprioceptive neurons (PNs) from the same groups as in (a). Scale bar=10μm. c, ChAT (red) and SmB (green) immunostaining of L2 motor neurons (MNs) from WT (SMNΔ7) mice and either AAV9-GFP (5) or AAV9-SMN (5) injected SMA mice at the indicated time points. Scale bar=10μm. d, PV (red) and SmB (green) immunostaining of L2 proprioceptive neurons (PNs) from the same groups as in (c). Scale bar=10μm.
Extended Data Fig. 8 /
Extended Data Fig. 8 /. Immunohistochemical analysis of cytoplasmic SMN aggregates in motor neurons.
a-d, Immunostaining of L5 LMC motor neurons from WT mice injected with AAV9-SMN (5) at P300 with DAPI (blue), ChAT (grey), SMN (red) and RNA-binding proteins KSRP (a), FUS (b), hnRNPA1 (c) or HuR (d) as indicated. Scale bar=5μm. e-f, Immunostaining with DAPI (blue), ChAT (grey) and RNA transport factors Ran (e) and Crm1 (f) in the same motor neurons as in (a). Scale bar=5μm. g-h, Immunostaining with DAPI (blue), ChAT (grey), SMN (red) and either GW182 to label P-bodies (g) or TIA-1 to label stress granules (h) in the same motor neurons as in (a). Scale bar=5μm. i-j, Immunostaining with DAPI (blue), ChAT (grey), SMN (red) and either ubiquitin (i) or the autophagy marker LC3B (j) in the same motor neurons as in (a). Scale bar=5μm.
Extended Data Fig. 9 /
Extended Data Fig. 9 /. Viral-mediated overexpression of human SMN induces cytoplasmic aggregation and sequestration of SmB in human cells.
HeLa cells were untreated (mock) or transduced with lentivirus expressing either GFP (Lenti-GFP) or human SMN (Lenti-SMN). Immunostaining with DAPI (blue), GFP (grey), SMN (green) and SmB (red) was performed five days post transduction. Scale bar=10μm.
Extended Data Fig. 10 /
Extended Data Fig. 10 /. Model of the toxic effects of long-term AAV9-mediated SMN overexpression in neurons.
Schematic depicting the gain of toxic function mechanisms induced by long-term overexpression of SMN in the sensory-motor circuit of mouse models (see text for further details).
Fig. 1 /
Fig. 1 /. Long-term AAV9-mediated SMN overexpression induces sensory-motor toxicity in WT and SMA mice.
a-c, Weight gain (a), righting time (b), and survival (c) of WT (SMNΔ7) mice (n=17) and SMA mice injected with 5×10¹⁰vg/g (5) of AAV9-GFP (n=16) or AAV9-SMN (n=21) at P0. Data represent mean and SEM. Weight gain: P<0.0001, F2, 712=718.3, two-way ANOVA. Righting time: P<0.0001, F2, 661=1242, two-way ANOVA. Survival: P<0.0001, df=2, χ2=54.58, two-tailed Mantel-Cox log-rank test. d, Time of onset of hindlimb clasping in AAV9-SMN (5) treated SMA mice (n=5). The box-and-whiskers graph shows the median, interquartile range, minimum and maximum. WT (SMNΔ7) mice (n=5) do not display hindlimb clasping. e, Hindlimb clasping phenotype observed in AAV9-SMN (5) treated SMA mice at P190. f, Hindlimb clasping phenotype in AAV9-SMN injected WT mice compared to uninjected and AAV9-GFP treated controls at P300. g, Time of onset of hindlimb clasping in WT mice injected with 2.5×10¹⁰vg/g (2.5) (n=7), 5×10¹⁰vg/g (5) (n=10), and 1×10¹¹vg/g (10) (n=10) of AAV-SMN. Uninjected WT mice (n=17) and WT mice treated with 5×10¹⁰vg/g (5) of AAV9-GFP (n=16) or 1.25×10¹⁰vg/g (1.25) of AAV-SMN (n=10) do not display hindlimb clasping. The box-and-whiskers graph shows the median, interquartile range, minimum and maximum. h, Weight gain of uninjected and AAV9-injected WT mice from the same groups as in (g). Data represent mean and SEM. Statistics were performed with two-way ANOVA (P<0.0001, F5, 609=26.28) and Tukey’s multiple comparisons test results between WT and WT+SMN(10): Week 4, P=0.0147; Week 5, P=0.0030; Week 6, P=0.0051; Week 7, P=0.0073; Week 8, P=0.0033; Week 9, P=0.0005; Week 10, P=0.0005) and shown as follows: (*) p<0.05; (**) p<0.01; (***) p<0.001. i, Survival of uninjected and AAV9-injected WT mice from the same groups as in (g). P=0.0179, df=5, χ2=13.66, two-tailed Mantel-Cox log-rank test. j, Latency to fall on the inverted grid test from the same groups as in (g). Data represent mean and SEM. Statistics were performed with two-way ANOVA (P<0.0001, F5, 609=105.9) and Tukey’s multiple comparisons test results between WT and WT+SMN(5): Week 7, P=0.0003; Week 8–10, P<0.0001 or WT and WT+SMN(10): Week 2, P=0.0062; Week 3–10, P<0.0001 and shown as follows: (**) p<0.01; (***) p<0.001; (****) p<0.0001. k, Performance of WT mice from the same groups as in (g) on the rotarod assay. Data represent mean and SEM. Statistics were performed with two-way ANOVA (P<0.0001, F5, 543=169.9) and Tukey’s multiple comparisons test results between WT and WT+SMN(5): Week 4, P=0.0443; Week 5, P=0.0035; Week 6, P=0.0002; Week 7, P=0.0034; Week 8–10, P<0.0001 or WT and WT+SMN(10): Week 3–10, P<0.0001 and shown as follows: (*) p<0.05; (**) p<0.01; (***) p<0.001; (****) p<0.0001.
Fig. 2 /
Fig. 2 /. AAV9-SMN induces late-onset deafferentation of motor neurons in WT and SMA mice.
a, Choline acetyltransferase (ChAT, blue) and vesicular glutamate transporter 1 (VGluT1, grey) immunostaining of L5 lateral motor column (LMC) motor neuron somata and dendrites from uninjected, AAV9-GFP (5) and AAV9-SMN (5 and 10) injected WT mice at P300. Scale bar=25μm. Dendrites Scale bar=10μm. b, Total number of VGluT1+ synapses on L5 LMC motor neuron somata at P150 and P300 from the same groups as in (a). The box-and-whiskers graph shows the median, interquartile range, minimum and maximum from the following number of neurons and animals per group at P150 (WT, n=39 neurons, n=3 animals; WT + GFP(5), n=36 neurons, n=3 animals; WT + SMN(5), n=57 neurons, n=3 animals) and P300 (WT, n=41 neurons, n=3 animals; WT + GFP(5), n=41 neurons, n=3 animals; WT + SMN(5), n=39 neurons, n=3 animals; WT + SMN(10), n=36 neurons, n=4 animals). Statistics were performed with one-way ANOVA with Tukey’s post hoc test. (****) P<0.0001; (***) P<0.001. WT P150 vs SMN(5) P150: P<0.0001, q=16.96, df=283; GFP(5) P150 vs SMN(5) P150: P<0.0001, q=13.81, df=283; WT P300 vs SMN(5) P300: P<0.0001, q=22.64, df=283; WT P300 vs SMN(10) P300: P<0.0001, q=25.65, df=283; GFP(5) P300 vs SMN(5) P300: P<0.0001, q=22.14, df=283; GFP(5) P300 vs SMN(10) P300: P<0.0001, q=25.16, df=283; SMN(5) P150 vs SMN(5) P300: P=0.001, q=6.581, df=283; SMN(5) P150 vs SMN(10) P300: P<0.0001, q=10.16, df=283. c, Density of VGluT1+ synapses on L5 LMC motor neuron proximal dendrites (number of synapses divided by the dendritic length up to 50μm from soma) at P150 and P300 from the same groups as in (a). The box-and-whiskers graph shows the median, interquartile range, minimum and maximum from the following number of dendrites and animals per group at P150 (WT, n=35 dendrites, n=3 animals; WT + GFP(5), n=26 dendrites, n=3 animals; WT + SMN(5), n=33 dendrites, n=3 animals) and P300 (WT, n=36 dendrites, n=3 animals; WT + GFP(5), n=31 dendrites, n=3 animals; WT + SMN(5), n=37 dendrites, n=3 animals; WT + SMN(10), n=35 dendrites, n=4 animals). Statistics were performed with one-way ANOVA with Tukey’s post hoc test. (****) P<0.0001; (***) P<0.001; (*) P<0.05. WT P150 vs SMN(5) P150: P<0.0001, q=12.90, df=226; GFP(5) P150 vs SMN(5) P150: P<0.0001, q=12.77, df=226; WT P300 vs SMN(5) P300: P<0.0001, q=16.95, df=226; WT P300 vs SMN(10) P300: P<0.0001, q=18.55, df=226; GFP(5) P300 vs SMN(5) P300: P<0.0001, q=16.74, df=226; GFP(5) P300 vs SMN(10) P300: P<0.0001, q=18.30, df=226; SMN(5) P150 vs SMN(5) P300: P=0.0261, q=4.523, df=226; SMN(5) P150 vs SMN(10) P300: P=0.0003, q=6.258, df=226. d, ChAT (blue) and VGluT1 (grey) immunostaining of L2 spinal segments from WT (SMNΔ7) mice and SMA mice treated with AAV9-GFP (5) or AAV9-SMN (5) at the indicated times. Scale bar=10μm. e, Total number of VGluT1+ synapses on L2 motor neuron somata from the same groups as in (d). The box-and-whiskers graph shows the median, interquartile range, minimum and maximum from the following number of neurons from n=3 animals per group at P11 (WT (SMNΔ7), n=31 neurons; SMA + GFP(5), n=38 neurons; SMA + SMN(5), n=34 neurons) and P190 (WT (SMNΔ7), n=27 neurons; SMA + SMN(5), n=30 neurons). Statistics were performed with one-way ANOVA with Tukey’s post hoc test. (****) P<0.0001. WT (SMNΔ7) P11 vs SMA+GFP(5) P11: P<0.0001, q=16.76, df=155; SMA+GFP(5) P11 vs SMA+SMN(5) P11: P<0.0001, q=15.09, df=155; WT (SMNΔ7) P190 vs SMA+SMN(5) P190: P<0.0001, q=10.34, df=155; SMA+SMN(5) P11 vs SMA+SMN(5) P190: P<0.0001, q=12.51, df=155.
Fig. 3 /
Fig. 3 /. AAV9-SMN induces late-onset neurodegeneration in WT mice.
a, Parvalbumin (PV) immunostaining of L5 DRGs from uninjected, AAV9-GFP (5) and AAV9-SMN (5 and 10) injected WT mice at P300. Scale bar=250μm. b, Total number of proprioceptive neurons (PNs) in L5 DRGs from the same groups as in (a). Data represent mean and SEM (n=3 DRGs from n=3 animals). Statistics were performed with one-way ANOVA with Tukey’s post hoc test. (*) P<0.05; (**) P<0.01; (***) P<0.001. WT vs SMN(5): P=0.0463, q=4.606, df=8; WT vs SMN(10): P=0.0005, q=10.07, df=8; GFP vs SMN(5): P=0.0087, q=6.350, df=8; GFP vs SMN(10): P=0.0001, q=11.81, df=8. c, ChAT immunostaining of L5 spinal segments from uninjected, AAV9-GFP (5), AAV9-SMN (5 and 10) injected WT mice at P300. Scale bar=100μm. d, Soma size of motor neurons (MNs) from the same groups as in (c) at P300. The violin plot shows the median (solid line) and interquartile range (dotted lines) from the following number of motor neurons from 3 animals per group (WT, n=253 neurons; WT + GFP(5), n=271 neurons; WT + SMN(5), n=251 neurons; WT + SMN(10), n=258 neurons). Statistics were performed with one-way ANOVA with Tukey’s post hoc test. (*) P<0.05; (****) P<0.0001. WT vs SMN(5): P=0.0138, q=4.272, df=1026; WT vs SMN(10): P<0.0001, q=19.98, df=1026; GFP vs SMN(5): P=0.0248, q=3.995, df=1026; GFP vs SMN(10): P<0.0001, q=19.99, df=1026. e, Percentage of the number of L5 LMC motor neurons (MNs) per 75μm section relative to WT in the same groups as in (c) at P300. The box-and-whiskers graph shows the median, interquartile range, minimum and maximum from the following number of sections and animals per group (WT, n=48 sections, n=3 animals; WT + GFP(5), n=48 sections, n=3 animals; WT + SMN(5), n=46 sections, n=3 animals; WT + SMN(10), n=55 sections, n=4 animals). Statistics were performed with one-way ANOVA with Tukey’s post hoc test. (***) P<0.001; (****) P<0.0001. WT vs SMN(10): P=0.0001, q=6.218, df=193; GFP vs SMN(5): P=0.0005, q=5.680, df=193; GFP vs SMN(10): P<0.0001, q=9.531, df=193.
Fig. 4 /
Fig. 4 /. AAV9 drives long-term transgene overexpression in motor neurons and proprioceptive neurons but not the liver of WT mice.
a, DAPI (blue), GFP (green) and either ChAT (red, top panels) or PV (red, middle panels) immunostaining of L5 spinal cords from uninjected and AAV9-GFP (5) injected WT mice at P11 and P300. Scale bar=250μm. b, Western blot analysis of spinal cord from of uninjected and either AAV9-GFP (5) or AAV9-SMN (5) injected WT mice at P11 and P300. SMN expression was analyzed with antibodies that specifically detect only human SMN (hSMN) or both human and mouse SMN (pan-SMN). Cropped images are shown. c, Quantification of SMN protein levels from the Western blot analysis in (b). Data represent mean and SEM (n=3 animals) normalized to Gapdh and expressed relative to levels in WT mice at P11 set as 1. Statistics were performed with one-way ANOVA with Tukey’s post hoc test. (***) P<0.001; (ns) no significance. WT P11 vs SMN(5) P11: P=0.0008, q=8.378, df=12; WT P11 vs SMN(5) P300: P=0.0002, q=9.952, df=12; SMN(5) P11 vs SMN(5) P300: P=0.8671, q=1.574, df=12. d, Western blot analysis of liver from the same groups as in (b). SMN expression was analyzed with antibodies that specifically detect only human SMN (hSMN) or both human and mouse SMN (pan-SMN). Cropped images are shown. e, Quantification of SMN protein levels from the Western blot analysis in (d). Data represent mean and SEM (n=3 animals) normalized to Gapdh and expressed relative to levels in WT mice at P11 set as 1. Statistics were performed with one-way ANOVA with Tukey’s post hoc test. (****) P<0.0001. WT P11 vs SMN(5) P11: P<0.0001, q=11.93, df=12; SMN(5) P11 vs SMN(5) P300: P<0.0001, q=10.95, df=12.
Fig. 5 /
Fig. 5 /. AAV9-SMN induces cytoplasmic aggregation of SMN and SmB proteins.
a, ChAT (red) and SMN (green) immunostaining of L5 LMC motor neurons (MNs) from WT mice uninjected and injected with AAV9-GFP (5) or AAV9-SMN (5) at P300. Scale bar=10μm. Arrowheads point to nuclear Gems. b, PV (red) and SMN (green) immunostaining of L5 DRG proprioceptive neurons (PNs) from the same groups as in (a) at P300. Scale bar=10μm. Arrowheads point to nuclear Gems. c, ChAT (red) and SmB (green) immunostaining of L5 LMC motor neurons (MNs) from the same groups as in (a) at P300. Scale bar=10μm. d, PV (red) and SmB (green) immunostaining of L5 DRG proprioceptive neurons (PNs) from the same groups as in (a) at P300. Scale bar=10μm. e-f, ChAT (grey), SMN (green) and SmB (red) immunostaining of an L5 LMC motor neurons (e) and proprioceptive neurons (f) in WT mice injected with AAV9-SMN (5) at P300. Scale bar=5μm. g-h. Normalized nuclear SmB fluorescence intensity in L5 LMC motor neurons (g) and proprioceptive neurons (h) from the same groups as in (e) and (f) at P300. The violin plots show the median (solid line) and interquartile range (dotted lines) from the following number of motor neurons (WT, n=210 neurons; WT + GFP(5), n=266 neurons; WT + SMN(5), n=234 neurons) and proprioceptive neurons (WT, n=172 neurons; WT + GFP(5), n=186 neurons; WT + SMN(5), n=174 neurons) from 3 mice per group. Statistics were performed with one-way ANOVA with Tukey’s post-hoc test. (**) P<0.01; (****) P<0.0001. For motor neurons, WT vs SMN(5): P<0.0001, q=12.99, df=707; GFP(5) vs SMN(5): P<0.0001, q=15.37, df=707. For proprioceptive neurons, WT vs SMN(5): P=0.0036, q=4.589, df=529; GFP(5) vs SMN(5): P<0.0001, q=7.422, df=529.
Fig. 6 /
Fig. 6 /. Long-term AAV9-mediated SMN overexpression induces widespread transcriptome alterations in DRGs.
a, Venn diagram of splicing changes in lumbar DRGs from uninjected and either AAV9-GFP (5) or AAV9-SMN (5) treated WT mice at P300 (|ΔPSI|≥0.1, and FDR≤0.05). b, Pie chart of the proportion of different types of splicing changes induced by AAV9-SMN in DRGs of WT mice. The splicing events include cassette exons (CAS), intron retention (IRET), alternative 3’ splice sites (ALT 3’), alternative 5’ splice sites (ALT 5’), tandem cassette exons (TACA), and mutually exclusive exons (MUTX). c, Bar graph of the number of skipped and included cassette exons as well as increased and decreased intron retention events induced by AAV9-SMN in DRGs of WT mice at P300. d-f, Volcano plot of the indicated two-way comparisons of transcript level changes in lumbar DRGs from uninjected and either AAV9-GFP (5) or AAV9-SMN (5) treated WT mice at P300. Significant changes with a multiple-test adjusted P value of <0.05 using edgeR are shown in red. g, Venn diagram of transcript level changes in lumbar DRGs from uninjected and either AAV9-GFP (5) or AAV9-SMN (5) treated WT mice at P300 (fold change>2; FDR<0.05). h, Gene ontology analysis of the most enriched biological pathways associated with AAV9-SMN dependent gene changes in lumbar DRGs. i-l, Representative RNA-seq tracks for C1qa (h), C1qb (i), C1qc (j) and Chodl (l) reads from lumbar DRGs of uninjected and either AAV9-GFP (5) or AAV9-SMN (5) treated WT mice at P300.

Comment in

References

    1. Burghes AHM & Beattie CE Spinal muscular atrophy: why do low levels of survival motor neuron protein make motor neurons sick? Nat. Rev. Neurosci 10, 597–609 (2009). - PMC - PubMed
    1. Tisdale S & Pellizzoni L Disease Mechanisms and Therapeutic Approaches in Spinal Muscular Atrophy. J. Neurosci 35, 8691–8700 (2015). - PMC - PubMed
    1. Lefebvre S et al. Identification and characterization of a spinal muscular atrophy-determining gene. Cell 80, 155–65 (1995). - PubMed
    1. Lorson CL, Hahnen E, Androphy EJ & Wirth B A single nucleotide in the SMN gene regulates splicing and is responsible for spinal muscular atrophy. Proc. Natl. Acad. Sci. U. S. A 96, 6307–11 (1999). - PMC - PubMed
    1. Hua Y et al. Peripheral SMN restoration is essential for long-term rescue of a severe spinal muscular atrophy mouse model. Nature 478, 123–126 (2011). - PMC - PubMed

Publication types

MeSH terms

Substances