. 2021 Mar 16:8:625347.
doi: 10.3389/fvets.2021.625347. eCollection 2021.

Metabolic Reprogramming and Inflammatory Response Induced by D-Lactate in Bovine Fibroblast-Like Synoviocytes Depends on HIF-1 Activity

Affiliations

Metabolic Reprogramming and Inflammatory Response Induced by D-Lactate in Bovine Fibroblast-Like Synoviocytes Depends on HIF-1 Activity

John Quiroga et al. Front Vet Sci. .

Abstract

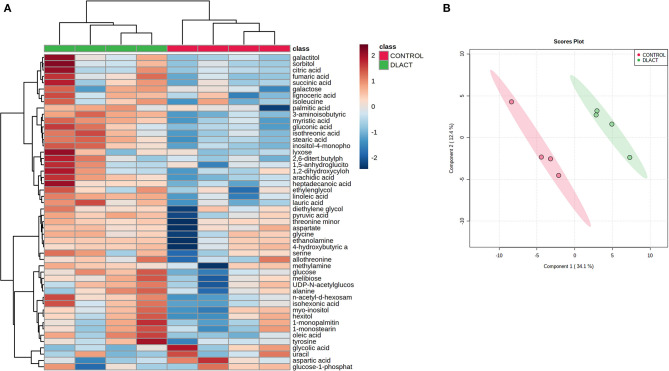
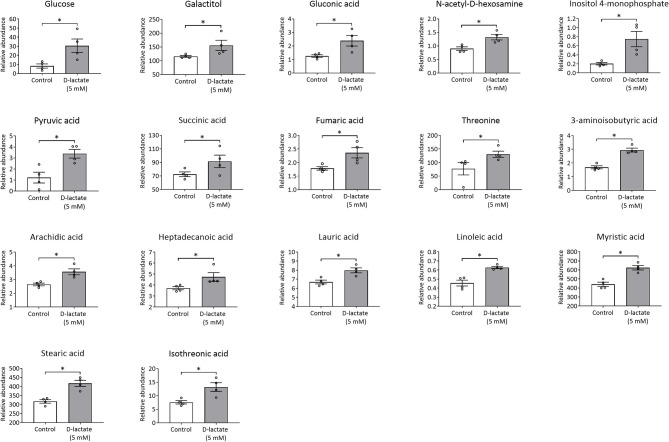
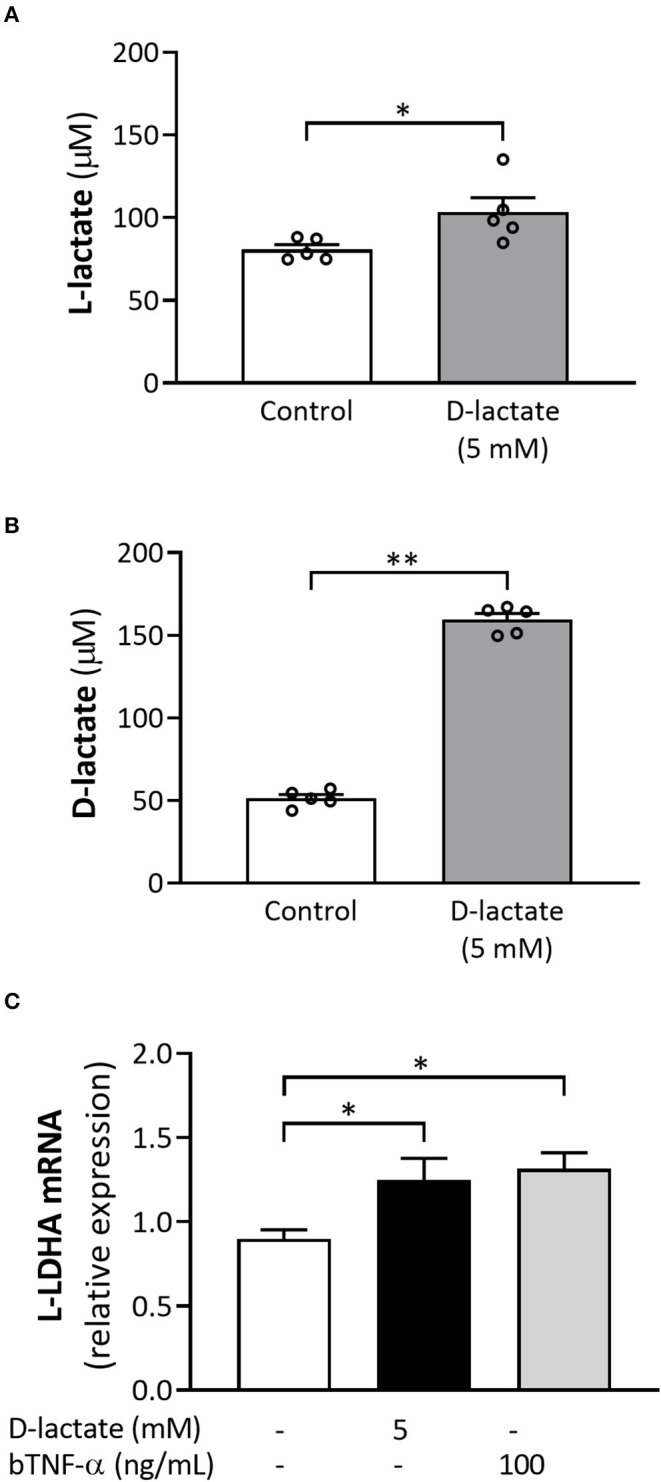
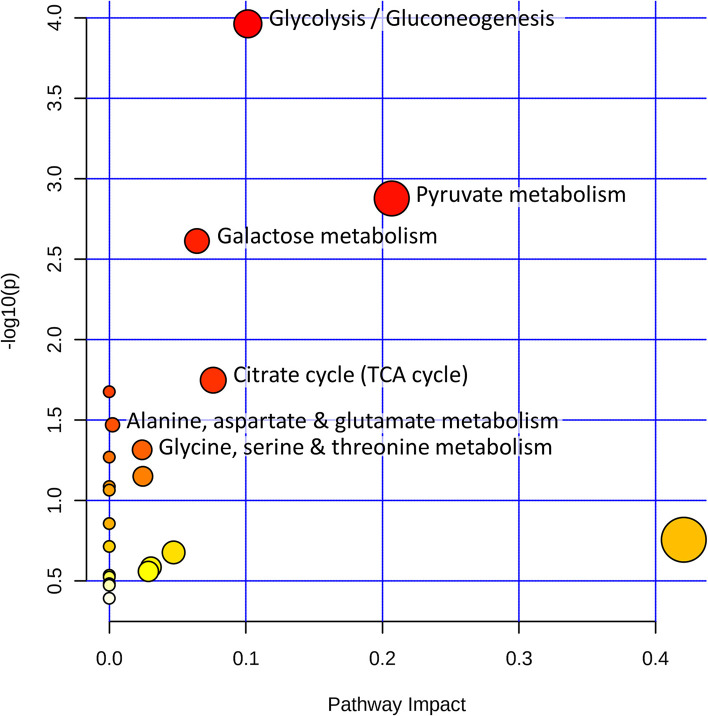
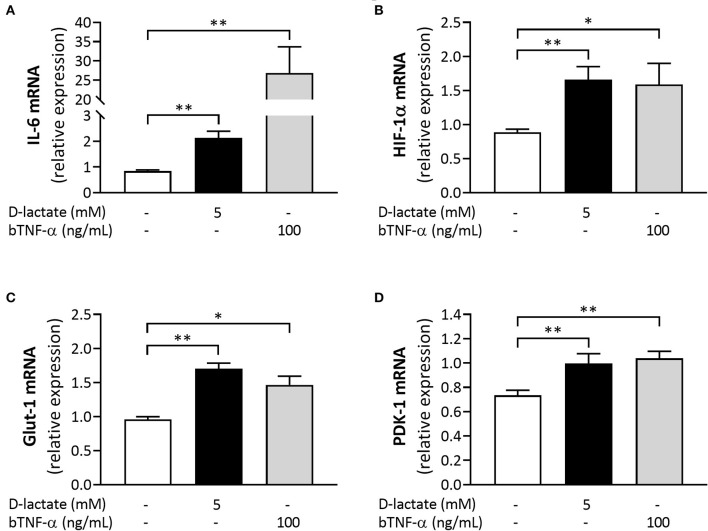
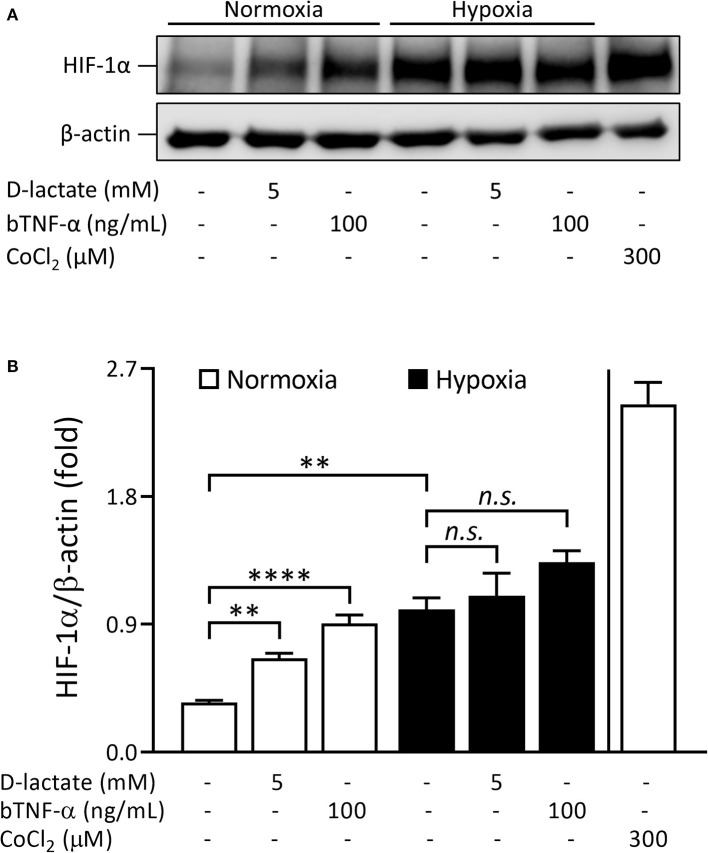
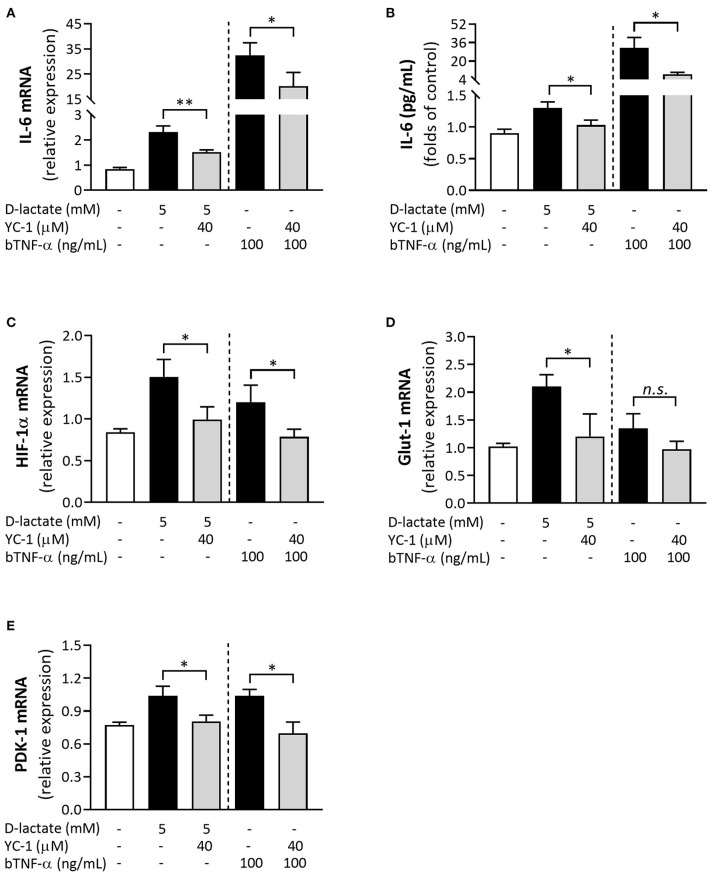
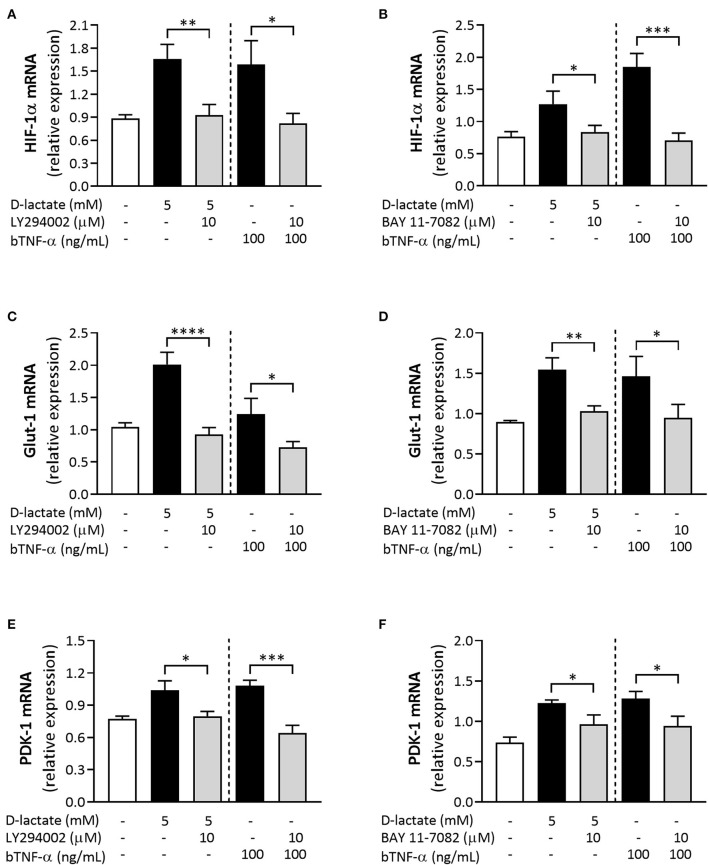
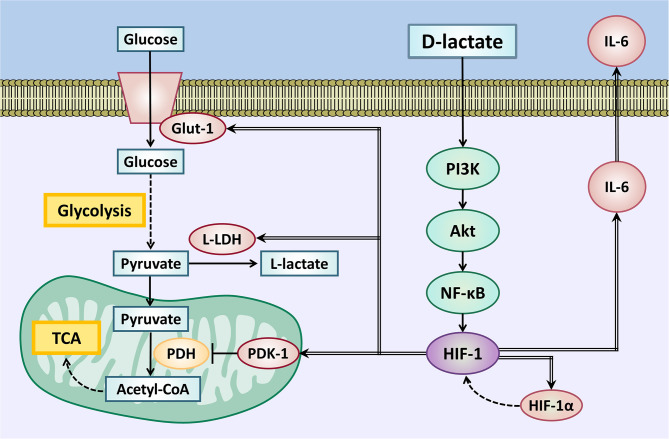
Acute ruminal acidosis (ARA) occurs after an excessive intake of rapidly fermentable carbohydrates and is characterized by the overproduction of D-lactate in the rumen that reaches the bloodstream. Lameness presentation, one of the primary consequences of ARA in cattle, is associated with the occurrence of laminitis and aseptic polysynovitis. Fibroblast-like synoviocytes (FLS) are predominant cells of synovia and play a key role in the pathophysiology of joint diseases, thus increasing the chances of the release of pro-inflammatory cytokines. Increased D-lactate levels and disturbances in the metabolism of carbohydrates, pyruvates, and amino acids are observed in the synovial fluid of heifers with ARA-related polysynovitis prior to neutrophil infiltration, suggesting an early involvement of metabolic disturbances in joint inflammation. We hypothesized that D-lactate induces metabolic reprogramming, along with an inflammatory response, in bovine exposed FLS. Gas chromatography-mass spectrometry (GC-MS)-based metabolomics revealed that D-lactate disrupts the metabolism of bovine FLS, mainly enhancing glycolysis and gluconeogenesis, pyruvate metabolism, and galactose metabolism. The reverse-transcription quantitative PCR (RT-qPCR) analysis revealed an increased expression of metabolic-related genes, including hypoxia-inducible factor 1 (HIF-1)α, glucose transporter 1 (Glut-1), L-lactate dehydrogenase subunit A (L-LDHA), and pyruvate dehydrogenase kinase 1 (PDK-1). Along with metabolic disturbances, D-lactate also induced an overexpression and the secretion of IL-6. Furthermore, the inhibition of HIF-1, PI3K/Akt, and NF-κB reduced the expression of IL-6 and metabolic-related genes. The results of this study reveal a potential role for D-lactate in bFLS metabolic reprogramming and support a close relationship between inflammation and metabolism in cattle.

Keywords: D-lactate; bovine fibroblast-like synoviocyte; hypoxia inducible factor 1; inflammation; metabolic reprogramming.


Conflict of interest statement

The authors declare that the research was conducted in the absence of any commercial or financial relationships that could be construed as a potential conflict of interest.

Figures

Figure 1
Figure 1
Metabolomic profile of bovine fibroblast-like synoviocytes (bFLS) after D-lactate treatment. (A) Hierarchical clustering analysis of 50 metabolites from the control untreated and 5 mM D-lactate-stimulated bFLS. The red and blue colors indicate that the metabolite level is increased and decreased compared to the mean metabolite relative abundance, respectively. Each column represents a sample clustered according to treatment, and each row represents an individual metabolite. n = 4. (B) The partial least squares-discriminant analysis (PLS-DA) score plot based on metabolomic analysis of D-lactate stimulated (green) and control (red) bFLS. The explained variances of the selected components are shown in brackets. n = 4.
Figure 2
Figure 2
D-Lactate alters the intracellular concentration of several metabolites. The concentrations of metabolites significantly altered after 1 h stimulation with 5 mM D-lactate are expressed as relative abundance with respect to ribitol. Each bar represents the mean ± SEM. Each point represents an independent experiment, n = 4. *p < 0.05.
Figure 3
Figure 3
D-Lactate treatment increases the intracellular levels of both lactate stereoisomers as well as the L-lactate dehydrogenase subunit A (L-LDHA) expression. bFLS were treated with 5 mM D-lactate for 1 h. (A) L-lactate and (B) D-lactate were quantified at the intracellular level by high-performance liquid chromatography (HPLC). Each bar represents the mean ± SEM. Each point represents an independent experiment, n = 5. (C) The relative mRNA expression of L-LDHA was assessed by RT-qPCR. Bovine tumore necrosis factor-α (TNF-α) was used as the positive control. Each bar represents the mean ± SEM, n = 5. *p < 0.05; **p < 0.01.
Figure 4
Figure 4
D-Lactate reprograms bFLS metabolism. bFLS were stimulated with 5 mM D-lactate for 1 h. Metabolic pathway analysis was performed using MetaboAnalyst v4.0 based on the Kyoto Encyclopedia of Genes and Genomes (KEGG) using all metabolites significantly altered after D-lactate treatment. All matched pathways are shown as circles. The color of the circles is based on p-values from pathway enrichment analysis, where darker colors indicate more significant metabolites changes in the corresponding pathway. The size of the circles represents the pathway impact score. The most impacted pathways with high statistical significance (p < 0.05) are labeled. n = 4.
Figure 5
Figure 5
D-Lactate increases the expression of inflammation and metabolism-associated genes in bFLS. Relative mRNA expression of (A) IL-6, (B) hypoxia-inducible factor-1 subunit α (HIF-1α), (C) glucose transporter 1 (Glut-1), and (D) pyruvate dehydrogenase kinase 1 (PDK-1) in bFLS stimulated with 5 mM D-lactate for 6 h. bTNF-α was used as the postitive control. Each bar represents the mean ± SEM, n = 5. *p < 0.05; **p < 0.01.
Figure 6
Figure 6
D-Lactate induces HIF-1α protein accumulation under normoxic conditions in bFLS. bFLS were stimulated with 5 mM D-lactate for 6 h under normoxic (20% O2) and hypoxic (1% O2) conditions. bTNF-α was used as the positive control. HIF-1α stabilization was detected in total protein extracts by Western blot using cobalt chloride (CoCl2) as the hypoxia-mimetic agent. (A) Representative HIF-1α immunoblot is shown. (B) Densitometry HIF-1α values were quantified using Image Studio Lite v5.2 software and normalized to β-actin. Each bar represents the mean ± SEM, n = 3. **p < 0.01; ****p < 0.0001; n.s., not significant.
Figure 7
Figure 7
HIF-1 is involved in the D-lactate-induced overexpression of inflammation- and metabolism-associated genes in bFLS. bFLS were preincubated with 40 μM YC-1 and then stimulated with 5 mM D-lactate for 6 h. The relative mRNA expression levels of (A) IL-6, (C) HIF-1α, (D) Glut-1, and (E) PDK-1 are shown. (B) IL-6 levels in conditioned media were measured by ELISA. bTNF-α was used as the positive control. Each bar represents the mean ± SEM, n = 5. *p < 0.05; **p < 0.01; n.s., not significant.
Figure 8
Figure 8
The PI3K/Akt pathway and the NF-κB pathway regulate the overexpression of metabolic genes induced by D-lactate in bFLS. bFLS were preincubated with 10 μM LY294002 or 10 μM BAY 11-7082 and stimulated with 5 mM D-lactate for 6 h. The relative mRNA expression levels of (A,B) HIF-1α, (C,D) Glut-1, and (E,F) PDK-1 are shown. bTNF-α was used as positive control. Each bar represents the mean ± SEM, n = 5. *p < 0.05; **p < 0.01; ***p < 0.001; ****p < 0.0001.
Figure 9
Figure 9
Metabolic reprogramming supports the inflammatory response induced by D-lactate in bFLS. D-Lactate induces the PI3K/Akt pathway activation and downstream activation of NF-κB and HIF-1. Through this signaling pathway, D-lactate induces the gene expression of IL-6, with the pro-inflammatory cytokine involved in the synovial inflammatory response. HIF-1 activation also increases the expression of the Glut-1 transporter, which increases glucose uptake for use in glycolysis. Glycolysis is also favored by the HIF-1-dependent overexpression of L-LDH, which oxidizes pyruvate to L-lactate. In addition, an increased PDK-1 expression blocks the mitochondrial utilization of pyruvate through the TCA cycle, contributing to the glycolytic fate of glucose. Overexpression of the HIF-1α subunit would favor the accumulation of HIF-1 heterodimers, maintaining glycolytic metabolic reprogramming. IL-6, interleukin 6; Glut-1, solute carrier family 2 (facilitated glucose transporter) member 1; L-LDH, L-lactate dehydrogenase; PDK-1, pyruvate dehydrogenase kinase 1; HIF-1α, hypoxia inducible factor 1 subunit alpha; PDH, pyruvate dehydrogenase; TCA, tricarboxylic acid cycle; PI3K, phosphatidyl inositol 3-kinase; Akt, protein kinase B; NF-κB, nuclear factor kappa B; HIF-1, hypoxia-inducible factor 1.

Similar articles

Cited by

References

    1. Nagaraja TG, Titgemeyer EC. Ruminal acidosis in beef cattle: the current microbiological and nutritional outlook. J Dairy Sci. (2007) 90:E17–38. 10.3168/jds.2006-478 - DOI - PubMed
    1. Hernández J, Benedito JL, Abuelo A, Castillo C. Ruminal acidosis in feedlot: from aetiology to prevention. Sci World J. (2014) 2014:702572. 10.1155/2014/702572 - DOI - PMC - PubMed
    1. Nocek JE. Bovine acidosis: implications on laminitis. J Dairy Sci. (1997) 80:1005–28. 10.3168/jds.S0022-0302(97)76026-0 - DOI - PubMed
    1. Dunlop RH, Hammond PB. D-Lactic acidosis of ruminants. Ann N Y Acad Sci. (1965) 119:1109–32. 10.1111/j.1749-6632.1965.tb47466.x - DOI - PubMed
    1. Harmon DL, Britton RA, Prior RL, Stock RA. Net portal absorption of lactate and volatile fatty acids in steers experiencing glucose-induced acidosis or fed a 70% concentrate diet ad libitum. J Anim Sci. (1985) 60:560–9. 10.2527/jas1985.602560x - DOI - PubMed

LinkOut - more resources