

Acute Symptoms of Mild to Moderate COVID-19 Are Highly Heterogeneous Across Individuals and Over Time
- PMID: 33796601
- PMCID: PMC7989225
- DOI: 10.1093/ofid/ofab090
Acute Symptoms of Mild to Moderate COVID-19 Are Highly Heterogeneous Across Individuals and Over Time
Abstract
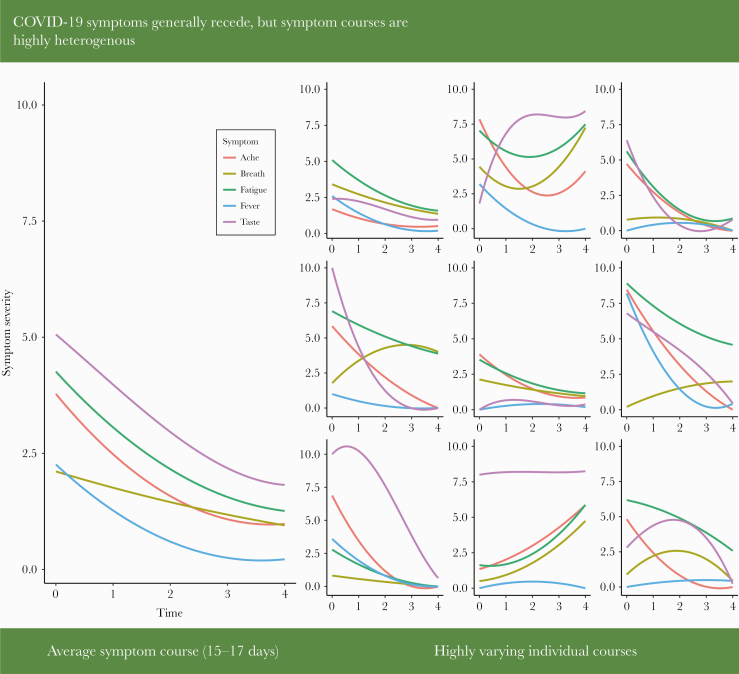
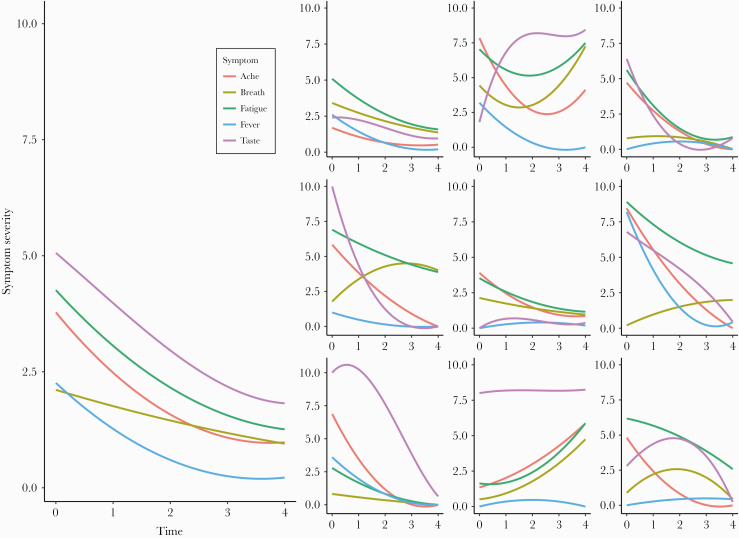
Background: The symptoms of coronavirus disease 2019 (COVID-19) appear to be heterogenous, and the typical course of these symptoms is unknown. Our objectives were to characterize the common trajectories of COVID-19 symptoms and to assess how symptom course predicts other symptom changes as well as clinical deterioration.
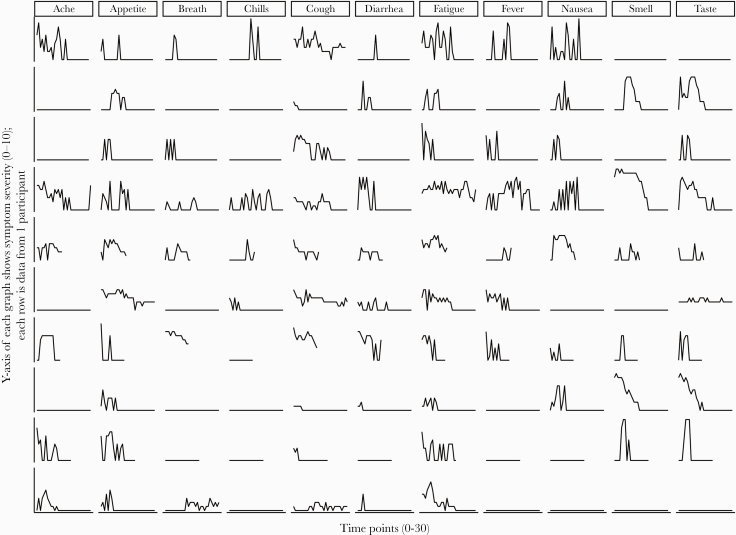
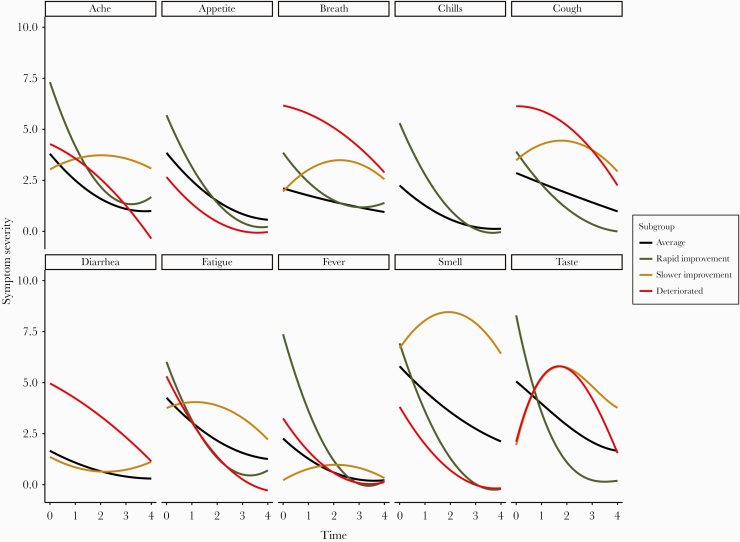
Methods: One hundred sixty-two participants with acute COVID-19 responded to surveys up to 31 times for up to 17 days. Several statistical methods were used to characterize the temporal dynamics of these symptoms. Because 9 participants showed clinical deterioration, we explored whether these participants showed any differences in symptom profiles.
Results: Trajectories varied greatly between individuals, with many having persistently severe symptoms or developing new symptoms several days after being diagnosed. A typical trajectory was for a symptom to improve at a decremental rate, with most symptoms still persisting to some degree at the end of the reporting period. The pattern of symptoms over time suggested a fluctuating course for many patients. Participants who showed clinical deterioration were more likely to present with higher reports of severity of cough and diarrhea.
Conclusions: The course of symptoms during the initial weeks of COVID-19 is highly heterogeneous and is neither predictable nor easily characterized using typical survey methods. This has implications for clinical care and early-treatment clinical trials. Additional research is needed to determine whether the decelerating improvement pattern seen in our data is related to the phenomenon of patients reporting long-term symptoms and whether higher symptoms of diarrhea in early illness presages deterioration.
Keywords: COVID-19; cough; humans; severe acute respiratory syndrome coronavirus 2; smell; taste.
© The Author(s) 2021. Published by Oxford University Press on behalf of Infectious Diseases Society of America.
Figures
References
-
- Centers for Disease Control and Prevention. Symptoms of Coronavirus. https://www.cdc.gov/coronavirus/2019-ncov/symptoms-testing/symptoms.html. Accessed 16 March 2021.
-
- World Health Organization. Coronavirus disease (COVID-19). https://www.who.int/emergencies/diseases/novel-coronavirus-2019/question.... Accessed 16 March 2021.
-
- Wiersinga WJ, Rhodes A, Cheng AC, et al. Pathophysiology, transmission, diagnosis, and treatment of coronavirus disease 2019 (COVID-19): a review. JAMA 2020; 324:782–93. - PubMed
LinkOut - more resources
Full Text Sources
Other Literature Sources
