. 2021 Mar 5;11(5):e3936.
doi: 10.21769/BioProtoc.3936.

Retention Using Selective Hooks (RUSH) Cargo Sorting Assay for Protein Vesicle Tracking in HeLa Cells

Affiliations

Retention Using Selective Hooks (RUSH) Cargo Sorting Assay for Protein Vesicle Tracking in HeLa Cells

Natalia Pacheco-Fernandez et al. Bio Protoc. .

Abstract

Monitoring vesicle trafficking is an excellent tool for the evaluation of protein dynamics in living cells. Such study is key for the understanding of protein sorting and secretion. Recent developments in microscopy, as well as new methodologies developed to study synchronized trafficking of proteins, allowed a better understanding of signaling, regulation and trafficking dynamics at the secretory pathway. One of the most helpful tools so far developed is the Retention Using Selective Hooks (RUSH) system, a methodology that facilitates the evaluation of synchronized cargo trafficking by monitoring fluorescent vesicles in cells upon biotin addition. Here we present a protocol that allows the quantitative evaluation of protein cargo trafficking at different fixed time points and an analytic approach that enables a better examination of specific cargo trafficking dynamics at the secretory pathway. Graphic abstract: Schematic representation of RUSH sorting assay in mammalian cells.

Keywords: Cargo sorting; Confocal microscopy; Protein trafficking; RUSH; Vesicle tracking.


Conflict of interest statement

Competing interestsThe authors declare no competing financial interests.

Figures

Figure 1.
Figure 1.. Scheme representing the RUSH system.
A. Protein complex containing the protein of interest (here matrix metalloprotease 2, MMP2), a streptavidin binding peptide (SBP) and a fluorescent protein (eGFP). The complex is bound via SBP to streptavidin (Str), which is linked to a KDEL sequence for its retention in the endoplasmic reticulum (donor compartment). Without biotin addition, the complex remains in the donor compartment; however, once biotin is added to the media, it binds to streptavidin and enables the trafficking of the MMP2-SBP-eGFP protein complex to the acceptor compartment. Figure adapted from Boncompain et al. (2012) . B. Immunofluorescence images showing the trafficking of MMP2 across the secretory pathway, with MMP2 localizing at the ER when biotin is absent, and later localizing at the Golgi (15 and 30 min) and in post-Golgi vesicles (45 min) upon biotin addition. TGN46: trans-Golgi marker. Figure taken from Pacheco-Fernandez et al. (2020) .
Figure 2.
Figure 2.. Vector map for the pIRESneo2-Str-KDEL-MMP2-SBP-eGFP construct used as an example in this protocol.
The plasmid depicts the KDEL-bound streptavidin and the reporter MMP2-SBP-eGFP. An IRES element in the plasmid enables the simultaneous expression of both Str-KDEL and MMP2-SBP-eGFP in one single plasmid. For more details about the construct, please see Boncompain et al. (2012) . The map was generated with SnapGene®.
Figure 3.
Figure 3.. Scheme depicting the handling times during time intervals for the RUSH experiment.
The scheme depicts the handling time for an experienced person using the MMP2 construct with the described time points of 0, 15, 30 and 45 min.
Figure 4.
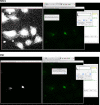
Figure 4.. Screenshot of the RUSH-Vesicle analysis macro window in Fiji
Figure 5.
Figure 5.. Screenshot of step 1 from RUSH-analysis macro
Figure 6.
Figure 6.. Screenshot of step 2 from RUSH-analysis macro
Figure 7.
Figure 7.. Screenshot of step 3 from RUSH-analysis macro.
The figure “Before” shows the binary image generated (MAX_Bin_Image, left window), the original maximal projection (MAX_Image), the threshold control window and the “Action Required” window. To avoid losing low-intensity vesicles in the count you have to adjust manually the black and white balance of the MAX_Bin_Image having the fluorescent maximal projection as a reference (MAX_Image). Proper adjustment is illustrated in the figure named as “After”.
Figure 8.
Figure 8.. Screenshot of the final step from quantitative analysis.
Three windows will appear automatically after clicking ok in step no. 7: one with a draw of the counted vesicles per cell (generated for each analyzed cell, blue square), a log window that depicts the number of vesicles counted per cell (magenta square) and a ROI window containing the information of the selected ROIs (selected cells, green square). The log window values can be copied to an excel file or statistical analysis software for further evaluation.
Figure 9.
Figure 9.. Screenshot of the files generated after running the macro
Figure 10.
Figure 10.. Final result from MMP2 RUSH vesicle analysis.
Panel (A) depicts immunofluorescent images of HeLa cells expressing the RUSH MMP2eGFP construct at different time points. Scale bars: 10 µm. Panel (B) shows the accumulated number of MMP2-positive vesicles from at least 25 analyzed cells. Differences between time points were evaluated with a Kruskall-Wallis test. **** P-value < 0.0001.
Figure 11.
Figure 11.. Immunofluorescent images of HeLa cells transfected with MMP2-RUSH and co-stained with TGN46.
Cells were fixed at the indicated time points, permeabilized and incubated with GFP and anti-TGN46 antibodies (TGN-46 is a trans-Golgi marker). Green: MMP2-SBP-eGFP, magenta: trans-Golgi network. Scale bars: 10 µm.

Similar articles

Cited by

References

    1. Boncompain G., Divoux S., Gareil N., de Forges H., Lescure A., Latreche L., Mercanti V., Jollivet F., Raposo G. and Perez F.(2012). Synchronization of secretory protein traffic in populations of cells. Nat Methods 9(5): 493-498. - PubMed
    1. Boncompain G. and Perez F.(2013). Fluorescence-based analysis of trafficking in mammalian cells. Methods Cell Biol 118: 179-194. - PubMed
    1. Boncompain G. and Weigel A. V.(2018). Transport and sorting in the Golgi complex: multiple mechanisms sort diverse cargo. Curr Opin Cell Biol 50: 94-101. - PubMed
    1. Chen D., Gibson E. S. and Kennedy M. J.(2013). A light-triggered protein secretion system. J Cell Biol 201(4): 631-640. - PMC - PubMed
    1. Crevenna A. H., Blank B., Maiser A., Emin D., Prescher J., Beck G., Kienzle C., Bartnik K., Habermann B., Pakdel M., Leonhardt H., Lamb D. C. and von Blume J.(2016). Secretory cargo sorting by Ca2+-dependent Cab45 oligomerization at the trans-Golgi network . J Cell Biol 213(3): 305-314. - PMC - PubMed

LinkOut - more resources