. 2021 Mar 2;24(4):102258.
doi: 10.1016/j.isci.2021.102258. eCollection 2021 Apr 23.

Three-dimensional understanding of the morphological complexity of the human uterine endometrium

Affiliations

Three-dimensional understanding of the morphological complexity of the human uterine endometrium

Manako Yamaguchi et al. iScience. .

Abstract

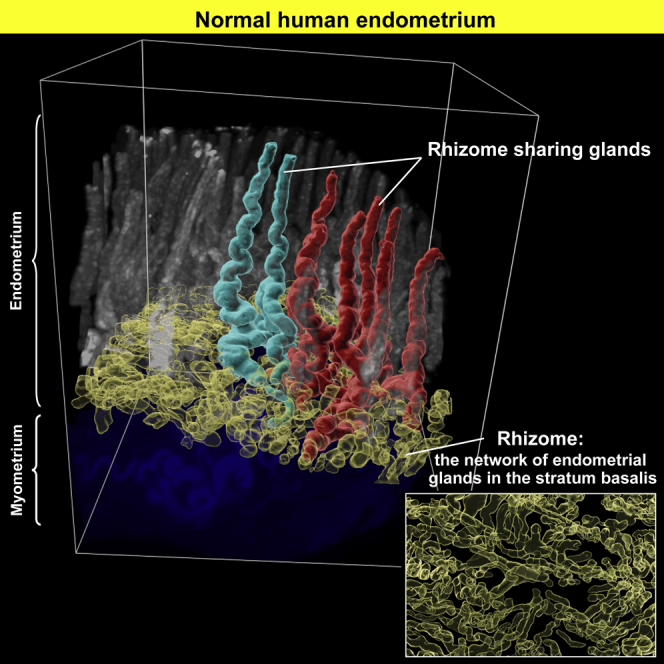
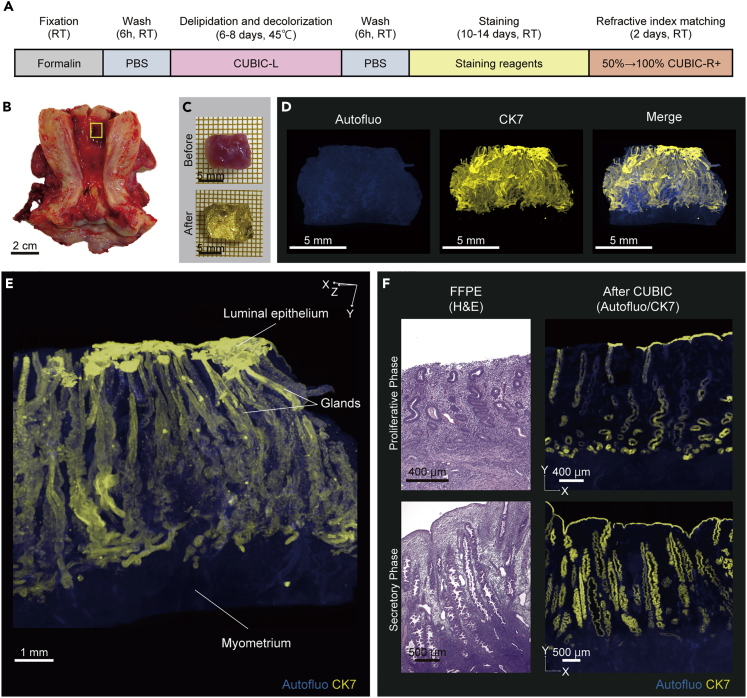
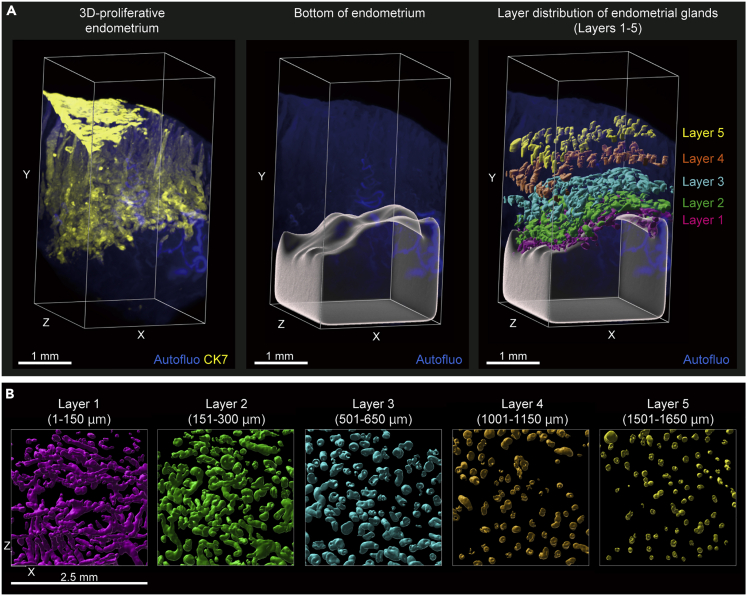
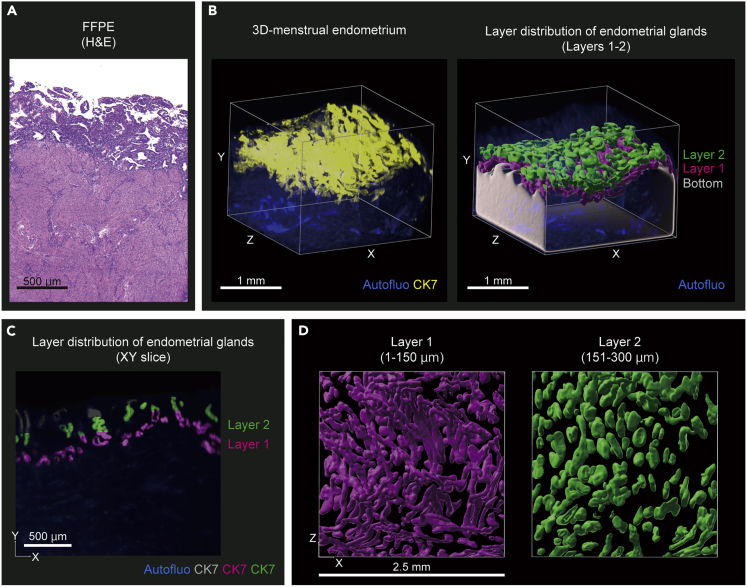
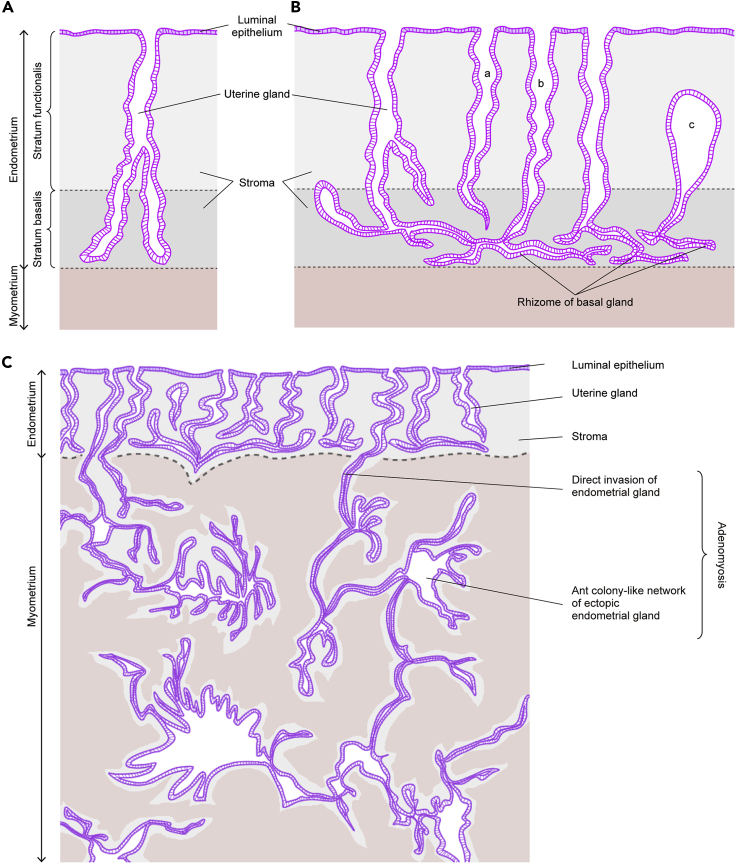
The fundamental morphology of the endometrial glands is not sufficiently understood by 2D observation because these glands have complicated winding and branching patterns. To construct a large picture of the endometrial gland structure, we performed tissue-clearing-based 3D imaging of human uterine endometrial tissue. Our 3D immunohistochemistry and layer analyses revealed that the endometrial glands form a plexus network in the stratum basalis and expand horizontally along the muscular layer, similar to the rhizome of grass. We then extended our method to assess the 3D morphology of tissue affected by adenomyosis, a representative "endometrium-related disease," and observed its 3D morphological features, including the direct invasion of endometrial glands into the myometrium and an ant colony-like network of ectopic endometrial glands within the myometrium. Thus, further understanding of the morphology of the human endometrium based on 3D analysis will lead to the identification of the pathogenesis of endometrium-related diseases.

Keywords: Human Physiology; Imaging Anatomy.


Conflict of interest statement

RIKEN Quantitative Biology Center has filed a patent based on this work in which K. Tainaka is a co-inventor. Other authors declare no competing interests.

Figures

None
Graphical abstract
Figure 1
Figure 1
Tissue clearing and 3D imaging of human uterine tissue using CUBIC (A) Schematic diagram of the clearing and immunostaining protocol for human uterine tissue. (B) Sampling site (yellow box) of human uterine tissue from subject E2. (C) Clearing performance of CUBIC protocol IV for human uterine tissue from subject E2. (D) 3D images of tissue from subject E2 stained with Alexa Fluor 555-conjugated anti-CK7 antibody with clearing by CUBIC. (E) Magnified 3D image of tissue from subject E2 demonstrating numerous glands as well as luminal epithelium and myometrium. (F) Comparison between a microscopic H&E-stained image and the reconstituted XY-plane image after clearing by CUBIC. Upper panels: images of endometrium in the proliferative phase (subject E1). Lower panels: images of endometrium in the secretory phase (subject E8). XY-plane optical slices (subject E1, z = 7.62 μm; subject E8, z = 6.61 μm). (D–F) Images obtained by LSF microscopy. Autofluorescence was measured by excitation at 488 nm. CK7-expressing endometrial epithelial cells were measured by excitation at 532 nm. RT, room temperature; Autofluo, autofluorescence; CK7, cytokeratin 7; FFPE, formalin-fixed paraffin-embedded; H&E, hematoxylin and eosin. See also Figure S1 and Video S1.
Figure 2
Figure 2
Morphology of occluded human endometrial glands (A and B) An occluded gland (subject E8). (A) Reconstructed XY-plane images (z = 99 μm). The red arrow indicates an occluded gland. (B) 3D distribution of an occluded gland that was pseudocolored and separated into a new channel by the Surface module in Imaris. (C) Spearman's correlation analysis was performed to evaluate the association between age and the number of occluded glands. (D) The average thickness of the endometrium and the height of the top of the occluded glands in each case. Error bars show ±SD. In the lower panel, the menstrual cycle is shown. (E) The volume of occluded glands in proliferative-phase samples and secretory-phase samples. Box plots show the median and interquartile range (IQR), with whiskers indicating the 1.5 IQR. Data were statistically compared by t test. Images were obtained by LSF microscopy. Autofluorescence was measured by excitation at 488 nm. CK7-expressing endometrial epithelial cells were measured by excitation at 532 nm. A p value less than 0.05 was considered statistically significant. Autofluo, autofluorescence; CK7, cytokeratin 7. See also Figures S2 and S3 and Table S1 and Video S2.
Figure 3
Figure 3
Morphology of branched human endometrial glands (A) Branches of endometrial glands (subject E8) on reconstructed XY-plane images (z = 198 μm). Red arrows indicate the branches. (B) Classification of endometrial glands based on branch status. (a) Nonbranched gland. (b) Branched gland. The branched glands were subclassified into three categories based on the position of the branchpoint: “Upper 2/3 of the endometrium,” “Lower 1/3 of the endometrium,” or “Both,” (C) Glands sharing branches with the other glands (subject E8). 3D reconstruction of the distribution of branched glands that were pseudocolored and separated as new channels by the Surface module in Imaris. (D) Representative patterns of the glands sharing branches with other glands. These glands were classified into three categories based on the position of the shared branching point: “Upper 2/3 of the endometrium,” “Lower 1/3 of the endometrium,” or “Both.” (E) Spearman's correlation analysis was used to evaluate the association of age with (a) the proportion of branched glands and (b) the proportion of glands sharing branches with other glands. Images were obtained by LSF microscopy. Autofluorescence was measured by excitation at 488 nm. CK7-expressing endometrial epithelial cells were measured by excitation at 532 nm. Autofluo, autofluorescence; CK7, cytokeratin 7. See also Figure S4 and Tables S2 and S3 and Video S3.
Figure 4
Figure 4
3D layer distribution of human endometrial glands (A) Left panel: the 3D tissue image was cropped on the XZ plane to 2.5 mm × 2.5 mm (subject E1). Middle panel: 3D reconstruction of the bottom layer of the endometrium. Right panel: 3D layers of endometrial glands were created at the same distance from the bottom layer and with a thickness of 150 μm by the Surface module in Imaris. Layer 1 (magenta): 1–150 μm; layer 2 (green): 151–300 μm; layer 3 (light blue): 501–650 μm; layer 4 (orange): 1,001–1,150 μm; and layer 5 (yellow): 1,501–1,650 μm. (B) XZ-plane view (y = 150 μm) of the five layers made by the Surface module in Imaris. After surface extraction, each structure was manually curated, and extra surface signals were eliminated. Images were obtained by LSF microscopy. Autofluorescence was measured by excitation at 488 nm. CK7-expressing endometrial epithelial cells were measured by excitation at 532 nm. Autofluo, autofluorescence; CK7, cytokeratin 7. See also Figure S5.
Figure 5
Figure 5
3D layer distribution of endometrial glands in a case of menstruation (A) Microscopic H&E-stained image of endometrium during menstruation (subject E11-1). (B) Left panel: the 3D tissue image was cropped on the XZ plane to 2.5 mm × 2.5 mm (subject E11-1). Right panel: 3D reconstruction of the bottom layer of the endometrium and 3D layers of the endometrial glands were created at the same distance from the bottom layer and with a thickness of 150 μm by the Surface module in Imaris. Layer 1 (magenta): 1–150 μm; layer 2 (green): 151–300 μm. (C) XY-plane reconstructions (z = 47.6 μm). Each layer was pseudocolored and separated as new channels by the Surface module in Imaris. (D) XZ-plane view (y = 150 μm) of two layers made by the Surface module in Imaris. After surface extraction, each structure was manually curated, and extra surface signals were eliminated. Images were obtained by LSF microscopy. Autofluorescence was measured by excitation at 488 nm. CK7-expressing endometrial epithelial cells were measured by excitation at 532 nm. FFPE, formalin-fixed, paraffin-embedded; H&E, hematoxylin and eosin; Autofluo, autofluorescence; CK7, cytokeratin 7. See also Figure S6 and Video S4.
Figure 6
Figure 6
3D morphology of adenomyotic tissue (A) Left panel: microscopic H&E-stained image of adenomyotic tissue in the secretory phase (subject A1). Right panel: reconstructed XY section (z = 10 μm) of the adenomyotic sample after clearing by CUBIC. Black and red arrows indicate adenomyotic lesions. (B–D) 3D distribution of adenomyosis. (B) Subject A1. (C) Subject A2. (D) Subject A3. The sample from subject A2 did not include eutopic endometrium. Red object: 3D structures of the direct invasion of endometrial glands into the myometrium. Yellow object: ectopic endometrial glands in the myometrium excluding direct endometrial gland invasion. Yellow and red objects were made by the Surface module in Imaris. After surface extraction, each structure was manually curated, and extra surface signals were eliminated. Images were obtained by LSF microscopy. Autofluorescence was measured by excitation at 488 nm. CK7-expressing endometrial epithelial cells were measured by excitation at 532 nm. FFPE, formalin-fixed paraffin-embedded; H&E, hematoxylin and eosin; Autofluo, autofluorescence; CK7, cytokeratin 7. See also Figures S7 and S8 and Video S5.
Figure 7
Figure 7
2D images of the normal human endometrium and adenomyotic tissue (A) Conventional 2D image of the endometrium. (B) New 2D image of the endometrium. (a) Nonbranched gland. (b) Gland sharing the rhizome with other glands. (c) Occluded gland. (C) 2D image of adenomyotic tissue, including direct endometrial gland invasion into the myometrium and an ant colony-like network of ectopic endometrial glands within the myometrium.

References

    1. Al-Hussaini M., Ashi S.A.-L., Ardighieri L., Ayhan A., Bennett J., Desouk M.M., Garcia R., Gilks B., Han L., Haque M. Uterus. In Pathology Outlines.com. 2020. https://www.pathologyoutlines.com/uterus.html
    1. Arora R., Fries A., Oelerich K., Marchuk K., Sabeur K., Giudice L.C., Laird D.J. Insights from imaging the implanting embryo and the uterine environment in three dimensions. Development. 2016;143:4749–4754. - PMC - PubMed
    1. Benagiano G., Brosens I. History of adenomyosis. Best Pract. Res. Clin. Obstet. Gynaecol. 2006;20:449–463. - PubMed
    1. Chan R.W., Schwab K.E., Gargett C.E. Clonogenicity of human endometrial epithelial and stromal cells. Biol. Reprod. 2004;70:1738–1750. - PubMed
    1. Chandra V., Kim J.J., Benbrook D.M., Dwivedi A., Rai R. Therapeutic options for management of endometrial hyperplasia. J. Gynecol. Oncol. 2016;27:e8. - PMC - PubMed