. 2021 Mar 2;24(4):102259.
doi: 10.1016/j.isci.2021.102259. eCollection 2021 Apr 23.

Exploring the landscape of ectodomain shedding by quantitative protein terminomics

Affiliations

Exploring the landscape of ectodomain shedding by quantitative protein terminomics

Kazuya Tsumagari et al. iScience. .

Abstract

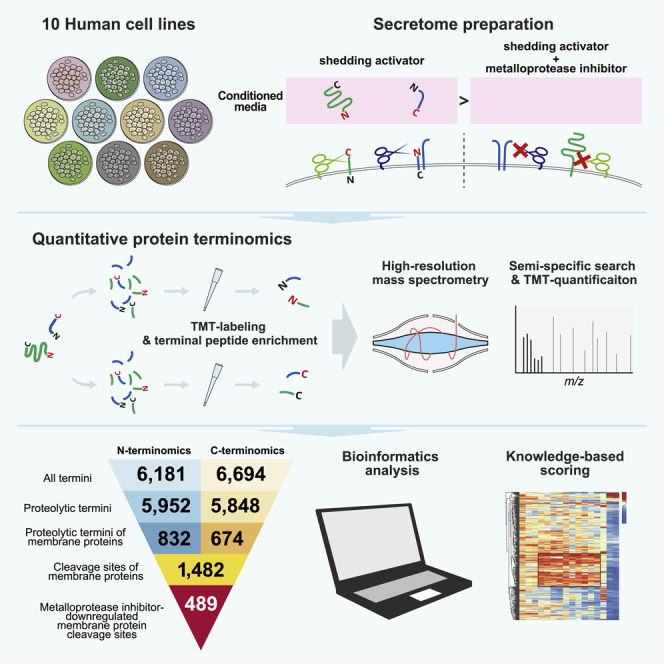
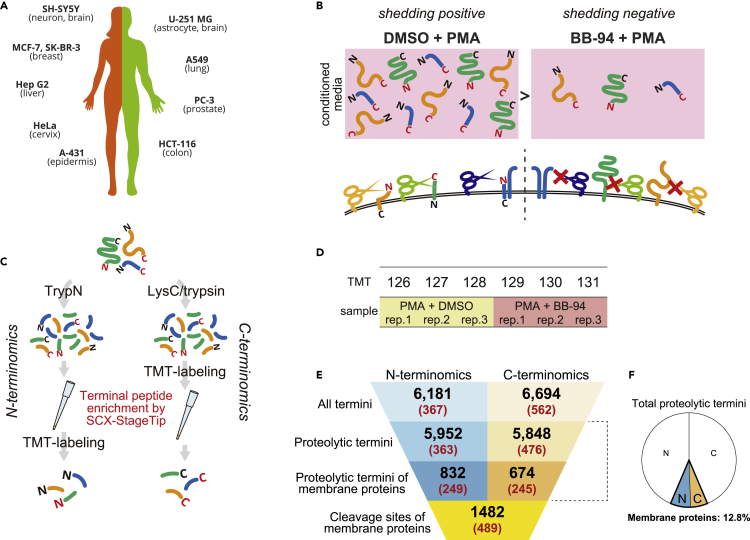
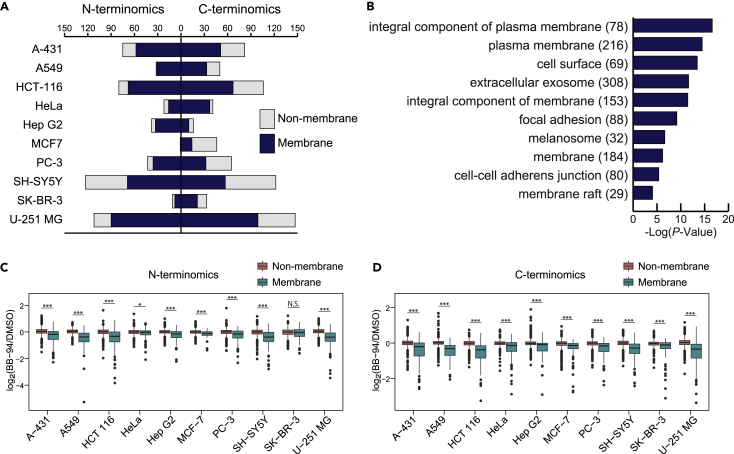
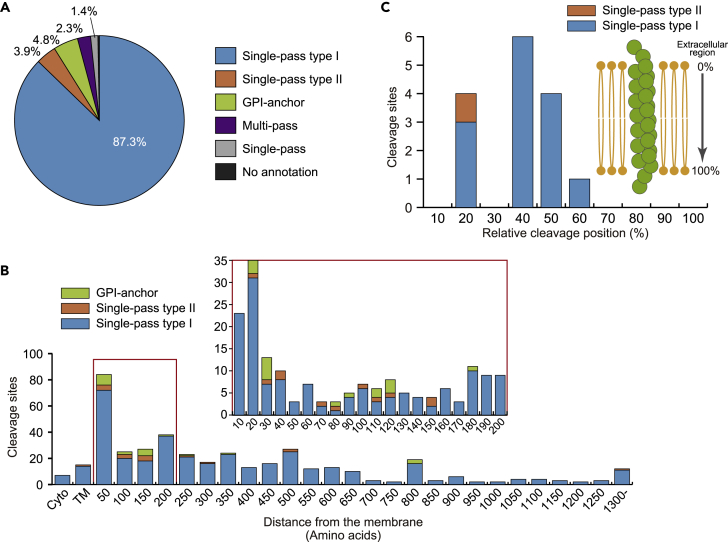
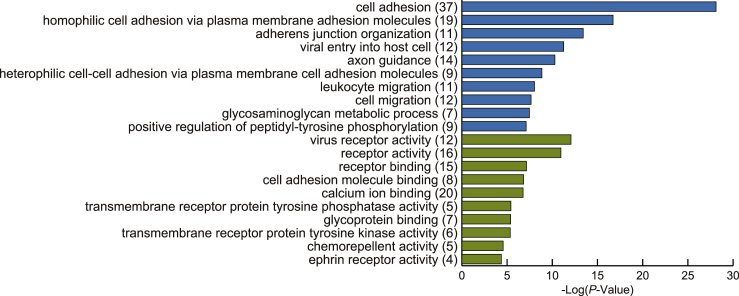
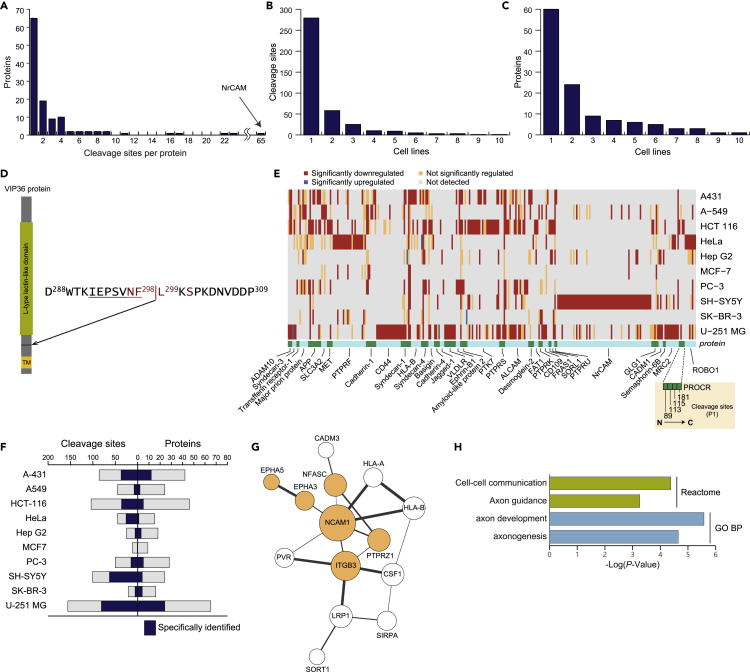
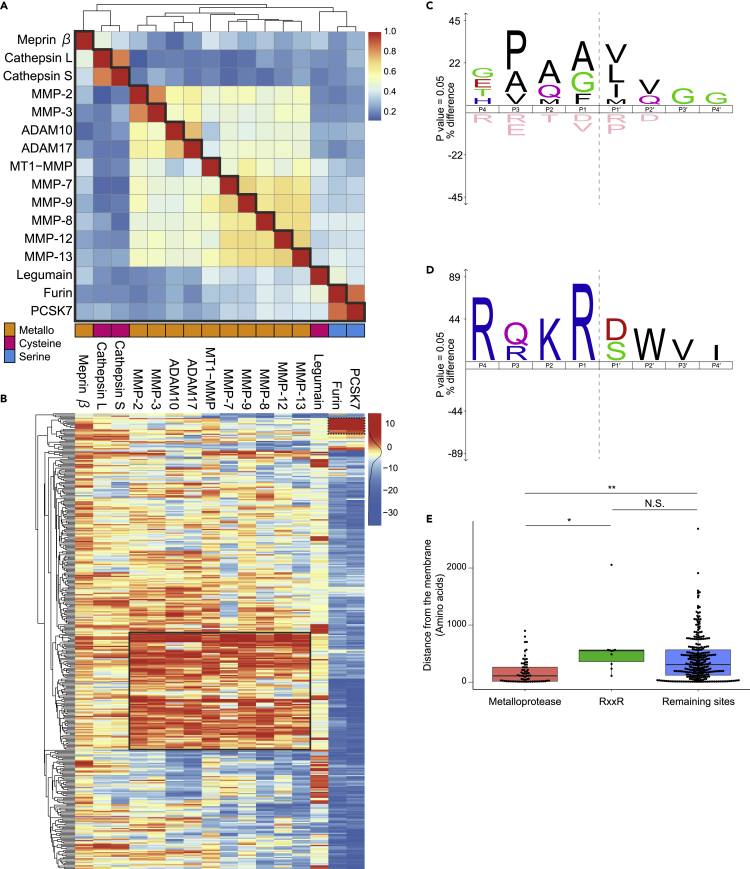
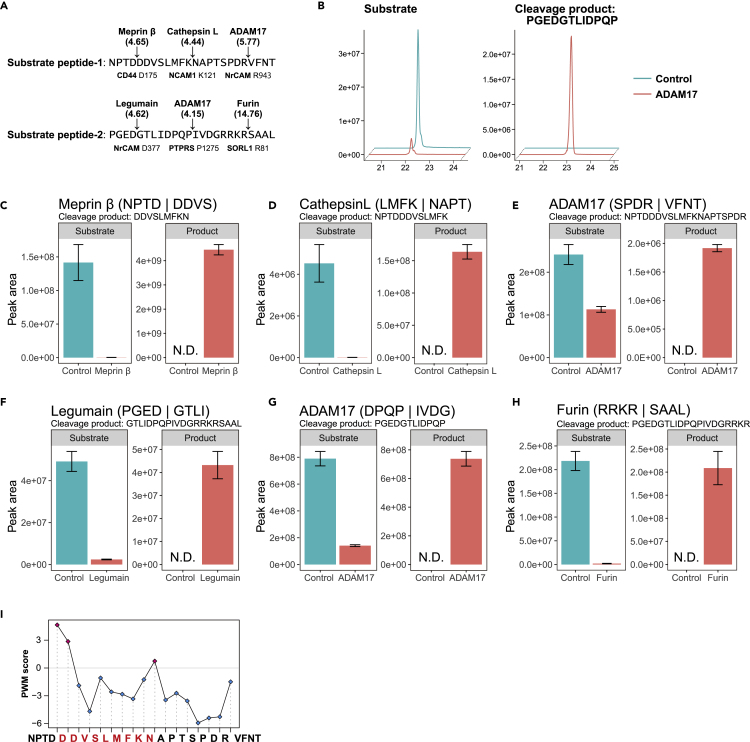
Ectodomain shedding is a proteolytic process that regulates the levels and functions of membrane proteins. Dysregulated shedding is linked to severe diseases, including cancer and Alzheimer's disease. However, the exact cleavage sites of shedding substrates remain largely unknown. Here, we explore the landscape of ectodomain shedding by generating large-scale, cell-type-specific maps of shedding cleavage sites. By means of N- and C-terminal peptide enrichment and quantitative mass spectrometry, we quantified protein termini in the culture media of 10 human cell lines and identified 489 cleavage sites on 163 membrane proteins whose proteolytic terminal fragments are downregulated in the presence of a broad-spectrum metalloprotease inhibitor. A major fraction of the presented cleavage sites was identified in a cell-type-specific manner and mapped onto receptors, cell adhesion molecules, and protein kinases and phosphatases. We confidently identified 86 cleavage sites as metalloprotease substrates by means of knowledge-based scoring.

Keywords: Cell Biology; Molecular Biology; Omics; Proteomics.


Conflict of interest statement

The authors declare no competing interests.

Figures

None
Graphical abstract
Figure 1
Figure 1
Experimental design and quantitative terminomics workflow for large-scale analysis of cleavage sites by metalloproteases (A) List of investigated cultured cell lines (10 human cancer cell lines). (B) Experimental design. Cells were treated with DMSO or BB-94 for 1 hr, followed by PMA treatment for 1 hr. Triplicate samples were prepared for each condition. (C) Workflow of sample preparation. Proteins were digested with either TrypN or LysC and trypsin. Note that N-terminal peptides were TMT-labeled after terminal peptide enrichment, while C-terminal peptide enrichment was performed following TMT-labeling. See Figures S1C and S1D for details. (D) Triplicate shedding-positive samples (PMA + DMSO) and shedding-negative samples (PMA + BB-94) were labeled as shown with TMT channels and form a 6-plexed TMT. (E) Summary of the number of quantified termini and resulting cleavage sites. The parenthesized numbers show those significantly downregulated by BB-94. All termini: the total numbers of N- or C- termini (native protein termini and proteolytic termini). Proteolytic termini: the numbers of N- or C-termini that are presumably generated by endogenous proteases. Proteolytic termini on membrane proteins: the numbers of proteolytic N- or C-termini that are mapped on membrane proteins. Cleavage sites of membrane proteins: the total number of cleavage sites presented by proteolytic N- and C-termini on membrane proteins. (F) Pie chart depicting the ratio of proteolytic termini mapped on membrane proteins in total proteolytic termini. The white areas show non-membrane proteins, and the areas highlighted with colors show membrane proteins. N, N-termini; C, C-termini.
Figure 2
Figure 2
Overview of the BB-94-downregulated proteolytic terminome in the supernatant (A) Distribution of the number of downregulated proteolytic termini mapped on membrane proteins and non-membrane proteins in the respective cell lines. (B) Enrichment analysis on GO term cellular components performed by DAVID (v8.0). The top ten significant terms are shown, with Bonferroni-adjusted p values. The parenthesized numbers show the number of proteins. (C and D) The log2-transformed ratios (BB-94/DMSO) of proteolytic termini are compared between membrane proteins and non-membrane proteins in the respective cell lines. The p values were calculated with the Wilcoxon rank-sum test and a Bonferroni adjustment was applied. ∗∗∗, p < 0.005; ∗∗, p < 0.001; ∗, p < 0.05; N.S., not significant.
Figure 3
Figure 3
Topological analysis of downregulated membrane proteins and positional analysis of the cleavage sites (A) Percentages of the various topologies of membrane proteins identified with downregulated cleavage sites. The categories of membrane proteins follow the notation in UniProt. (B) The distribution of the distance (number of amino acids) from the transmembrane domain or GPI-anchor site to the cleavage site is depicted for single-pass type-I and type-II membrane proteins and GPI-anchored proteins. The section surrounded with a red box is shown in detail above. TM: cleavage sites within the transmembrane domain. Cyto: cleavage sites within the cytoplasmic domain. (C) Relative cleavage positions of the cleavage sites within the transmembrane domain of single-pass type I and type II membrane proteins. Values represent the length (number of amino acids) from the extracellular region to the cleavage site, divided by the total length (number of amino acids) of the transmembrane domain.
Figure 4
Figure 4
Functional analysis of metalloprotease-regulated shedding substrates DAVID enrichment analysis of metalloprotease-regulated shedding substrates according to GO term biological processes (blue) and molecular functions (green). The top ten significant terms are shown, with Bonferroni-adjusted p values. The parenthesized numbers show the numbers of proteins.
Figure 5
Figure 5
Cell-type-specificity of shedding (A) The distribution of the number of cleavage sites per protein is depicted for single-pass type-I and type-II transmembrane proteins and GPI-anchored proteins. (B and C) Histograms depicting the number of shedding substrate identified in 1–10 cell lines at the cleavage site level (B) and at the protein level (C). (D) VIP36 cleavage site. The amino acids that were previously suggested to be essential for cleavage are highlighted in red (Shirakabe et al., 2011). The sequence of the peptide identified in this study is underlined. TM, transmembrane domain. (E) Heatmap depicting membrane proteins shed by cleavage at differential sites in different cell lines (36 proteins). Each gray, yellow, red, or blue box designates a cleavage site. Cleavage sites are arranged in the order from N- to C-terminus from left to right in each protein, as the example of PROCR shows. At the bottom, to visualize the boundaries of proteins, green and light-blue boxes are alternately arranged in alphabetical order of UniProt accession from left to right. (F) Distribution of the number of metalloprotease-regulated cleavage sites in the respective cell lines. The number of cleavage sites specifically identified in each cell type is highlighted in color. (G and H) Protein interaction network of shedding substrate proteins specifically identified in U-251 MG cells (G). Proteins without any interactions are excluded. Significantly enriched reactome and GO terms of interest are shown with the Benjamini-adjusted p values (H), and the proteins annotated with these terms are highlighted in color (F). All analyses were performed by STRING (v11). The network was visualized using Cytoscape (v3.8.0). Node size reflects the number of connections (direct edges), and edge line width reflects the combined score calculated by STRING.
Figure 6
Figure 6
PWM scoring of downregulated cleavage sites (A) Heatmap depicting the cosine similarity between PWMs for 16 selected sheddases shown in Figure S7. High similarity is highlighted in red, while low similarity is highlighted in blue. Sheddases are ordered by clustering based on the cosine distances (1 – cosine similarity). (B) Hierarchical clustering analysis of PWM scores. High-scored sites are highlighted in red, while low-scored sites are highlighted in blue. A cluster of cleavage sites high-scored for metalloproteases (metalloprotease cluster) and a cluster for furin and PCSK7 (RxxR cluster) are enclosed with solid-line and dashed-line boxes, respectively. (C and D) Sequence logos of cleavage sites in the metalloprotease cluster (C) and in the RxxR cluster (D) generated by iceLogo (https://iomics.ugent.be/icelogoserver/). Dashed line shows the cleavage site. (E) The distances from the transmembrane domain or GPI-anchor site to the cleavage site are compared between the metalloprotease cluster, the RxxR motif cluster, and the remaining sites. The p values were calculated with the Wilcoxon rank-sum test and Bonferroni adjustment was applied. ∗∗, p = 1.26 × 10−7; ∗, p = 8.82 × 10−4; N.S., not significant.
Figure 7
Figure 7
Validation of identified cleavage sites by in vitro assay (A) Sequences of utilized synthetic substrate peptides. The substrates were designed as the flanking ±4 residues surrounding each cleavage site. Three substrate sequences were concatenated and synthesized as a 24-mer peptide. Arrows show the tested cleavage sites and sheddases. Parenthesized numbers show PWM scores. Under the sequences, protein names are shown with the P1 amino acid number, respectively. (B) Detection of substrate and cleavage product by LC/MS is illustrated with their extracted ion chromatograms for ADAM17 and the DPQPIVDG sequence of PTPRS as an example. (C–H) The peak areas of the substrate and the cleavage product peptides are calculated. The sequence of cleavage product utilized for quantification is shown above. The experiments were done in triplicate, and the data are presented as mean ± standard error of the mean (SEM). N.D., not detected. (I) PWM scores for meprin β at respective positions of substrate peptide-1. Positive scores are highlighted in magenta and negative scores are highlighted in blue. The sequence of the cleavage product utilized for the quantification of cleavage by meprin β is highlighted in red on the x axis.

References

    1. Adachi J., Hashiguchi K., Nagano M., Sato M., Sato A., Fukamizu K., Ishihama Y., Tomonaga T. Improved proteome and phosphoproteome analysis on a cation exchanger by a combined acid and salt gradient. Anal. Chem. 2016;88:7899–7903. - PubMed
    1. Aebersold R., Agar J.N., Amster I.J., Baker M.S., Bertozzi C.R., Boja E.S., Costello C.E., Cravatt B.F., Fenselau C., Garcia B.A. How many human proteoforms are there? Nat. Chem. Biol. 2018;14:206–214. - PMC - PubMed
    1. Alpert A.J., Petritis K., Kangas L., Smith R.D., Mechtler K., Mitulović G., Mohammed S., Heck A.J.R. Peptide orientation affects selectivity in ion-exchange chromatography. Anal. Chem. 2010;82:5253–5259. - PMC - PubMed
    1. Apweiler R., Hermjakob H., Sharon N. On the frequency of protein glycosylation, as deduced from analysis of the SWISS-PROT database. Biochim. Biophys. Acta. 1999;1473:4–8. - PubMed
    1. Beard H.A., Barniol-Xicota M., Yang J., Verhelst S.H.L. Discovery of cellular roles of intramembrane proteases. ACS Chem. Biol. 2019;14:2372–2388. - PubMed