. 2020 Nov 16;3(1):fcaa200.
doi: 10.1093/braincomms/fcaa200. eCollection 2021.

Fronto-temporal dementia risk gene TMEM106B has opposing effects in different lysosomal storage disorders

Affiliations

Fronto-temporal dementia risk gene TMEM106B has opposing effects in different lysosomal storage disorders

Azucena Perez-Canamas et al. Brain Commun. .

Abstract

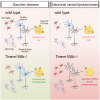
TMEM106B is a transmembrane protein localized to the endo-lysosomal compartment. Genome-wide association studies have identified TMEM106B as a risk modifier of Alzheimer's disease and frontotemporal lobar degeneration, especially with progranulin haploinsufficiency. We recently demonstrated that TMEM106B loss rescues progranulin null mouse phenotypes including lysosomal enzyme dysregulation, neurodegeneration and behavioural alterations. However, the reason whether TMEM106B is involved in other neurodegenerative lysosomal diseases is unknown. Here, we evaluate the potential role of TMEM106B in modifying the progression of lysosomal storage disorders using progranulin-independent models of Gaucher disease and neuronal ceroid lipofuscinosis. To study Gaucher disease, we employ a pharmacological approach using the inhibitor conduritol B epoxide in wild-type and hypomorphic Tmem106b-/- mice. TMEM106B depletion ameliorates neuronal degeneration and some behavioural abnormalities in the pharmacological model of Gaucher disease, similar to its effect on certain progranulin null phenotypes. In order to examine the role of TMEM106B in neuronal ceroid lipofuscinosis, we crossbred Tmem106b-/- mice with Ppt1-/-, a genetic model of the disease. In contrast to its conduritol B epoxide-rescuing effect, TMEM106B loss exacerbates Purkinje cell degeneration and motor deficits in Ppt1-/- mice. Mechanistically, TMEM106B is known to interact with subunits of the vacuolar ATPase and influence lysosomal acidification. In the pharmacological Gaucher disease model, the acidified lysosomal compartment is enhanced and TMEM106B loss rescues in vivo phenotypes. In contrast, gene-edited neuronal loss of Ppt1 causes a reduction in vacuolar ATPase levels and impairment of the acidified lysosomal compartment, and TMEM106B deletion exacerbates the mouse Ppt1-/- phenotype. Our findings indicate that TMEM106B differentially modulates the progression of the lysosomal storage disorders Gaucher disease and neuronal ceroid lipofuscinosis. The effect of TMEM106B in neurodegeneration varies depending on vacuolar ATPase state and modulation of lysosomal pH. These data suggest TMEM106B as a target for correcting lysosomal pH alterations, and in particular for therapeutic intervention in Gaucher disease and neuronal ceroid lipofuscinosis.

Keywords: Gaucher; TMEM106B; lysosome; neuronal ceroid lipofuscinosis; palmitoyl-protein thioesterase 1.


Figures

Graphical Abstract
Graphical Abstract
Figure 1
Figure 1
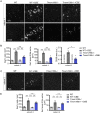
TMEM106B deficiency protects against neuronal death induced by CBE. (A) Schematic representation of experimental design. (B) Representative images of cortex in WT and Tmem106b−/− mice from cohort 1 (top panels) and cohort 2 (bottom panels), treated or not with CBE, stained with anti-NeuN antibody (neurons). Blue lines indicate layer V. Scale bars = 100μm. (C) Graphs show mean ± SEM of number of positive cells or area in the layer V of the cortex. For cohort 1, n = 5–6 mice per group; for cohort 2, n = 6–8 mice per group
Figure 2
Figure 2
TMEM106B loss is protective against microgliosis induced by CBE. (A) Representative images of cortex in WT and Tmem106b−/− mice from cohort 1, treated or not with CBE, stained with anti-Iba1 and CD68 antibodies (microglia). Scale bars = 50 μm. (B) Graphs show mean ± SEM of number and area of the soma of Iba1+ cells and CD68+ area in the layer V of the cortex. n = 5–6 mice per group. (C) Representative images of cortex in WT and Tmem106b−/− mice from cohort 2, treated or not with CBE, stained with anti-Iba1 antibody (microglia). Scale bars = 50 μm. (D) Graphs show mean ± SEM of number and area of the soma of Iba1+ cells in the layer V of the cortex. n = 6–8 mice per group
Figure 3
Figure 3
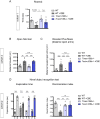
TMEM106B depletion protects against some behavioural phenotypes induced by CBE. (A) Graph shows mean ± SEM of time spent in the rotarod test in WT and Tmem106b−/− mice from cohort 1 treated or not with CBE. n = 5–6 mice per group. (B) Graph shows mean ± SEM of distance travelled in the open field test in WT and Tmem106b−/− mice from cohort 2 treated or not with CBE. n = 6–8 mice per group. (C) Graph shows mean ± SEM of distance travelled in the open arms of the elevated plus maze in WT and Tmem106b−/− mice from cohort 2 treated or not with CBE. n = 6–8 mice per group. (D) Graphs show mean ± SEM of exploration time of familiar (F) and novel (N) objects and discrimination index calculated as follows: (novel − familiar)/(novel + familiar); in the novel object recognition test in WT and Tmem106b−/− mice from cohort 2 treated or not with CBE. n = 6–8 mice per group
Figure 4
Figure 4
Loss of TMEM106B reduces survival and worsens motor phenotype in Ppt1−/− mice. (A) Survival curves of WT, Ppt1−/−, Tmem106b+/−, Tmem106b−/− and Ppt1−/−; Tmem106b+/− and Ppt1−/−; Tmem106b−/− mice. n = 8–13 mice per group. (B) Graph shows mean ± SEM of time spent in the Rotarod test. n = 8–12 mice per group. (C) Graph shows mean ± SEM of time until mice fell from the wire in the hang wire test. n = 8–12 mice per group
Figure 5
Figure 5
TMEM106B deletion accelerates neuronal death in Ppt1−/− mice, a model of infantile neuronal ceroid lipofuscinosis. (A) Representative images of anterior (I–V), mid (VI–VIII) and posterior (IX,X) cerebellar lobes stained with anti-calbindin D28k antibody in 5-month-old WT, Ppt1−/−, Tmem106b−/− and Ppt1−/−; Tmem106b−/− mice. Scale bars = 200 μm. (B) Graph shows mean ± SEM of number of calbindin-positive cells in the different cerebellar regions. n = 4–9 mice per group. (C) Representative images of Purkinje cells in 5-month-old WT, Ppt1−/−, Tmem106b−/− and Ppt1−/−; Tmem106b−/− mice stained with anti-Calbindin D28k and Lamp1 antibodies. Scale bar = 10 μm. n = 4–9 mice per group. (D) Graphs show mean ± SEM of Lamp1 area, number of particles and particle size in Purkinje cells. n = 4–7 mice per group. (E) Representative images of cerebral cortex in 5-month-old WT, Ppt1−/−, Tmem106b−/− and Ppt1−/−; Tmem106b−/− mice stained with anti-NeuN antibody. Scale bar = 100 μm. (F) Graph shows mean ± SEM of NeuN+ cells per area in the cortex. n = 5–12 mice per group. (G) Representative images of hippocampus (CA1) in 5-month-old WT, Ppt1−/−, Tmem106b−/− and Ppt1−/−; Tmem106b−/− mice stained with anti-NeuN antibody. Scale bar = 20 μm. (H) Graph shows mean ± SEM of NeuN+ cells per area in the hippocampus (CA1). n = 5–12 mice per group
Figure 6
Figure 6
TMEM106B deletion exacerbates astrogliosis in the cortex of Ppt1−/− mice. (A) Representative images of cortex in 5-month-old WT, Ppt1−/−, Tmem106b−/− and Ppt1−/−; Tmem106b−/− mice stained with anti-GFAP antibody. Scale bar = 50 μm. (B) Graphs show mean ± SEM of number of GFAP+ cells per area (right) or GFAP+ area (left) in the cortex. n = 6–12 mice per group. (C) Representative images of hippocampus (CA1) in 5-month-old WT, Ppt1−/−, Tmem106b−/− and Ppt1−/−; Tmem106b−/− mice stained with anti-GFAP antibody. Scale bar = 50 μm. (D) Graphs show mean ± SEM of number of GFAP+ cells per area (right) or GFAP+ area (left) in the hippocampus. n = 6–12 mice per group. (E) Representative images of cerebellum in 5-month-old WT, Ppt1−/−, Tmem106b−/− and Ppt1−/−; Tmem106b−/− mice stained with anti-GFAP antibody. Scale bar = 100 μm. (F) Graph shows mean ± SEM of GFAP+ area in the cerebellum. n = 6–12 mice per group
Figure 7
Figure 7
TMEM106B deletion exacerbates microgliosis in different brain regions in Ppt1−/− mice. (A) Representative images of cortex in 5-month-old WT, Ppt1−/−, Tmem106b−/− and Ppt1−/−; Tmem106b−/− mice stained with anti-Iba1 and CD68 antibodies. Scale bars = 50 μm. (B) Graphs show mean ± SEM of Iba1+ (top) or CD68+ area (bottom) in the cortex. n = 6–12 mice per group. (C) Representative images of hippocampus (CA1) in 5-month-old WT, Ppt1−/−, Tmem106b−/− and Ppt1−/−; Tmem106b−/− mice stained with anti-Iba1 and CD68 antibodies. Scale bars = 50 μm. (D) Graphs show mean ± SEM of Iba1+ (top) or CD68+ area (bottom) in the hippocampus. n = 6–12 mice per group. (E) Representative images of cerebellum in 5-month-old WT, Ppt1−/−, Tmem106b−/− and Ppt1−/−; Tmem106b−/− mice stained with anti-Iba1 and CD68 antibodies. Scale bars = 50 μm. (F) Graphs show mean ± SEM of Iba1+ (top) or CD68+ area (bottom) in the cerebellum. n = 6–12 mice per group.
Figure 8
Figure 8
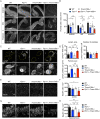
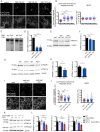
Opposite effect of CBE and PPT1 deficiency on lysosomal acidification. (A) Representative images of primary cortical cultured neurons treated with CBE for 7 days at different concentrations and stained with anti-MAP2 antibody and LysoTracker Red DND-99. Scale bar = 50 μm. (B) Graphs show mean ± SEM LysoTracker-red-DND-99-integrated fluorescence intensity and MAP2-positive area from one representative experiment. n = 36–54 images. (C) Representative agarose gel showing confirmation of Ppt1 DNA editing by T7EI digestion in cultured neurons 2 weeks after AAV2/1 infection. Cortical cultured neurons were infected with AAV2/1 expressing two single-guide Ppt1 RNA sequences (sg) at 3 DIV. (D) Ppt1 mRNA expression in cultured neurons 2 weeks after AAV2/1 infection. n = 3 independent experiments. (E) Representative immunoblots with anti-ATP6V1A and β-actin using cortical cultured neuronal lysates 2 weeks after AAV2/1 infection. Full blots for this other panels are shown in Supplementary Fig. 11. (F) Graph shows mean ± SEM of the immunoblot signal from E. n = 3 independent experiments. (G) Representative immunoblots with anti-ATP6AP1, ATP6V1A and β-actin using cortical lysates from WT and Ppt1−/− mice. (H) Graphs show mean ± SEM of the immunoblot signal from G. n = 6–9 mice per group. (I) Representative images of primary cortical cultured neurons infected with AAV2/1. Two weeks later, neurons were stained with anti-MAP2 antibody and LysoTracker Red DND-99. Scale bar = 100 μm. (J) Graphs show mean ± SEM LysoTracker-red-DND-99-integrated fluorescence intensity and MAP2-positive area from one representative experiment. n = 50–58 images. (K) Representative immunoblots with anti-ATP6AP1, ATP6V1A and ATPv0a1 and β-actin using cerebral cortex lysates from 5-month-old WT, Ppt1−/−, Tmem106b−/− and Ppt1−/−; Tmem106b−/− mice. (L) Graphs show mean ± SEM of the immunoblot signal from K. n = 6–7 mice per group

References

    1. Arrant AE, Roth JR, Boyle NR, Kashyap SN, Hoffmann MQ, Murchison CF, et al.Impaired β-glucocerebrosidase activity and processing in frontotemporal dementia due to progranulin mutations. Acta Neuropathol Commun 2019; 7: 218. - PMC - PubMed
    1. Bagh MB, Peng S, Chandra G, Zhang Z, Singh SP, Pattabiraman N, et al.Misrouting of v-ATPase subunit V0a1 dysregulates lysosomal acidification in a neurodegenerative lysosomal storage disease model. Nat Commun 2017; 8: 14612. - PMC - PubMed
    1. Busch JI, Martinez-Lage M, Ashbridge E, Grossman M, Van Deerlin VM, Hu F, et al.Expression of TMEM106B, the frontotemporal lobar degeneration-associated protein, in normal and diseased human brain. Acta Neuropathol Commun 2013; 1: 36. - PMC - PubMed
    1. Busch JI, Unger TL, Jain N, Skrinak RT, Charan RA, Chen-Plotkin AS.. Increased expression of the frontotemporal dementia risk factor TMEM106B causes C9orf72-dependent alterations in lysosomes. Hum Mol Genet 2016; 25: 2681–2697. ddw127. - PMC - PubMed
    1. Česen M, Pegan K, Špes A, Turk B.. Lysosomal pathways to cell death and their therapeutic applications. Exp Cell Res 2012; 318: 1245–51. - PubMed

LinkOut - more resources