. 2021 Mar;1(3):295-308.
doi: 10.1038/s43587-021-00044-4. Epub 2021 Mar 15.

Disparities in the pace of biological aging among midlife adults of the same chronological age have implications for future frailty risk and policy

Affiliations

Disparities in the pace of biological aging among midlife adults of the same chronological age have implications for future frailty risk and policy

Maxwell L Elliott et al. Nat Aging. 2021 Mar.

Abstract

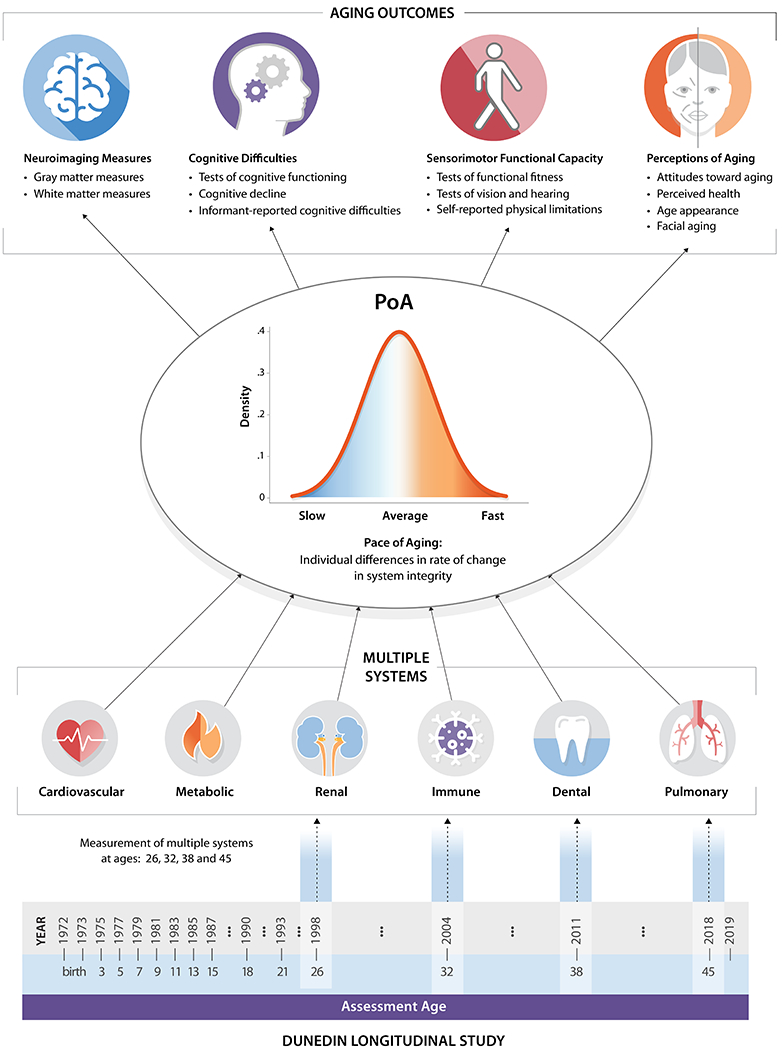
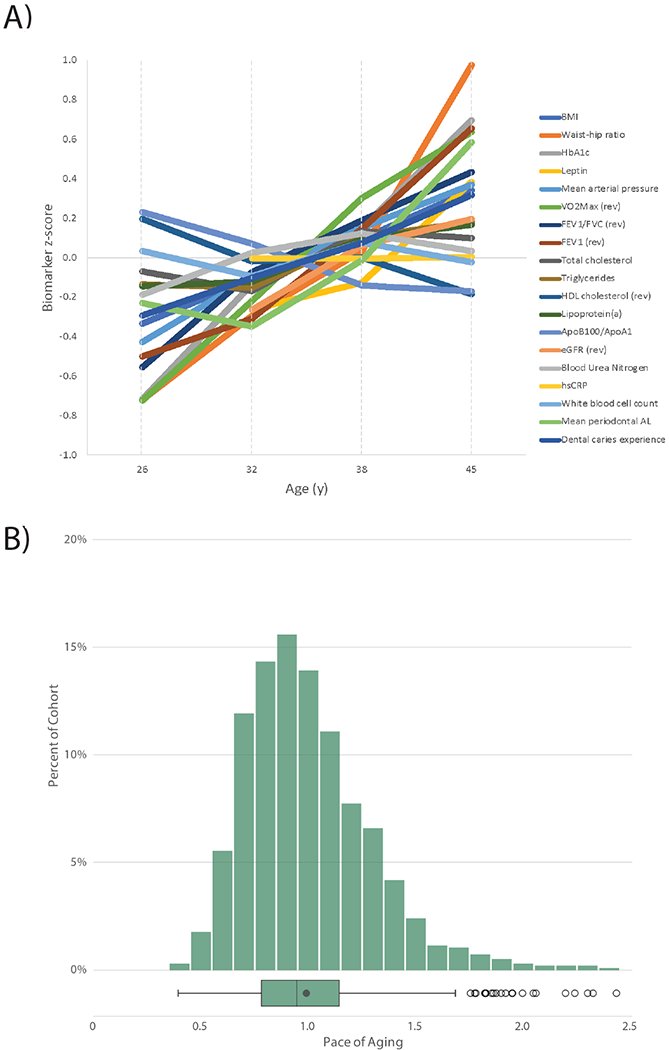
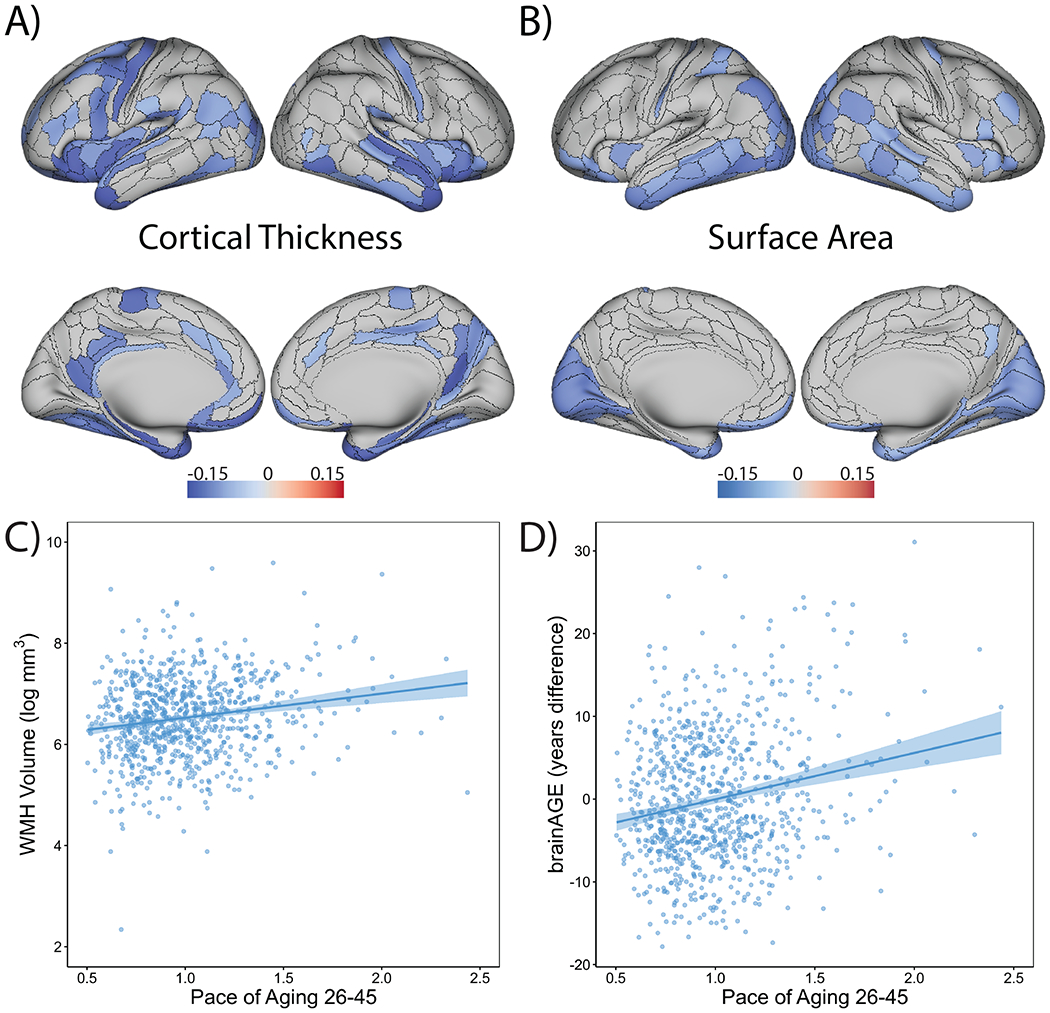
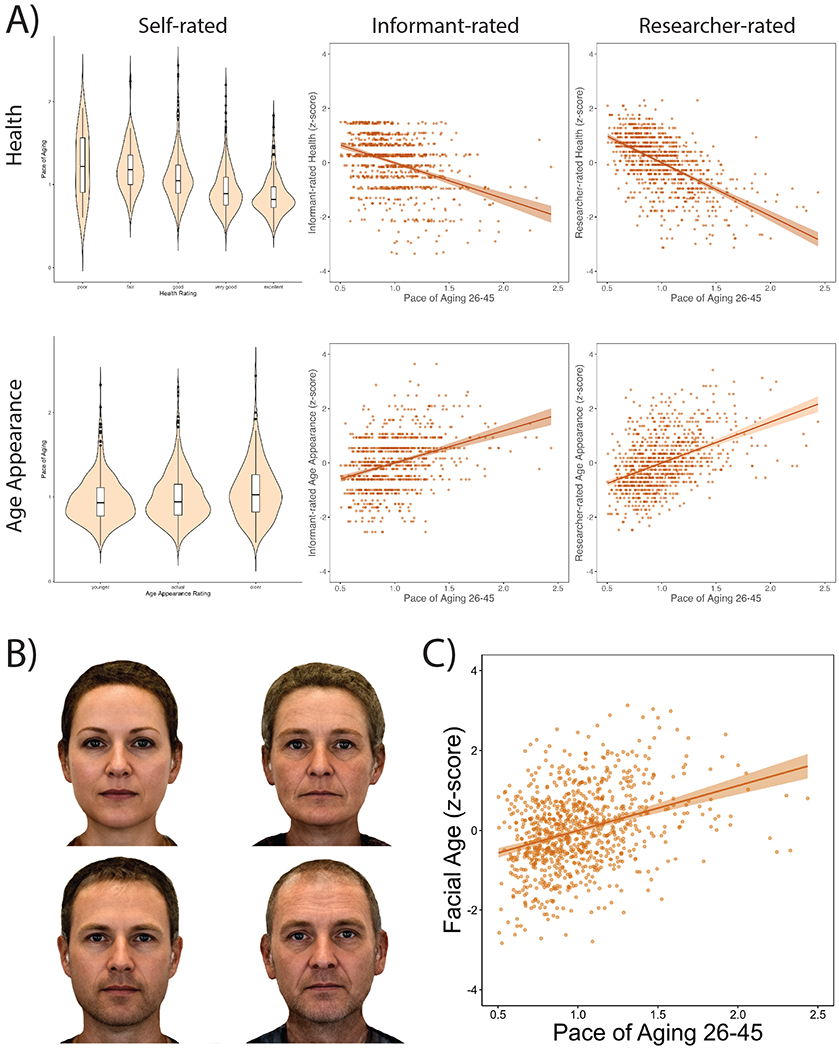
Some humans age faster than others. Variation in biological aging can be measured in midlife, but the implications of this variation are poorly understood. We tested associations between midlife biological aging and indicators of future frailty-risk in the Dunedin cohort of 1037 infants born the same year and followed to age 45. Participants' Pace of Aging was quantified by tracking declining function in 19 biomarkers indexing the cardiovascular, metabolic, renal, immune, dental, and pulmonary systems across ages 26, 32, 38, and 45 years. At age 45 in 2019, participants with faster Pace of Aging had more cognitive difficulties, signs of advanced brain aging, diminished sensory-motor functions, older appearance, and more pessimistic perceptions of aging. People who are aging more rapidly than same-age peers in midlife may prematurely need supports to sustain independence that are usually reserved for older adults. Chronological age does not adequately identify need for such supports.


Conflict of interest statement

Competing Interests The authors declare no competing interests.

Figures

Figure 1.
Figure 1.. Study design.
We studied the Pace of Aging in the Dunedin birth cohort. The timeline on the bottom of the figure visualizes the design of the Dunedin Longitudinal Study. The years of each phase of data collection and the corresponding ages are listed. The Pace of Aging was derived from measuring longitudinal changes in 19 biomarkers at 4 time points between ages 26 and 45 years. These biomarkers indexed functioning across multiple organ systems (each visualized under the heading “multiple systems”). We combined rates of changes across these biomarkers to produce a single measure termed the Pace of Aging (PoA). We then investigated associations between the Pace of Aging and aging outcomes across 4 domains at age 45: Neuroimaging measures, cognitive difficulties, sensorimotor functional capacity, and perceptions of aging.
Figure 2.
Figure 2.. Biological aging across two decades from age 26 to age 45.
A) For visualization, biomarker values were standardized to have M=0 and SD=1 across the two decades of follow-up (z-scores). Z-scores were coded so that higher values corresponded to older levels of the biomarkers. B) Pace of Aging is denominated in years of physiological change per chronological year. A Pace of Aging of one indicates a cohort member who experienced one year of physiological change per chronological year (the cohort average). A Pace of Aging of two indicates a cohort member aging at a rate of two years of physiological change per chronological year (i.e., twice as fast as the cohort average). The box plot displays the distribution of the Pace of Aging; the box borders and midline represent the 25th, 50th, and 75th percentiles, with whiskers extending to the furthest observation within the 1.5 interquartile range of the 25th and 75th percentiles. N = 955 Study members.
Figure 3.
Figure 3.. Study members who were aging faster showed signs of advanced brain aging relative to slower-aging peers.
The overlays display cortical regions (in blue) whose (A) thickness or (B) surface area are significantly associated (false discovery rate corrected, two-sided test) with Pace of Aging. Associations were tested using linear regression that was performed at each cortical region. The scatter plots show associations between Pace of Aging and (C) volume of white matter hyperintensities (WMH; n = 851) as well as (D) brainAGE (a measure of the difference between each Study member’s chronological age and their brain age as estimated from a machine-learning algorithm that was trained to predict chronological age from gray- and white-matter measures in independent samples ranging in age from 19 to 82; n = 868). Scatterplots include the mean regression line +/− 1 SEM.
Figure 4.
Figure 4.. Study members who were aging faster were perceived as less healthy and looking older when compared to slower-aging peers.
(A) Associations between the Pace of Aging and self-reported health (n = 927) and age appearance (n = 892), informant rated health (n = 881) and age appearance (n = 881), and research worker rated health (n = 930) and age appearance (n = 930). Violin/box plots show the distribution of the Pace of Aging at each self-rating; the box borders and midline represent the 25th, 50th, and 75th percentiles, with whiskers extending to the furthest observation within 1.5 interquartile ranges of the 25th and 75th percentiles. (B) Digitally averaged composite faces made up of the ten male and female Study members with the youngest (left) and oldest (right) facial age ratings. (C) Scatterplot of the association between Pace of Aging and facial age ratings by independent raters (n = ). Scatterplots include the mean regression line +/− 1 SEM. All graphs are adjusted for sex.

Comment in

  • Youthfulness begins in youth.
    Jagust WJ. Jagust WJ. Nat Aging. 2021 Mar;1(3):239-240. doi: 10.1038/s43587-021-00048-0. Nat Aging. 2021. PMID: 37118409 No abstract available.

References

    1. Vos T et al. Years lived with disability (YLDs) for 1160 sequelae of 289 diseases and injuries 1990–2010: A systematic analysis for the Global Burden of Disease Study 2010. Lancet 380, 2163–2196 (2012). - PMC - PubMed
    1. Crimmins EM Lifespan and healthspan: Past, present, and promise. Gerontologist (2015). doi:10.1093/geront/gnv130 - DOI - PMC - PubMed
    1. Kaeberlein M Longevity and aging. F1000Prime Rep. 5, 1–8 (2013). - PMC - PubMed
    1. Kirkwood TBL Understanding the odd science of aging. Cell 120, 437–447 (2005). - PubMed
    1. Gladyshev VN Aging: progressive decline in fitness due to the rising deleteriome adjusted by genetic, environmental, and stochastic processes. Aging Cell 15, 594–602 (2016). - PMC - PubMed

Publication types

LinkOut - more resources