

Whole-genome sequencing reveals new Alzheimer's disease-associated rare variants in loci related to synaptic function and neuronal development
- PMID: 33797837
- PMCID: PMC8519060
- DOI: 10.1002/alz.12319
Whole-genome sequencing reveals new Alzheimer's disease-associated rare variants in loci related to synaptic function and neuronal development
Abstract
Introduction: Genome-wide association studies have led to numerous genetic loci associated with Alzheimer's disease (AD). Whole-genome sequencing (WGS) now permits genome-wide analyses to identify rare variants contributing to AD risk.
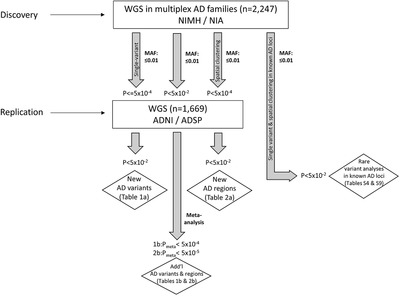
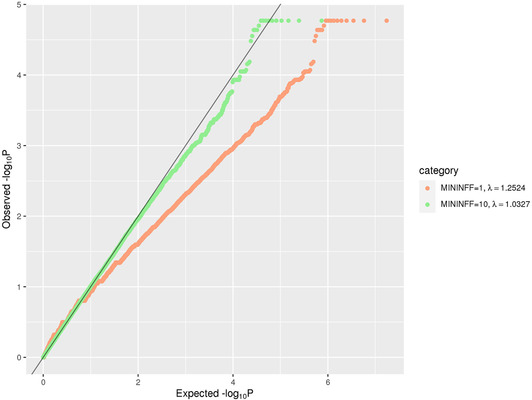
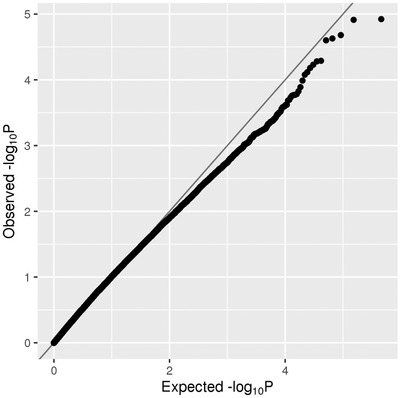
Methods: We performed single-variant and spatial clustering-based testing on rare variants (minor allele frequency [MAF] ≤1%) in a family-based WGS-based association study of 2247 subjects from 605 multiplex AD families, followed by replication in 1669 unrelated individuals.
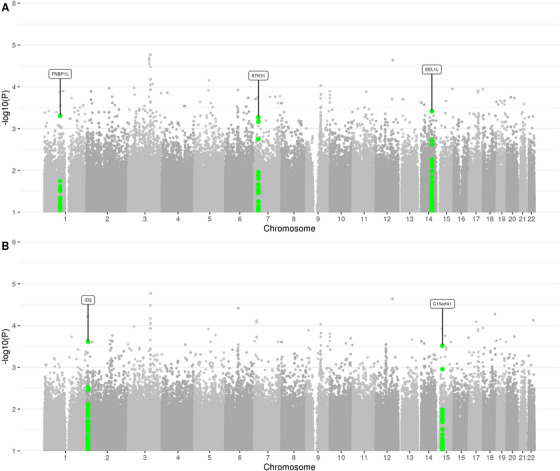
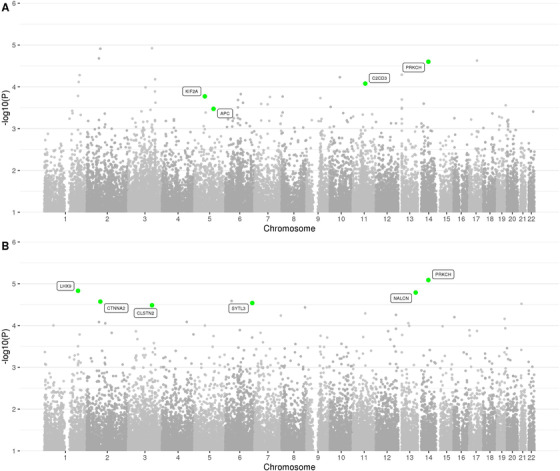
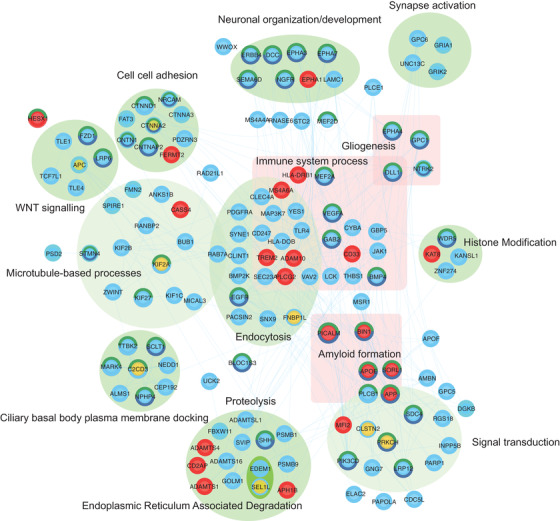
Results: We identified 13 new AD candidate loci that yielded consistent rare-variant signals in discovery and replication cohorts (4 from single-variant, 9 from spatial-clustering), implicating these genes: FNBP1L, SEL1L, LINC00298, PRKCH, C15ORF41, C2CD3, KIF2A, APC, LHX9, NALCN, CTNNA2, SYTL3, and CLSTN2.
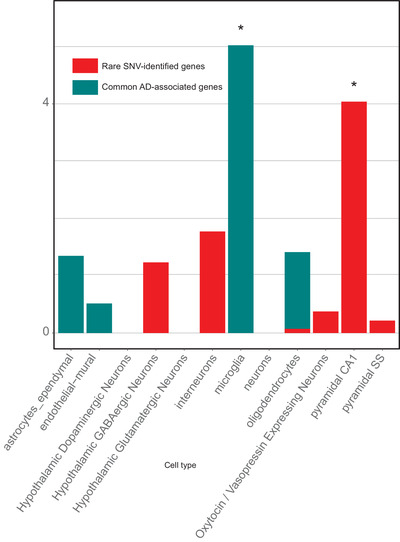
Discussion: Downstream analyses of these novel loci highlight synaptic function, in contrast to common AD-associated variants, which implicate innate immunity and amyloid processing. These loci have not been associated previously with AD, emphasizing the ability of WGS to identify AD-associated rare variants, particularly outside of the exome.
Keywords: Alzheimer's disease; LOAD; RVAS; family-based association study; neuronal development; rare variants; synaptic function; whole-genome sequencing.
© 2021 The Authors. Alzheimer's & Dementia published by Wiley Periodicals LLC on behalf of Alzheimer's Association.
Figures
Update of
-
Whole-genome sequencing reveals new Alzheimer's disease-associated rare variants in loci related to synaptic function and neuronal development.medRxiv [Preprint]. 2020 Nov 4:2020.11.03.20225540. doi: 10.1101/2020.11.03.20225540. medRxiv. 2020. Update in: Alzheimers Dement. 2021 Sep;17(9):1509-1527. doi: 10.1002/alz.12319. PMID: 33173892 Free PMC article. Updated. Preprint.
References
Publication types
MeSH terms
Substances
Grants and funding
- P30 AG010124/AG/NIA NIH HHS/United States
- P30 AG028377/AG/NIA NIH HHS/United States
- DH_/Department of Health/United Kingdom
- P50 AG008702/AG/NIA NIH HHS/United States
- P30 AG066462/AG/NIA NIH HHS/United States
- P50 AG005138/AG/NIA NIH HHS/United States
- P30AG010133/GF/NIH HHS/United States
- P50AG08702/GF/NIH HHS/United States
- R01MH060009 (RET)/GF/NIH HHS/United States
- P30 AG010133/AG/NIA NIH HHS/United States
- U24 AG021886/AG/NIA NIH HHS/United States
- P30AG028377/GF/NIH HHS/United States
- R01 MH060009/MH/NIMH NIH HHS/United States
- PO1AG05138/GF/NIH HHS/United States
- U24 AG026395/AG/NIA NIH HHS/United States
LinkOut - more resources
Full Text Sources
Other Literature Sources
Medical
Miscellaneous
