

Dosimetric impact of range uncertainty in passive scattering proton therapy
- PMID: 33797840
- PMCID: PMC8130244
- DOI: 10.1002/acm2.13179
Dosimetric impact of range uncertainty in passive scattering proton therapy
Abstract
Purpose: The objective of this study was to investigate the dosimetric impact of range uncertainty in a large cohort of patients receiving passive scatter proton therapy.
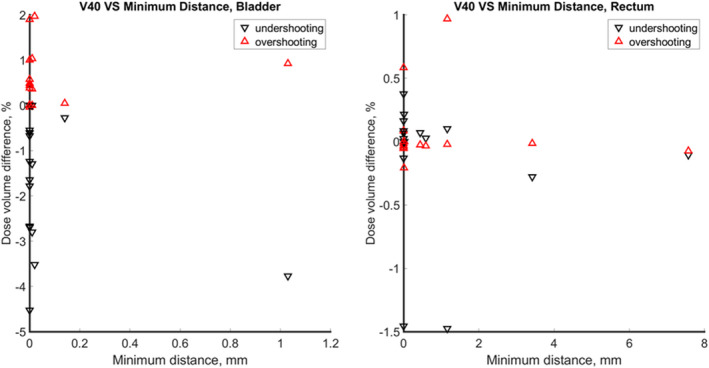
Methods: A cohort of 120 patients were reviewed in this study retrospectively, of which 61 were brain, 39 lung, and 20 prostate patients. Range uncertainties of ±3.5% (overshooting and undershooting by 3.5%, respectively) were added and recalculated on the original plans, which had been planned according to our clinical planning protocol while keeping beamlines, apertures, compensators, and dose grids intact. Changes in the coverage on CTV and DVH for critical organs were compared and analyzed. Correlation between dose change and minimal distance between CTV and critical organs were also investigated.
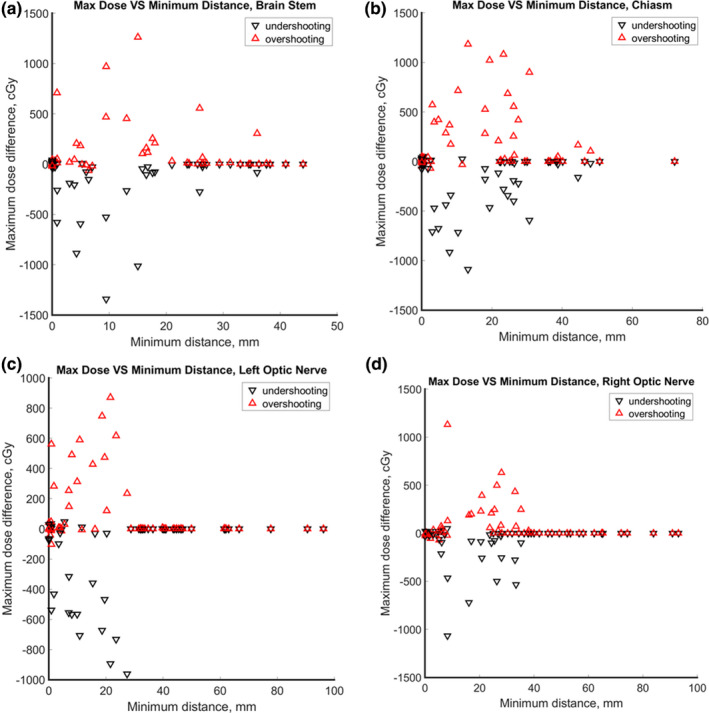
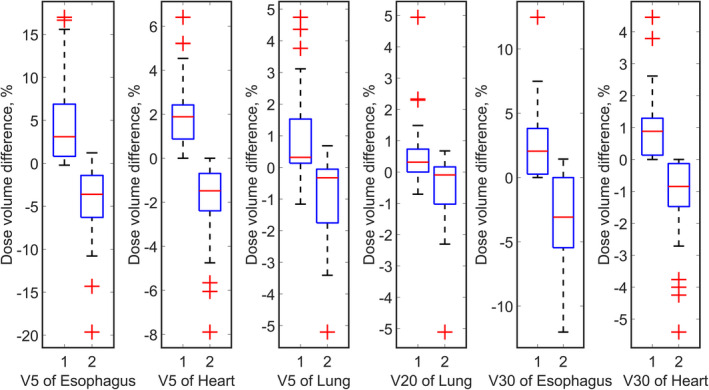
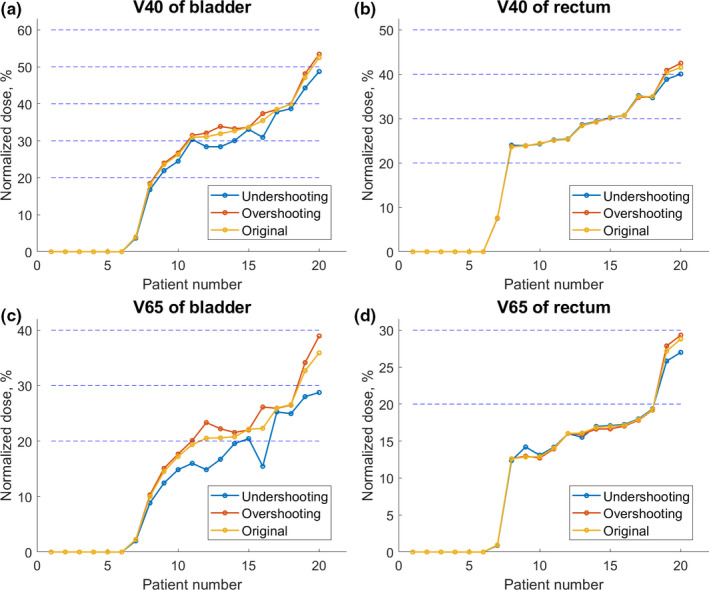
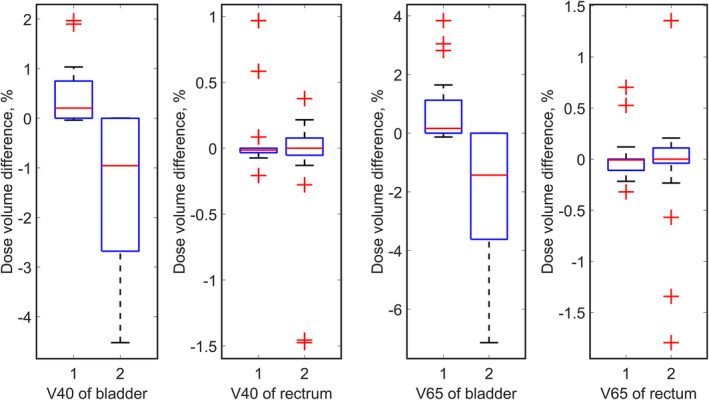
Results: Although CTV coverages and maximum dose to critical organs were largely maintained for most brain patients, large variations over 5% were still observed sporadically. Critical organs, such as brainstem and chiasm, could still be affected by range uncertainty at 4 cm away from CTV. Coverage and OARs in lung and prostate patients were less likely to be affected by range uncertainty with very few exceptions.
Conclusion: The margin recipe in modern TPS leads to clinically acceptable OAR doses in the presence of range uncertainties. However, range uncertainties still pose a noticeable challenge for small but critical serial organs near tumors, and occasionally for large parallel organs that are located distal to incident proton beams.
Keywords: dose calculation; passive scatter proton therapy; proton range uncertainty; retrospective study.
© 2021 The Authors. Journal of Applied Clinical Medical Physics published by Wiley Periodicals, Inc. on behalf of American Association of Physicists in Medicine.
Figures


References
-
- Bush DA. Proton radiation therapy for lung cancer: is there enough evidence? Oncology (Williston Park). 2010;24:1052–1057. http://www.ncbi.nlm.nih.gov/pubmed/21155458 - PubMed
-
- Chang JY, Zhang X, Wang X, et al. Significant reduction of normal tissue dose by proton radiotherapy compared with three‐dimensional conformal or intensity‐modulated radiation therapy in Stage I or Stage III non‐small‐cell lung cancer. Int J Radiat Oncol Biol Phys. 2006;65:1087–1096. - PubMed
-
- Combs SE, Kessel K, Habermehl D, Haberer T, Jäkel O, Debus J. Proton and carbon ion radiotherapy for primary brain tumors and tumors of the skull base. Acta Oncol. (Madr). 2013;52:1504–1509. - PubMed
-
- Li J, Yu J‐M, Liu S‐W, et al. Dose distributions of proton beam therapy for hepatocellular carcinoma: a comparative study of treatment planning with 3D‐conformal radiation therapy or intensity‐modulated radiation therapy. Zhonghua Yi Xue Za Zhi. 2009;89:3201–3206. http://www.ncbi.nlm.nih.gov/pubmed/20193534 - PubMed
MeSH terms
Grants and funding
LinkOut - more resources
Full Text Sources
Other Literature Sources
