. 2021 May;20(5):e13349.
doi: 10.1111/acel.13349. Epub 2021 Apr 2.

Epigenetic clock and methylation study of oocytes from a bovine model of reproductive aging

Affiliations

Epigenetic clock and methylation study of oocytes from a bovine model of reproductive aging

Paweł Kordowitzki et al. Aging Cell. 2021 May.

Abstract

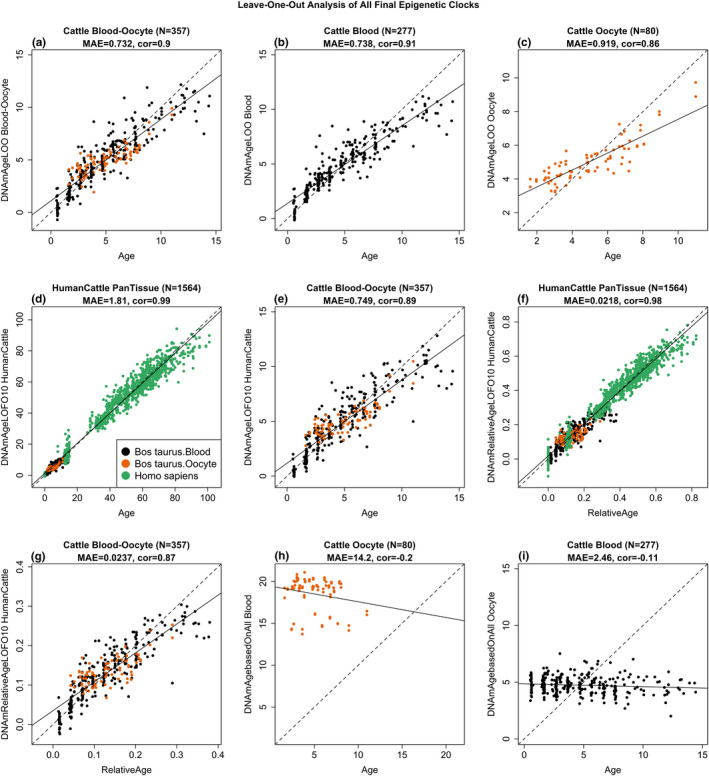
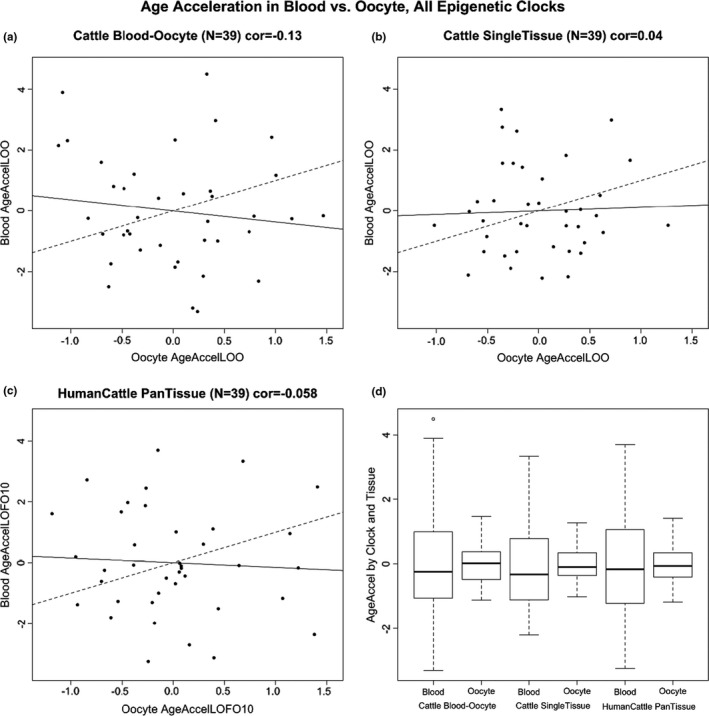
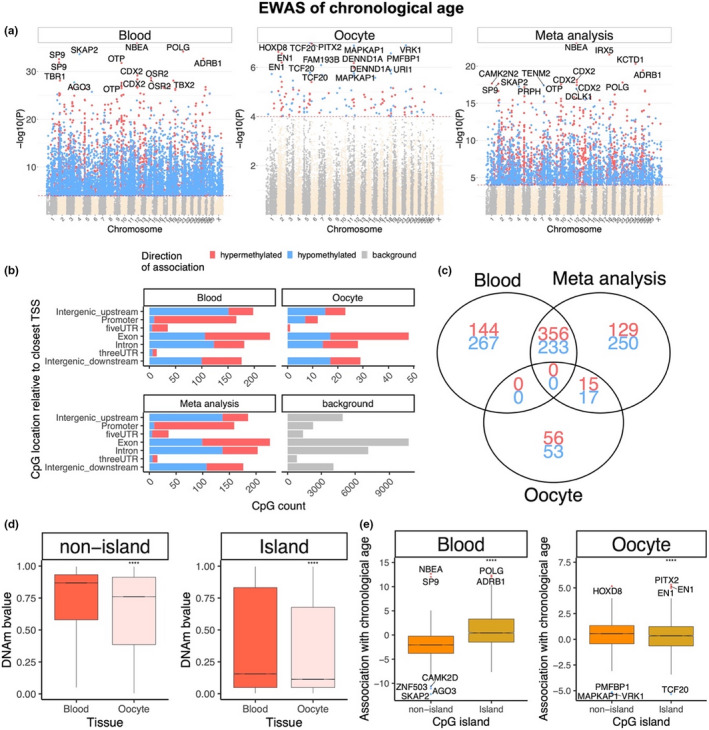
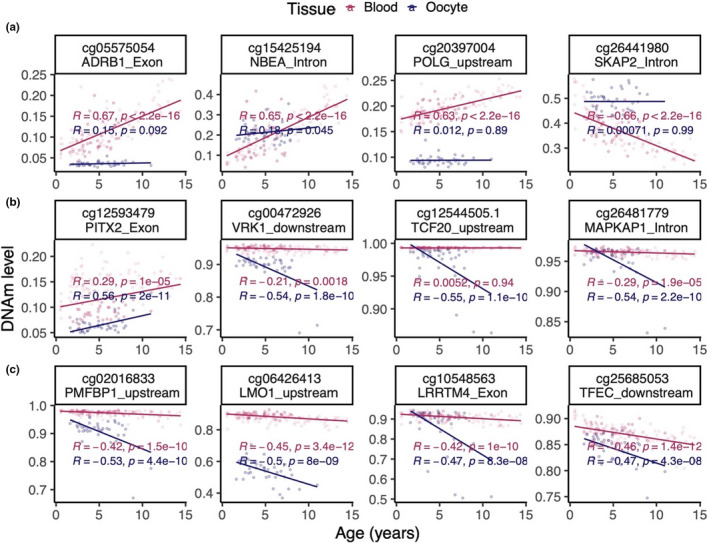
Cattle are an attractive animal model of fertility in women due to their high degree of similarity relative to follicle selection, embryo cleavage, blastocyst formation, and gestation length. To facilitate future studies of the epigenetic underpinnings of aging effects in the female reproductive axis, several DNA methylation-based biomarkers of aging (epigenetic clocks) for bovine oocytes are presented. One such clock was germane to only oocytes, while a dual-tissue clock was highly predictive of age in both oocytes and blood. Dual species clocks that apply to both humans and cattle were also developed and evaluated. These epigenetic clocks can be used to accurately estimate the biological age of oocytes. Both epigenetic clock studies and epigenome-wide association studies revealed that blood and oocytes differ substantially with respect to aging and the underlying epigenetic signatures that potentially influence the aging process. The rate of epigenetic aging was found to be slower in oocytes compared to blood; however, oocytes appeared to begin at an older epigenetic age. The epigenetic clocks for oocytes are expected to address questions in the field of reproductive aging, including the central question: how to slow aging of oocytes.

Keywords: DNA methylation; epigenetic clock; epigenome-wide association study; oocytes; reproductive aging.


Conflict of interest statement

SH is a founder of the non‐profit Epigenetic Clock Development Foundation which plans to license several patents from his employer UC Regents. These patents list SH as inventor. The other authors declare no conflicts of interest.

Figures

FIGURE 1
FIGURE 1
Cross‐validation study of epigenetic clocks for cattle and humans. (a) Blood‐oocyte clock for cattle applied to blood and oocytes, (b) Cattle clock for blood, (c) Cattle clock for oocytes. Chronological age (x‐axis, in units of years) versus the leave‐one‐sample‐out (LOO) estimate of DNA methylation age (y‐axis, in units of years). Dots are colored by tissue type (orange = oocytes, black = blood). (d, e) Ten‐fold cross‐validation analysis of the human‐cattle clock for (chronological) age applied (d) to samples from both species and to (e) to cattle only. (f, g) Human‐cattle clock estimate of relative age defined as the ratio of chronological age to the maximum life span of the respective species. Ten‐fold cross‐validation estimates of age (y‐axis, in years) in (d, f) Human (green) and cattle (orange) samples and (e, g) cattle samples only (colored by tissue type). Each panel reports the sample size, correlation coefficient, median absolute error (MAE). (h) Cattle blood clock applied to oocytes from cattle. (i) Cattle oocyte clock applied to blood samples from cattle
FIGURE 2
FIGURE 2
Epigenetic age acceleration in cattle blood is not correlated with that in oocytes. (a‐b) Cross‐validation estimates of epigenetic age acceleration in blood versus epigenetic age acceleration in oocytes. Dashed line indicates the diagonal line (y = x). The solid line corresponds to the regression line. (a) Results for the multi‐tissue cattle clock. (b) Single‐tissue clocks for oocytes (x‐axis) and blood (y‐axis). (c) Human‐cattle clock of chronological age. (d) Boxplots of epigenetic age acceleration in blood or oocytes for different cattle clocks
FIGURE 3
FIGURE 3
Blood and oocyte have distinct age‐dependent DNA methylation changes. (a) Manhattan plots of the EWAS of chronological age. The coordinates are estimated based on the alignment of Mammalian array probes to the Bos_taurus.ARS‐UCD1.2 genome assembly. The red dotted line corresponds to a significance threshold of p < 10−4. Individual CpGs are colored in red or blue if they gain or lose methylation with age. The 15 most significant CpGs are labeled by neighboring genes. (b) Location of top CpGs in each tissue is relative to the closest transcriptional start site. Top CpGs were selected (p < 10−4) and further filtering based on z score of association with chronological age for a maximum 500 in each direction (positive and negative). The number of selected CpGs: blood, 1000; oocyte, 141; meta‐analysis, 1000. The gray color in the last panel represents the location of 31,252 mammalian BeadChip array probes mapped to Bos_taurus.ARS‐UCD1.2 genome. (c) Venn diagram representing the overlap of aging‐associated CpGs based on meta‐analysis or individual tissues. (d) Comparison of DNAm by CpG island status in blood and. Oocytes have generally lower DNAm levels in island and non‐island CpGs than blood. (e) Boxplot of age correlation test Z statistics versus CpG island status in blood and oocytes. The mean difference was examined by t test. ****p < 1e‐4
FIGURE 4
FIGURE 4
Scatter plots of the most significantly age‐associated CpGs in cattle blood and oocytes. (a) Top four DNAm age changes in aging blood. cg15425194 and cg05575054 were also identified by meta‐analysis. (b) Top DNAm age changes in aging oocytes. (c) Additional DNAm changes identified by meta‐analysis
FIGURE 5
FIGURE 5
DNAm aging has low correlation between blood and oocyte. (a) Sector plot of DNAm aging in blood and oocyte samples. The red lines indicate p < 1e‐4 in each EWAS. The black dots are the CpGs with differential aging pattern between blood and oocyte. The CpGs with significant divergent aging pattern are colored blue and labeled by gene symbol. (b) Scatter plot of top four CpGs with divergent DNAm aging pattern

References

    1. Adams, G. P. , Singh, J. , & Baerwald, A. R. (2012). Large animal models for the study of ovarian follicular dynamics in women. Theriogenology, 78, 1733–1748. 10.1016/j.theriogenology.2012.04.010 - DOI - PubMed
    1. Arneson, A. , Haghani, A. , Thompson, M. J. , Pellegrini, M. , Kwon, S. B. , Vu, H. , Li, C. Z. , Lu, A. T. , Barnes, B. , Hansen, K. D. , Zhou, W. , Breeze, C. E. , Ernst, J. , & Horvath, S. (2021). A mammalian methylation array for profiling methylation levels at conserved sequences. bioRxiv. https://www.biorxiv.org/content/10.1101/2021.01.07.425637v1 - DOI - PMC - PubMed
    1. Baired, D. T. , Collins, J. , Egozcue, J. , Evers, L. H. , Gianaroli, L. , Leridon, H. , Sunde, A. , Templeton, A. , Van Steirteghem, A. , Cohen, J. , Crosignani, P. G. , Devroey, P. , Diedrich, K. , Fauser, B. C. , Fraser, L. , Glasier, A. , Liebaers, I. , Mautone, G. , Penney, G. , & Tarlatzis, B. (2005). Fertility and ageing. Human Reproduction Update, 11(3), 261–276. 10.1093/humupd/dmi006 - DOI - PubMed
    1. Chamani, I. J. , & Keefe, D. L. (2019). Epigenetics and female reproductive aging. Frontiers in Endocrinology, 10, 473. 10.3389/fendo.2019.00473 - DOI - PMC - PubMed
    1. Eriksen, M. B. , Nielsen, M. F. , Brusgaard, K. et al Genetic Alterations within the DENND1A Gene in Patients with Polycystic Ovary Syndrome (PCOS). PLoS ONE, 8(9), e77186. 10.1371/journal.pone.0077186 - DOI - PMC - PubMed

Publication types

LinkOut - more resources