Review
. 2021 Apr 1;108(4):549-563.
doi: 10.1016/j.ajhg.2021.03.009.

A catalog of GWAS fine-mapping efforts in autoimmune disease

Affiliations
Review

A catalog of GWAS fine-mapping efforts in autoimmune disease

Minal Caliskan et al. Am J Hum Genet. .

Abstract

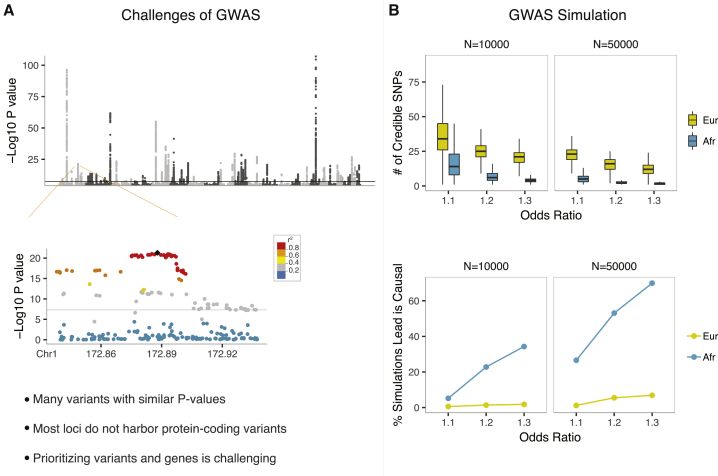
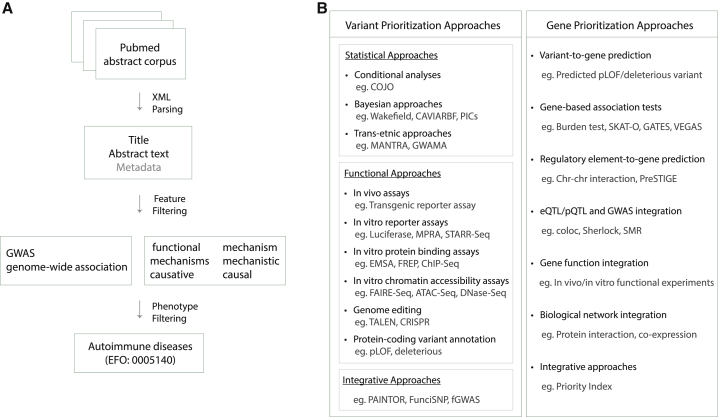
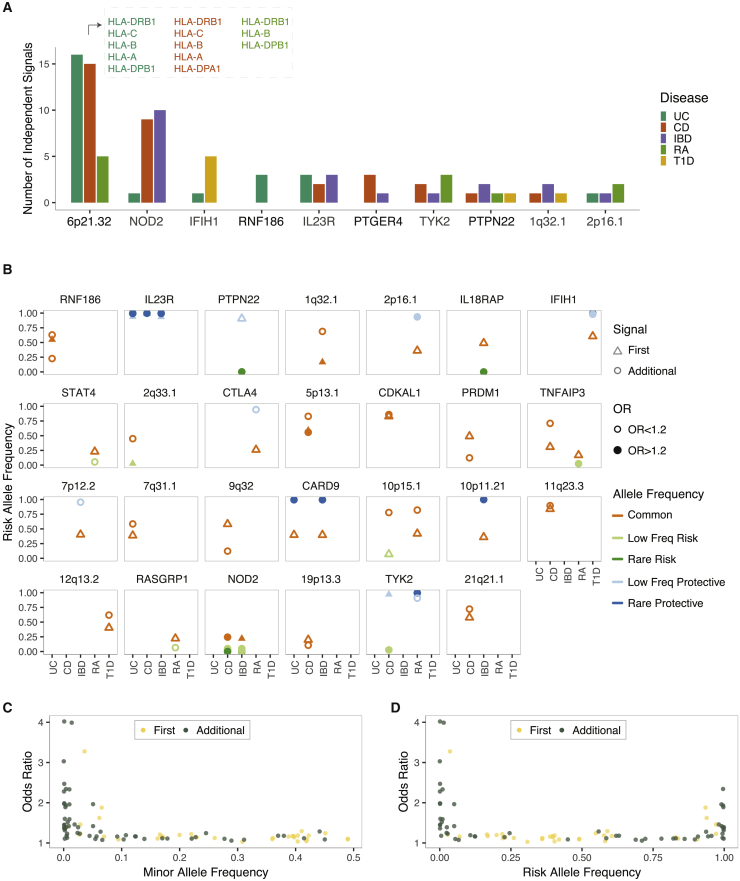
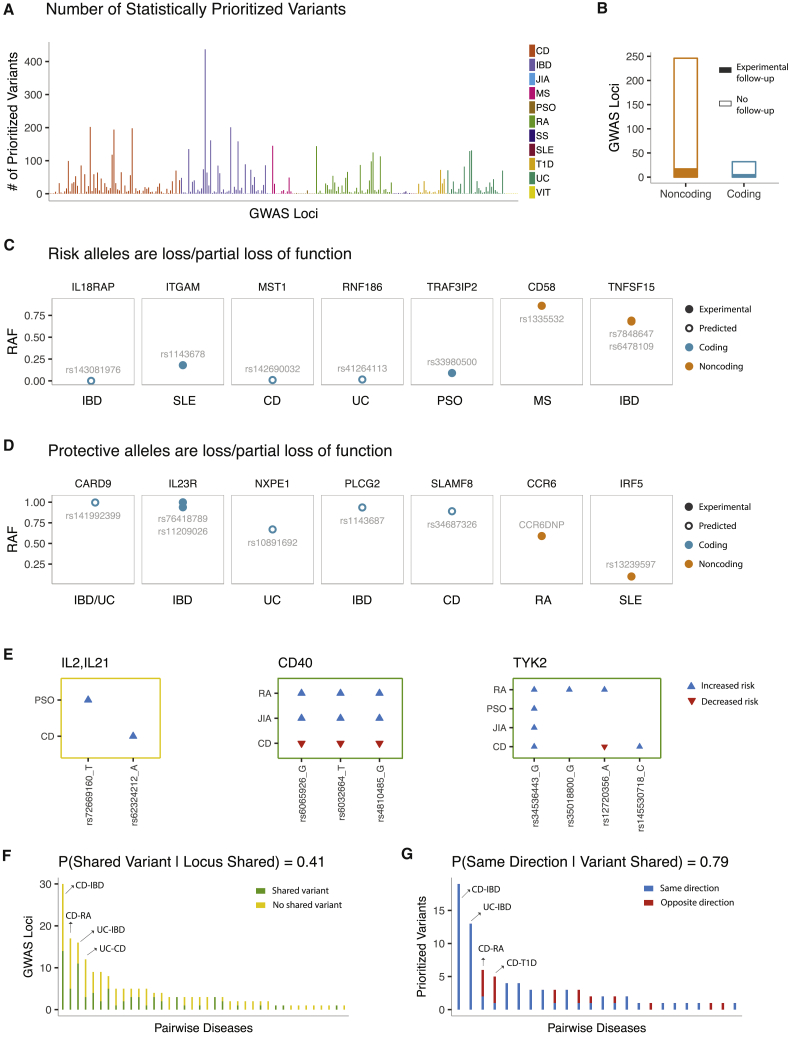
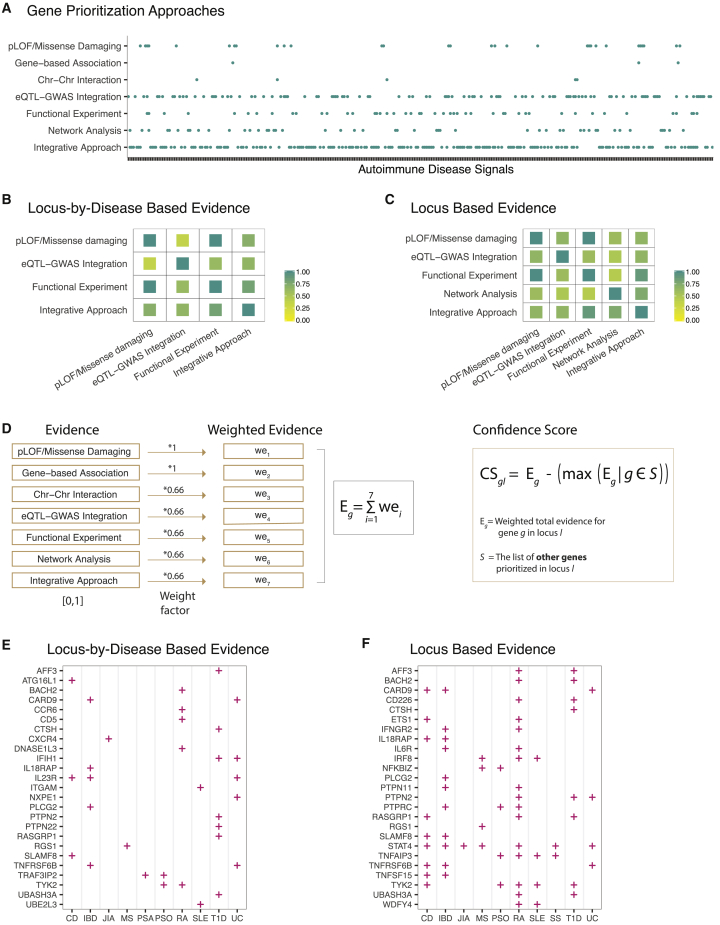
Genome-wide association studies (GWASs) have enabled unbiased identification of genetic loci contributing to common complex diseases. Because GWAS loci often harbor many variants and genes, it remains a major challenge to move from GWASs' statistical associations to the identification of causal variants and genes that underlie these association signals. Researchers have applied many statistical and functional fine-mapping strategies to prioritize genetic variants and genes as potential candidates. There is no gold standard in fine-mapping approaches, but consistent results across different approaches can improve confidence in the fine-mapping findings. Here, we combined text mining with a systematic review and formed a catalog of 85 studies with evidence of fine mapping for at least one autoimmune GWAS locus. Across all fine-mapping studies, we compiled 230 GWAS loci with allelic heterogeneity estimates and predictions of causal variants and trait-relevant genes. These 230 loci included 455 combinations of locus-by-disease association signals with 15 autoimmune diseases. Using these estimates, we assessed the probability of mediating disease risk associations across genes in GWAS loci and identified robust signals of causal disease biology. We predict that this comprehensive catalog of GWAS fine-mapping efforts in autoimmune disease will greatly help distill the plethora of information in the field and inform therapeutic strategies.


Conflict of interest statement

M.C. is an employee of Bristol-Myers Squibb. J.C.M. is an employee and a shareholder of Bristol-Myers Squibb. C.D.B. declares no competing interests.

Figures

Figure 1
Figure 1
Challenges of GWASs (A) An example Manhattan plot displaying Crohn disease GWAS p values. The zoomed-in plot of the chr 1q24.3 locus illustrates the correlation between variants (r2) and association p values. (B) The upper figure shows the number of statistically prioritized (95% credible SNP set) variants based on 1,000 simulations under different odds-ratio, sample-size, and ethnicity scenarios. The lower figure shows the percentage of simulations that identified the assigned causal variant as the lead variant. Haplotypes were constructed from 1000 Genomes European (CEU, TSI, FIN, GBR, and IBS) or African (YRI, LWK, GWD, MSL, ESN, ASW, and ACB) subjects. Common genetic variants (MAF > 0.01) across 100 kb region in the chr 1q24.3 locus shown in Figure 1A were included in haplotype construction. Among observed credible SNP set variants, a randomly chosen SNP was assigned as the causal variant for simulation purposes. GWAS p values were simulated with the simGWAS package under different odds-ratio, sample-size, and ethnicity scenarios. 95% credible SNP sets were calculated as implemented in the coloc package. Numbers of credible SNP set variants in each simulation and the percentage of simulations that identified the assigned causal SNP as the lead SNP were plotted.
Figure 2
Figure 2
A catalog of autoimmune GWAS fine-mapping efforts (A) Approach used to identify manuscripts that are most likely on the autoimmune GWAS fine-mapping topic. PubMed abstracts published between January 2005 and January 2020 were retrieved from the National Library of Medicine. There were 9,744 manuscripts following feature (GWAS and fine-mapping terms) filtering and 837 manuscripts following autoimmune disease filtering. (B) The list of causal-variant and gene-prioritization approaches that were assessed during review and identification of autoimmune GWAS fine-mapping studies.
Figure 3
Figure 3
The extent of allelic heterogeneity in complex autoimmune diseases (A) Example GWAS loci where allelic heterogeneity was reported for at least one autoimmune disease. (B) Risk-allele frequency and effect size of the first and additional signals in non-HLA loci with allelic heterogeneity. Gene names are included only when a single gene was predominantly reported as the candidate trait-relevant gene in the literature. Note that the HLA locus is not included because of the complexity of the locus and that there are inconsistencies in how genetic associations in this locus were reported (i.e, reporting was at the haplotype level, amino acid level, and nucleotide level). Common-allele frequency (AF), AF > 0.1; low-allele frequency, 0.01 < AF < 0.1; and rare-allele frequency, AF < 0.01. Abbreviations are as follows: UC, ulcerative colitis; CD, Crohn disease; IBD, inflammatory bowel disease; RA, rheumatoid arthritis; T1D, and type 1 diabetes. (C) The relationship between odds ratios and minor-allele frequencies. (D) The relationship between odds ratios and risk-allele frequencies.
Figure 4
Figure 4
An overview of the candidate causal variants in autoimmune GWAS loci (A) Number of prioritized variants based on statistical estimates across all locus-by-disease combinations. (B) Locus-by-disease combinations stratified by whether a predicted damaging protein-coding variant was prioritized (n = 32) or not (n = 246). 22 signals (7 protein-coding, 15 non-coding) in total were experimentally followed up on. (C) Example gene-disease pairs where loss- or partial-loss-of-function alleles increase risk of autoimmune disease. (D) Example gene-disease pairs where loss- or partial-loss-of-function alleles protect against autoimmune disease. (E) Example loci with discordance in the set of prioritized variant(s) or direction of genotype effect on the risk of different autoimmune diseases. (F) The x axis shows the 38 pairwise autoimmune disease combinations for which at least one GWAS locus is shared and fine-mapped for both diseases. The y axis shows the number of loci that harbor at least one shared prioritized variant (green) versus the number of loci that do not harbor any shared prioritized variant (yellow). (G) The x axis shows the 24 pairwise autoimmune disease combinations that share at least one prioritized variant in at least one locus. The y axis shows the number of shared variant(s) that have the same direction of effect on both diseases (blue) versus the number of variants with opposite direction of effect on each disease (red). Note that when multiple prioritized variants overlapped for two diseases, only one variant per each independent association signal was included during assessment of the direction of effect.
Figure 5
Figure 5
An integrated approach to assigning confidence scores to candidate-gene estimates (A) Gene-prioritization evidence compiled for 342 combinations of locus-by-disease association signals across 191 unique loci and 15 autoimmune diseases. Detailed information about each locus and fine-mapping evidence are included in Table S8. (B) This heatmap shows the frequency of at least one overlapping gene when the same locus-by-disease combination was dissected via multiple strategies. Results were plotted for pairwise strategies that co-dissected at least five locus-by-disease combinations. (C) This heatmap shows the frequency of at least one overlapping gene when the same autoimmune disease locus was dissected via multiple strategies. Results were plotted for pairwise strategies that co-dissected at least five autoimmune-disease loci. (D) Integration of gene-prioritization approaches to calculating confidence scores. (E) Top 25 prioritized genes when each autoimmune disease was considered individually (i.e., gene prioritization evidence of each disease was integrated separately even when multiple autoimmune diseases had GWAS signals and genes prioritized in the same locus). (F) Top 25 prioritized genes from disease agnostic analysis where gene-prioritization evidence across all autoimmune diseases was considered jointly in shared loci. Gene and disease names are sorted by alphabetical order. Abbreviations are as follows: CD, Crohn disease; IBD, inflammatory bowel disease; JIA, juvenile idiopathic arthritis; MS, multiple sclerosis; PSO, psoriasis; RA, rheumatoid arthritis; SLE, systemic lupus erythematosus; SS, systemic sclerosis; T1D, type 1 diabetes; and UC, ulcerative colitis.

References

    1. Buniello A., MacArthur J.A.L., Cerezo M., Harris L.W., Hayhurst J., Malangone C., McMahon A., Morales J., Mountjoy E., Sollis E. The NHGRI-EBI GWAS Catalog of published genome-wide association studies, targeted arrays and summary statistics 2019. Nucleic Acids Res. 2019;47(D1):D1005–D1012. - PMC - PubMed
    1. Farh K.K., Marson A., Zhu J., Kleinewietfeld M., Housley W.J., Beik S., Shoresh N., Whitton H., Ryan R.J., Shishkin A.A. Genetic and epigenetic fine mapping of causal autoimmune disease variants. Nature. 2015;518:337–343. - PMC - PubMed
    1. de Lange K.M., Moutsianas L., Lee J.C., Lamb C.A., Luo Y., Kennedy N.A., Jostins L., Rice D.L., Gutierrez-Achury J., Ji S.G. Genome-wide association study implicates immune activation of multiple integrin genes in inflammatory bowel disease. Nat. Genet. 2017;49:256–261. - PMC - PubMed
    1. Fortune M.D., Wallace C. simGWAS: a fast method for simulation of large scale case-control GWAS summary statistics. Bioinformatics. 2019;35:1901–1906. - PMC - PubMed
    1. Giambartolomei C., Vukcevic D., Schadt E.E., Franke L., Hingorani A.D., Wallace C., Plagnol V. Bayesian test for colocalisation between pairs of genetic association studies using summary statistics. PLoS Genet. 2014;10:e1004383. - PMC - PubMed

Publication types