. 2021 Apr 1;108(4):583-596.
doi: 10.1016/j.ajhg.2021.03.008.

Association of structural variation with cardiometabolic traits in Finns

Affiliations

Association of structural variation with cardiometabolic traits in Finns

Lei Chen et al. Am J Hum Genet. .

Abstract

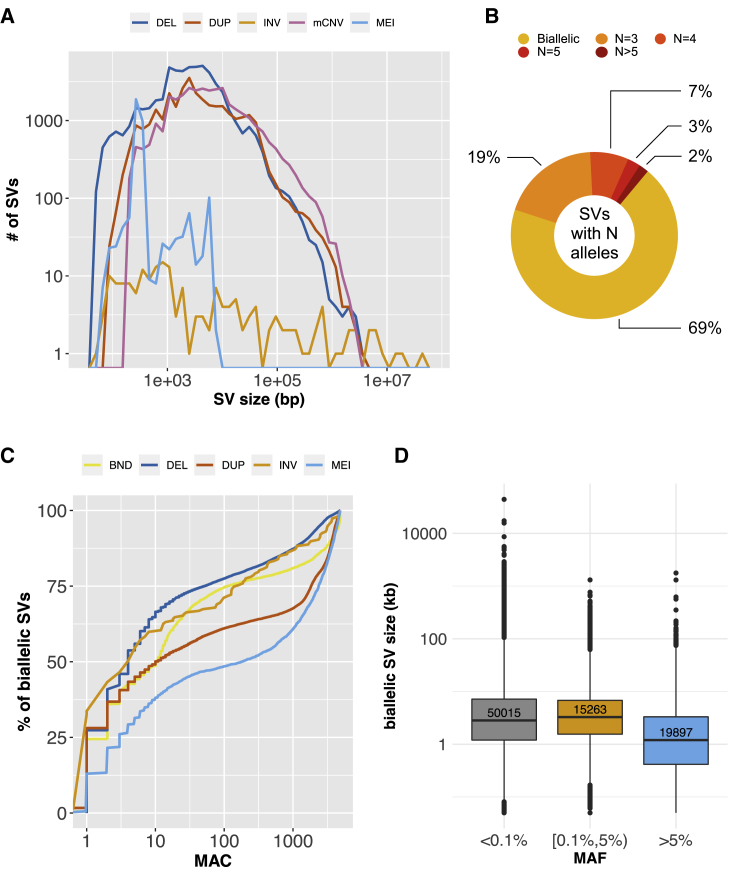
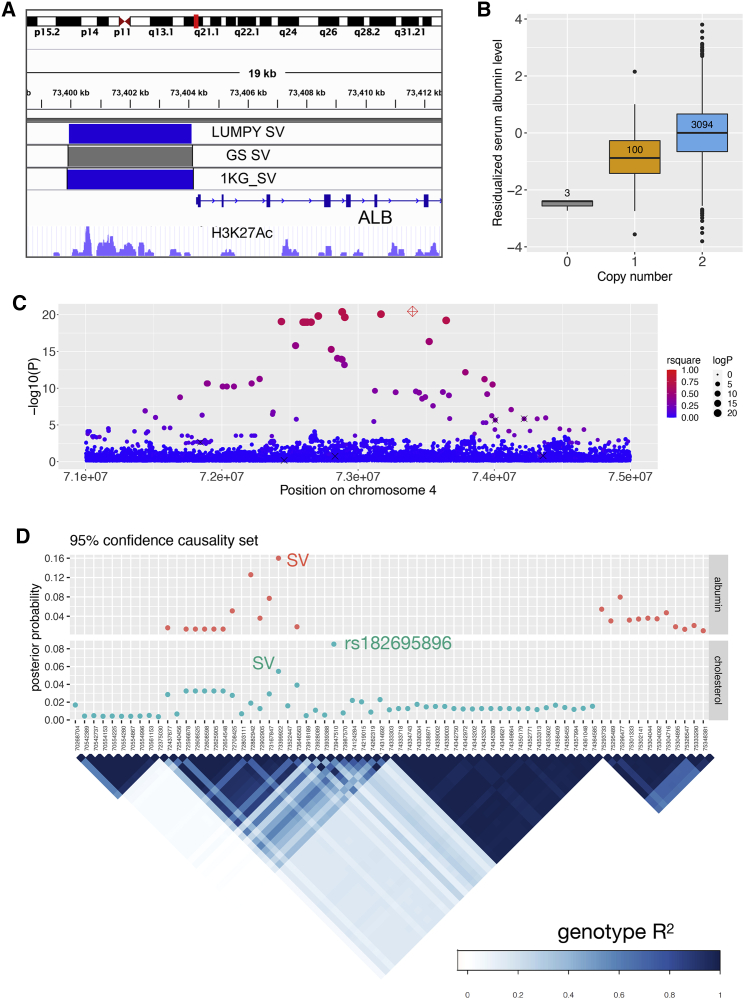
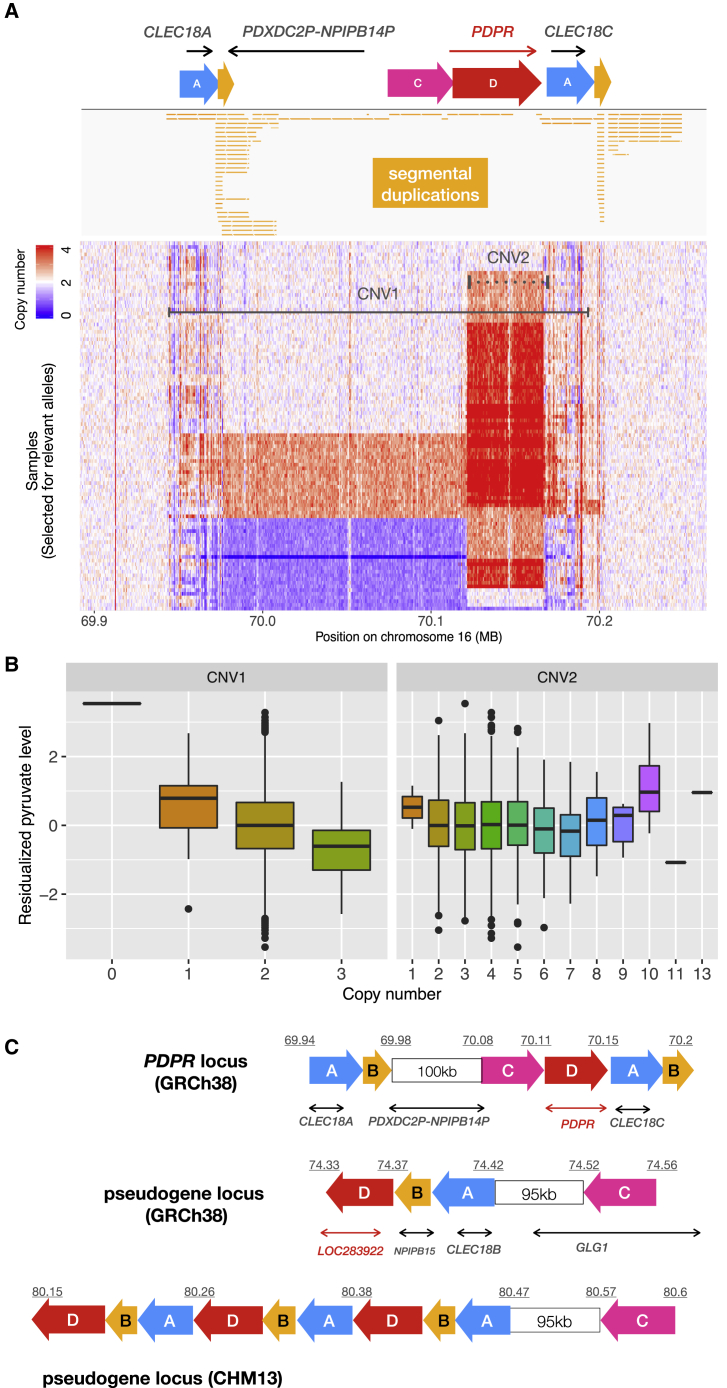
The contribution of genome structural variation (SV) to quantitative traits associated with cardiometabolic diseases remains largely unknown. Here, we present the results of a study examining genetic association between SVs and cardiometabolic traits in the Finnish population. We used sensitive methods to identify and genotype 129,166 high-confidence SVs from deep whole-genome sequencing (WGS) data of 4,848 individuals. We tested the 64,572 common and low-frequency SVs for association with 116 quantitative traits and tested candidate associations using exome sequencing and array genotype data from an additional 15,205 individuals. We discovered 31 genome-wide significant associations at 15 loci, including 2 loci at which SVs have strong phenotypic effects: (1) a deletion of the ALB promoter that is greatly enriched in the Finnish population and causes decreased serum albumin level in carriers (p = 1.47 × 10-54) and is also associated with increased levels of total cholesterol (p = 1.22 × 10⁻²⁸) and 14 additional cholesterol-related traits, and (2) a multi-allelic copy number variant (CNV) at PDPR that is strongly associated with pyruvate (p = 4.81 × 10⁻²¹) and alanine (p = 6.14 × 10⁻¹²) levels and resides within a structurally complex genomic region that has accumulated many rearrangements over evolutionary time. We also confirmed six previously reported associations, including five led by stronger signals in single nucleotide variants (SNVs) and one linking recurrent HP gene deletion and cholesterol levels (p = 6.24 × 10⁻¹⁰), which was also found to be strongly associated with increased glycoprotein level (p = 3.53 × 10⁻³⁵). Our study confirms that integrating SVs in trait-mapping studies will expand our knowledge of genetic factors underlying disease risk.

Keywords: Finnish population; cardiometabolic traits; genome-wide association study; structural variation.


Conflict of interest statement

N.O.S. has received research funding from Regeneron Pharmaceuticals unrelated to this study. The rest of the authors declare no competing interests.

Figures

Figure 1
Figure 1
Overview of the high-confidence SV callset (A) SV size distribution (log10 scale, bp) by variant type. BNDs are not included due to the ambiguous definition of variant boundaries. (B) Proportion of bi-allelic SVs and multi-allelic CNVs, where N is defined by the number of copy number groups (e.g., CN = 0,1,2,3,4, etc.). (C) The minor allele count distribution of all the high-confidence bi-allelic SVs stratified by variant type. (D) The size distribution (log10 scale) of bi-allelic SVs stratified by MAF groups (<0.1%, ultra-rare; 0.1%–5%, rare, >5%, common). The central line and box borders represent median, 1st and 3rd quartiles. The upper whiskers extend to the lesser extreme of the maximum and the 3rd quartile plus 1.5 times the interquartile range (IQR); the lower whiskers extend to the lesser extreme of the minimum and the 1st quartile minus 1.5 times the IQR.
Figure 2
Figure 2
The ALB promotor deletion associated with serum albumin level and cholesterol traits (A) The genomic location of the chr4 deletion, with coordinates detected from LUMPY, GenomeSTRiP, and 1KG. The H3K27Ac track is from the ENCODE data obtained from the UCSC Genome Browser (showing the data of K562 cells). (B) Boxplot showing serum albumin levels stratified by genotype, with the sample size of each genotype group annotated at the center of each box. The trait value on the y axis is the inverse normalized residual of raw measurement (residualized for age, age2, and sex). The central line and box borders represent median, 1st, and 3rd quartiles. The upper whiskers extend to the lesser extreme of the maximum and the 3rd quartile plus 1.5 times the interquartile range (IQR); the lower whiskers extend to the lesser extreme of the minimum and the 1st quartile minus 1.5 times the IQR. (C) Local Manhattan plot of albumin association signals on chr4:71–75 Mb, including the ALB deletion (red diamond) and SNPs with minimum allele count of 9 (filled circles). The sizes of the circles are proportional to -log10(p) and colors indicated LD (Pearson R2) with the deletion (NA shown in gray). Six of the seven previously published GWAS signals are indicated with “x” (the seventh was too rare in our data to be included in the test). (D) Fine-mapping results at the ALB locus for albumin and total cholesterol trait associations, using CAVIAR. The top panel shows the 95% confidence causality sets for albumin (top) and cholesterol (bottom) and posterior probability of each variant to be causal (assuming a maximum of two causal variants). The bottom panel shows the LD structure for the candidate variants, using the genotype correlation (Pearson R2) calculated from WGS data.
Figure 3
Figure 3
The multi-allelic CNV at the PDPR locus affecting pyruvate and alanine (A) The PDPR locus showing (from top to bottom) genes, duplicated genomic segments based on dotplot analysis (see Figure S8), segmental duplication annotations from the UCSC table browser, and copy number profiles for 100 samples comprising 51 carriers and 49 non-carriers for CNV1. Copy number is shown in 500 bp windows, as determined by CNVnator, and the color saturates at four copies. The two horizontal lines indicate locations of the two CNVs (solid-CNV1, dashed-CNV2). (B) Pyruvate levels for 3,121 WGS samples stratified by copy number genotypes of CNV1 (p = 9.41 × 10−11) and CNV2 (p = 0.6). (C) Structure of GRCh38 reference and CHM13 assembly at the PDPR locus (top) and its pseudogene locus (bottom two), using the same annotations as in part (A). Blocks with the same color and letter notation are highly similar DNA sequences and arrows show the direction of alignments. Diagrams were drawn based on the dot plots in Figure S8. The segment B corresponds to LCR16a, the core element shared by many duplicons sparsely distributed on chromosome 16.

References

    1. Ortega F.B., Lavie C.J., Blair S.N. Obesity and Cardiovascular Disease. Circ. Res. 2016;118:1752–1770. - PubMed
    1. Francula-Zaninovic S., Nola I.A. Management of measurable variable cardiovascular disease’ risk factors. Curr. Cardiol. Rev. 2018;14:153–163. - PMC - PubMed
    1. Kolifarhood G., Daneshpour M., Hadaegh F., Sabour S., Mozafar Saadati H., Akbar Haghdoust A., Akbarzadeh M., Sedaghati-Khayat B., Khosravi N. Heritability of blood pressure traits in diverse populations: a systematic review and meta-analysis. J. Hum. Hypertens. 2019;33:775–785. - PubMed
    1. Kim Y., Lee Y., Lee S., Kim N.H., Lim J., Kim Y.J., Oh J.H., Min H., Lee M., Seo H.-J. On the Estimation of Heritability with Family-Based and Population-Based Samples. BioMed Res. Int. 2015;2015:671349. - PMC - PubMed
    1. Campbell Am L.V. Genetics of obesity. Aust. Fam. Physician. 2017;46:456–459. - PubMed

Publication types