. 2021 Sep:51:101228.
doi: 10.1016/j.molmet.2021.101228. Epub 2021 Mar 30.

Compound- and fiber type-selective requirement of AMPKγ3 for insulin-independent glucose uptake in skeletal muscle

Affiliations

Compound- and fiber type-selective requirement of AMPKγ3 for insulin-independent glucose uptake in skeletal muscle

Philipp Rhein et al. Mol Metab. 2021 Sep.

Abstract

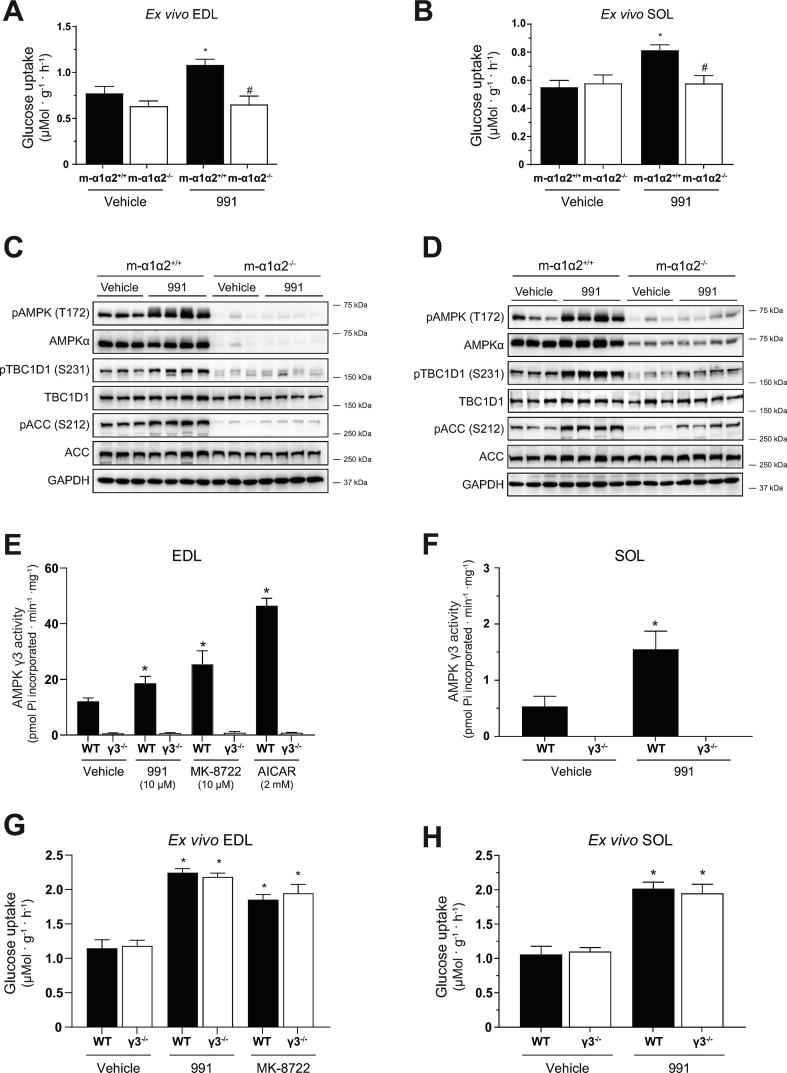
Objective: The metabolic master-switch AMP-activated protein kinase (AMPK) mediates insulin-independent glucose uptake in muscle and regulates the metabolic activity of brown and beige adipose tissue (BAT). The regulatory AMPKγ3 isoform is uniquely expressed in skeletal muscle and potentially in BAT. Herein, we investigated the role that AMPKγ3 plays in mediating skeletal muscle glucose uptake and whole-body glucose clearance in response to small-molecule activators that act on AMPK via distinct mechanisms. We also assessed whether γ3 plays a role in adipose thermogenesis and browning.

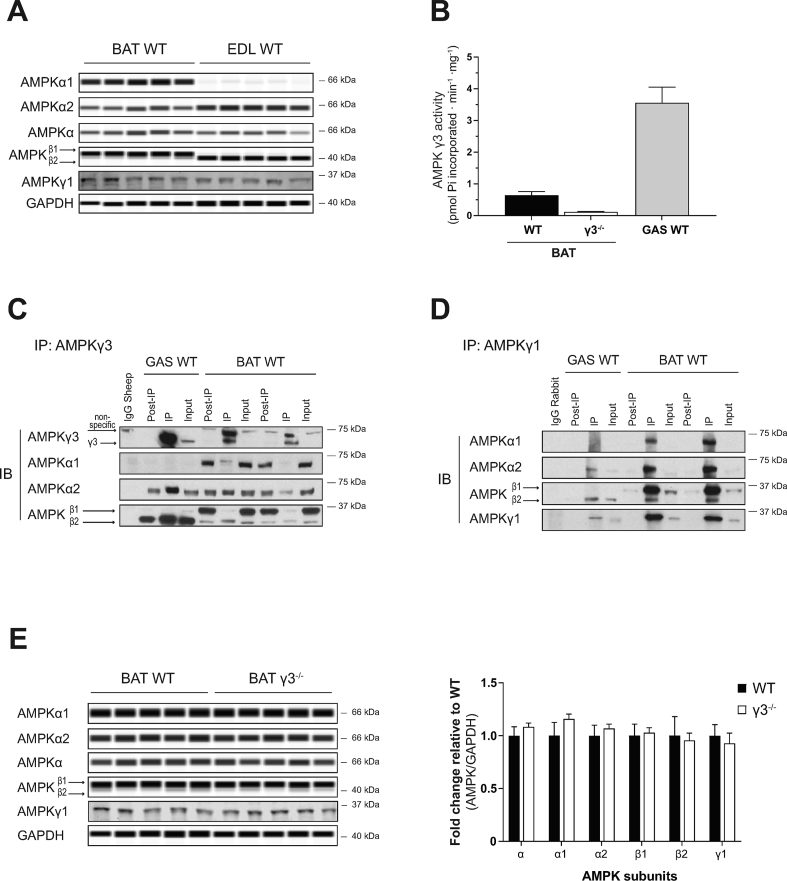
Methods: Global AMPKγ3 knockout (KO) mice were generated. A systematic whole-body, tissue, and molecular phenotyping linked to glucose homeostasis was performed in γ3 KO and wild-type (WT) mice. Glucose uptake in glycolytic and oxidative skeletal muscle ex vivo as well as blood glucose clearance in response to small molecule AMPK activators that target the nucleotide-binding domain of the γ subunit (AICAR) and allosteric drug and metabolite (ADaM) site located at the interface of the α and β subunit (991, MK-8722) were assessed. Oxygen consumption, thermography, and molecular phenotyping with a β3-adrenergic receptor agonist (CL-316,243) treatment were performed to assess BAT thermogenesis, characteristics, and function.

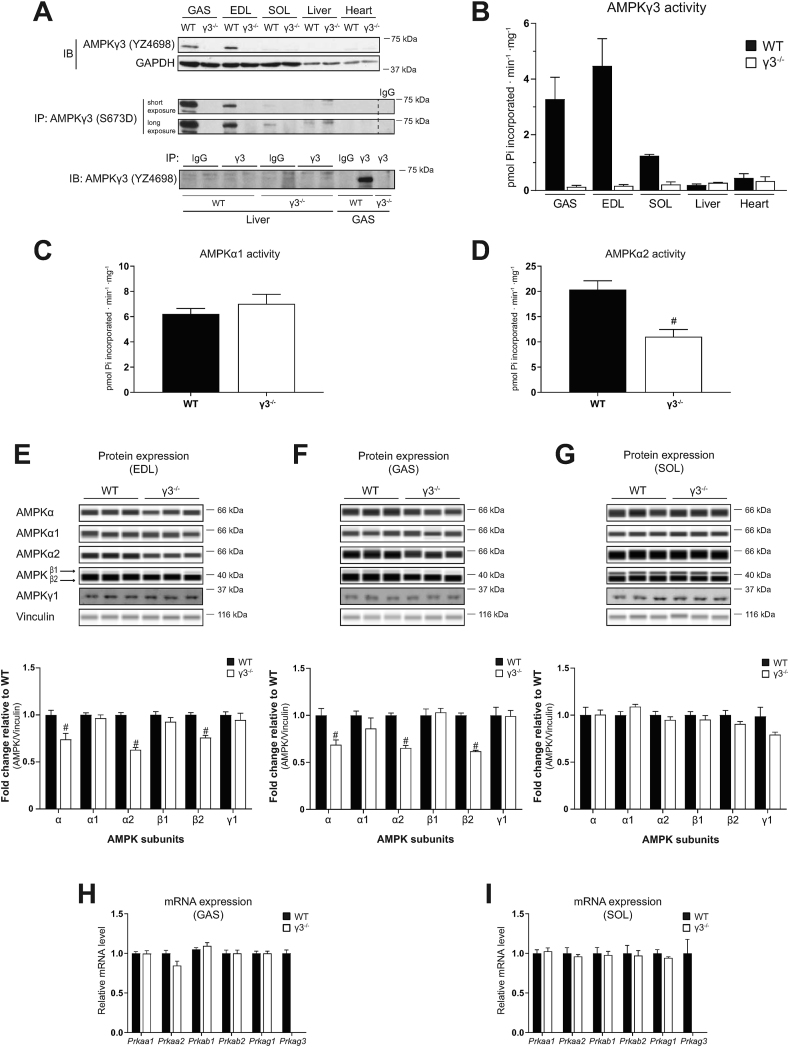
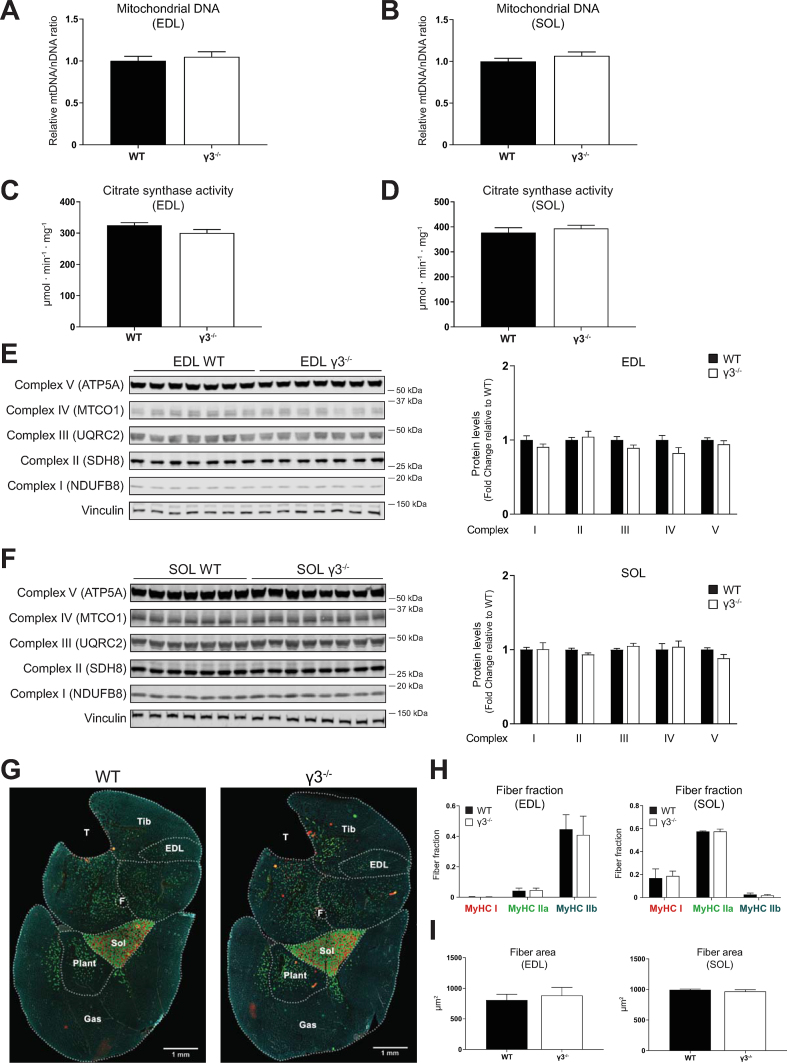
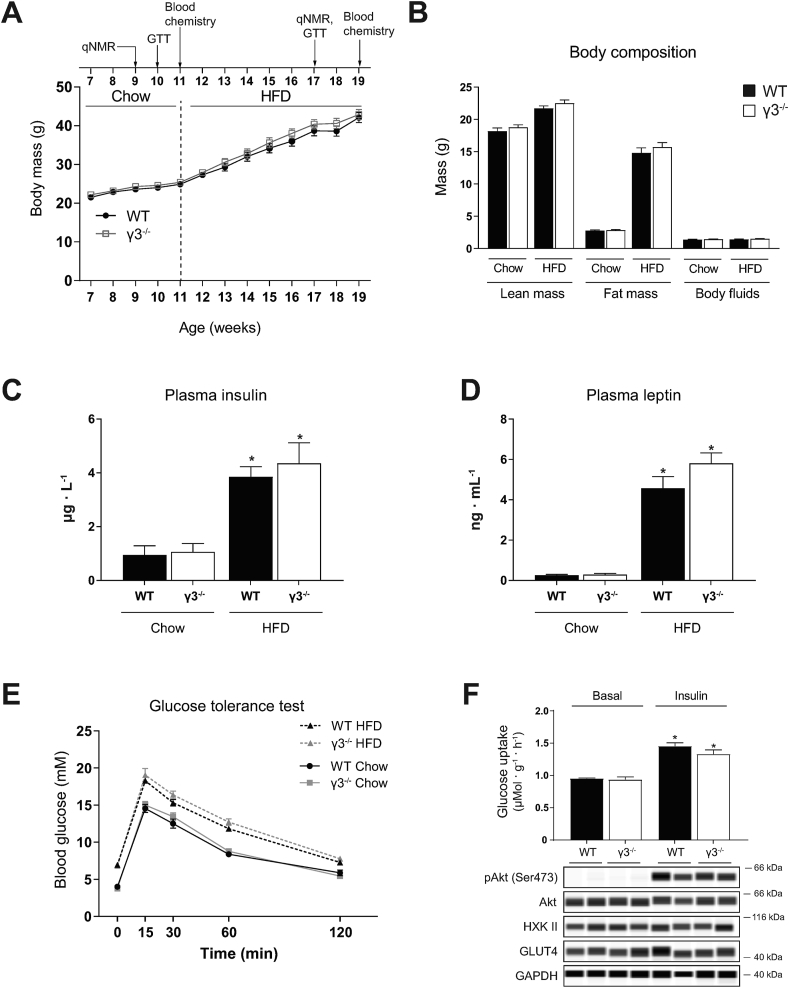
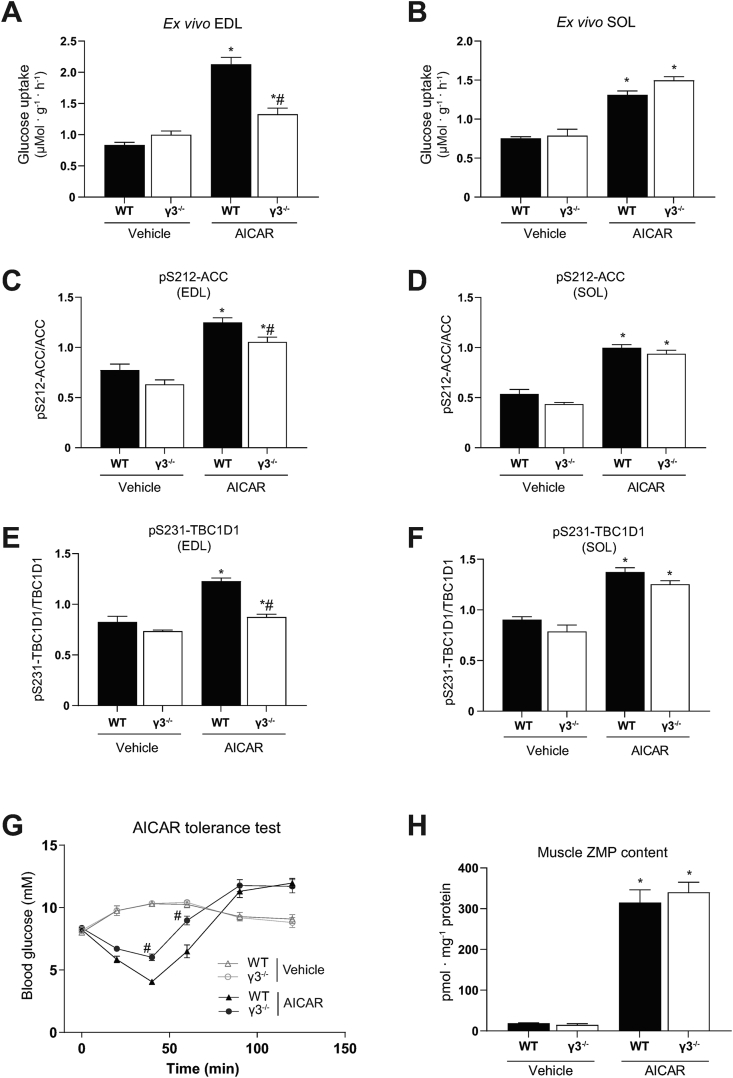
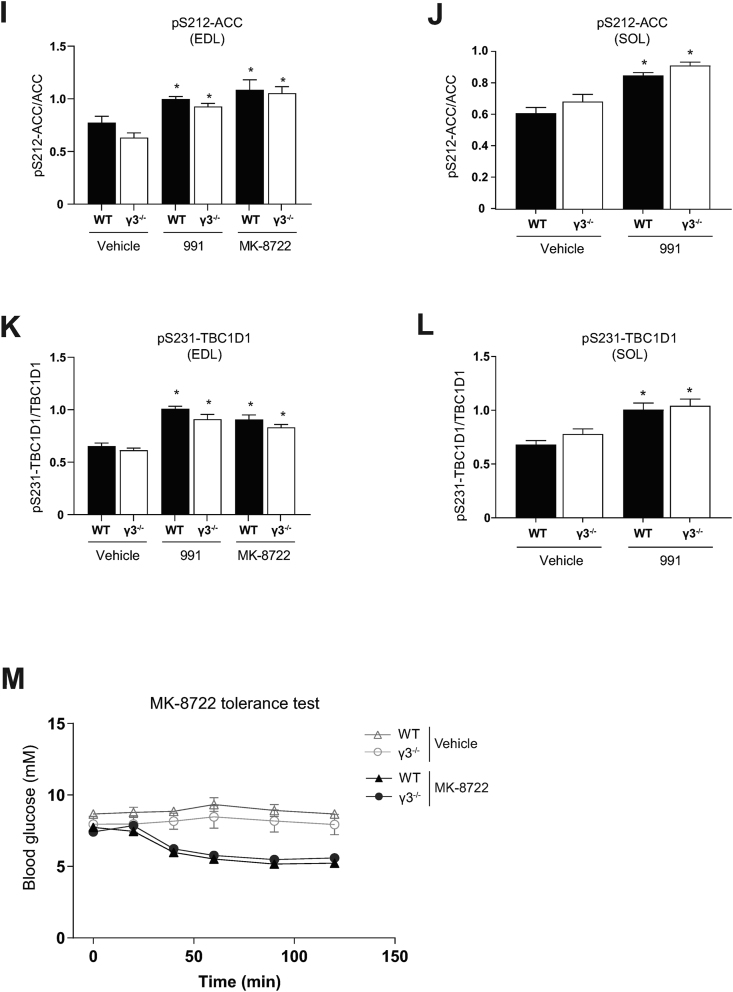
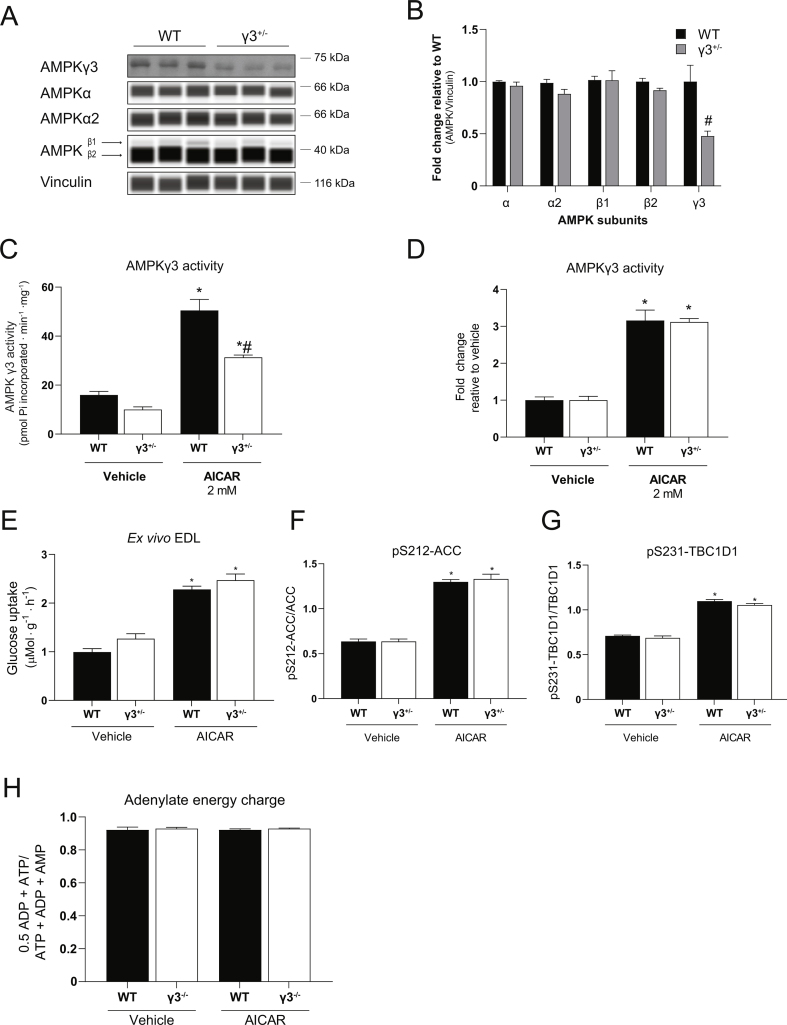
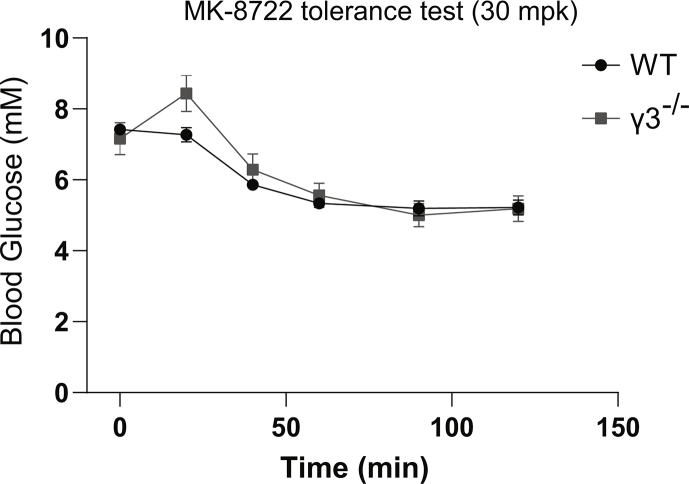
Results: Genetic ablation of γ3 did not affect body weight, body composition, physical activity, and parameters associated with glucose homeostasis under chow or high-fat diet. γ3 deficiency had no effect on fiber-type composition, mitochondrial content and components, or insulin-stimulated glucose uptake in skeletal muscle. Glycolytic muscles in γ3 KO mice showed a partial loss of AMPKα2 activity, which was associated with reduced levels of AMPKα2 and β2 subunit isoforms. Notably, γ3 deficiency resulted in a selective loss of AICAR-, but not MK-8722-induced blood glucose-lowering in vivo and glucose uptake specifically in glycolytic muscle ex vivo. We detected γ3 in BAT and found that it preferentially interacts with α2 and β2. We observed no differences in oxygen consumption, thermogenesis, morphology of BAT and inguinal white adipose tissue (iWAT), or markers of BAT activity between WT and γ3 KO mice.

Conclusions: These results demonstrate that γ3 plays a key role in mediating AICAR- but not ADaM site binding drug-stimulated blood glucose clearance and glucose uptake specifically in glycolytic skeletal muscle. We also showed that γ3 is dispensable for β3-adrenergic receptor agonist-induced thermogenesis and browning of iWAT.

Keywords: 5-aminoimidazole-4-carboxamide riboside; AMP-activated protein kinase; Beige adipose tissue; Brown adipose tissue; MK-8722; TBC1D1.


Figures

Figure 1
Figure 1
Genetic ablation of the AMPKγ3 causes a significant loss of α2 and β2 expression in mouse glycolytic skeletal muscles. (A) Immunoblot (IB) analysis of γ3 expression in a panel of tissues extracted from wild-type (WT) or AMPKγ3-null (γ3−/−) mice (upper panel). γ3 expression was further analyzed by immunoblotting following enrichment of the γ3 proteins via immunoprecipitation (IP) from the indicated tissue extracts (200 μg) (middle panel). Liver and skeletal muscle (GAS) tissue extracts from the indicated genotypes were used for immunoprecipitation with either γ3-specific antibody or species-matched IgG (as negative control) and the immune-complexes were subsequently immunoblotted with γ3 antibody (lower panel). (B) The γ3-containing AMPK complexes were immunoprecipitated from the indicated tissues harvested from the indicated genotypes and an in vitro AMPK activity assay was performed in duplicate (n = 3 per tissue/genotype). (C, D) The in vitro AMPK activity assay was performed on α1- or α2-containing AMPK complexes immunoprecipitated from GAS extracts (n = 9–10 per tissue/genotype). (E–G) Representative immunoblot images and quantification of the AMPK isoform-specific expression using an automated capillary immunoblotting system (Sally Sue) with the indicated antibodies as described in Materials and Methods. AMPK isoform expressions were normalized by their respective vinculin expression (loading control) and are shown as fold change relative to WT. Note that AMPKγ1 expression was quantified using another immunoblotting system (Li-COR, described in the Materials and Methods) due to antibody compatibility (n = 5–11 per tissue/genotype). (H, I) Relative levels of mRNA of the indicated genes (encoding AMPK isoforms) in the indicated skeletal muscles were assessed by qPCR (n = 5 per tissue/genotype). Results are shown as means ± SEM. Statistical significance was determined using the unpaired, two-tailed Student's t-test and are shown as #P < 0.05 (WT vs. γ3−/−). GAS; gastrocnemius, EDL; extensor digitorum longus, SOL; soleus, IgG; immunoglobulin G.
Figure 2
Figure 2
AMPKγ3 deficiency does not affect mitochondrial content and components, or fiber-type composition in skeletal muscles. (A, B) Relative quantification of mitochondrial DNA (mtDNA) was performed using qPCR-based assay as described in the Materials and Methods (n = 5 per tissue/genotype). (C, D) Citrate synthase activity was measured in the indicated muscle extracts (n = 8 per tissue/genotype). (E, F) Immunoblot analysis and quantification of mitochondrial complexes in the indicated muscles (n = 7 per tissue/genotype). (G–I) Representative cross-sectional images (n = 4 per genotype) of the whole-hindlimb muscle fiber-type analysis of the indicated genotypes using isoform-specific myosin heavy chain (MyHC) and laminin antibodies followed by immunofluorescent signal detection (G). Scale bar = 1 mm. Quantification of relative isoform-specific MyHC composition/fraction (red: MyHC I, green: MyHC IIa, blue: MyHC IIb, laminin: gray/white) and fiber area in the indicated muscles were performed as described in Materials and Methods. Unstained fibers are not included in the fiber fraction analysis (H, L, n = 3–4 per tissue/genotype). Results are shown as means ± SEM. GAS; gastrocnemius, EDL; extensor digitorum longus; SOL; soleus, Tib; tibialis anterior, Plant; plantaris, F; fibula, T; tibia.
Figure 3
Figure 3
AMPKγ3 is dispensable for maintaining glucose homeostasis under chow and high-fat diet (HFD) feeding. (A) Time sequence of the diet intervention, analysis of body composition (qNMR), oral glucose tolerance test (GTT) and plasma hormone analysis (blood chemistry). Mice were fed chow diet after weaning until 11 weeks of age before switching to HFD (60 kcal% fat). Body weight over time of the indicated genotypes (n = 10 per genotype). (B) Body composition determined by qNMR in the indicated genotypes during the indicated diet treatment. (C, D) Plasma insulin and leptin levels were determined using the commercial enzyme-linked immunosorbent assay kits. (E) Mice were fasted overnight and an oral GTT test was performed during chow (week 10) and HFD (week 17) feeding by monitoring blood glucose kinetics over the indicated duration following an oral administration of a bolus of glucose solution (2 g/kg body weight). (F) Extensor digitorum longus (EDL) muscles from the indicated genotypes on chow diet (10- to 12-week old males from a separate cohort, n = 5–7 per genotype) were isolated in incubated in the presence or absence of insulin (100 nM) for 50 min and were subjected to glucose uptake assay and immunoblot analysis using the indicated antibodies. Results are shown as means ± SEM. Statistical significance was determined using the unpaired/two-tailed Student's t-test or one-way analysis of variance with Bonferroni correction and are shown as ∗P < 0.05 (treatment effect within the same genotype).
Figure 4
Figure 4
AMPKγ3 is required for AICAR-induced glucose uptake in glycolytic skeletal muscles and hypoglycemia. (A–F) EDL or SOL muscles were isolated from the indicated genotypes and incubated in the absence (vehicle, 0.1% DMSO) or presence of AICAR (2 mM) for 50 min followed by an additional 10-min incubation with the radioactive 2-deoxy-glucose tracer. One portion of the muscle extracts was subjected to glucose uptake measurement (A, B) and the other was used for immunoblot analysis using the automated capillary immunoblotting system with the indicated antibodies (C–F) (n = 4–7 per treatment/genotype). (G, H) AICAR tolerance test and muscle ZMP analysis. Mice were fasted for 3 h and injected either with vehicle (water) or AICAR (250 mg/kg body weight, i.p.) followed by blood glucose kinetics measurement over the indicated duration (G). Following the AICAR tolerance test, mice were euthanized and GAS muscles were extracted and ZMP levels were determined (H) (n = 5–12 per treatment/genotype). Results are shown as means ± SEM. Statistical significance was determined using the unpaired/two-tailed Student's t-test or one-way analysis of variance (ANOVA) with Bonferroni correction or two-way ANOVA and are shown as ∗P < 0.05 (treatment effect within the same genotype), #P < 0.05 (WT vs. γ3−/− within the same treatment). GAS; gastrocnemius, EDL; extensor digitorum longus, SOL; soleus, AICAR; 5-aminoimidazole-4-carboxamide ribonucleoside, ZMP; AICAR monophosphate.
Figure 5
Figure 5
AMPKα1/α2, but not γ3, is required for glucose uptake skeletal muscles and hypoglycemia in response to the ADaM site-targeted activators, 991 and MK-8722. (A–D) EDL or SOL muscles were isolated from the indicated genotypes and incubated in the absence (vehicle, 0.1% DMSO) or presence of 991 (10 μM) for 50 min followed by an additional 10-min incubation with the radioactive 2-deoxy-glucose tracer. One portion of the muscle extracts was subjected to glucose uptake measurement (A, B) and the other was used for immunoblot analysis using the indicated antibodies (followed by a signal detection using enhanced chemiluminescence) (C, D, n = 3–4 per treatment/genotype). (E–L) EDL or SOL muscles were isolated from the indicated genotypes and incubated in the absence (vehicle, 0.1% DMSO) or presence of the indicated compounds for 50 min followed by an additional 10-min incubation with the radioactive 2-deoxy-glucose tracer. One portion of the muscle extracts was subjected to immunoprecipitation with the γ3 antibody followed by an in vitro AMPK activity assay (E, F, n = 4–14). The other portion was subjected to glucose uptake measurement (G, H, n = 4–9) or immunoblot analysis using the automated capillary immunoblotting system with the indicated antibodies (I–L, n = 4–9). (M) MK-8722 tolerance test. Mice were fasted for 3 h and orally treated either with vehicle or MK-8722 (10 mg/kg body weight) followed by blood glucose kinetics monitoring over the indicated duration. Results are shown as means ± SEM. Statistical significance was determined using the unpaired/two-tailed Student's t-test or one-way analysis of variance (ANOVA) with Bonferroni correction or two-way ANOVA and are shown as ∗P < 0.05 (treatment effect within the same genotype), #P < 0.05 (WT vs. γ3−/− within the same treatment). EDL; extensor digitorum longus; SOL; soleus, AICAR; 5-aminoimidazole-4-carboxamide ribonucleoside.
Figure 5
Figure 5
AMPKα1/α2, but not γ3, is required for glucose uptake skeletal muscles and hypoglycemia in response to the ADaM site-targeted activators, 991 and MK-8722. (A–D) EDL or SOL muscles were isolated from the indicated genotypes and incubated in the absence (vehicle, 0.1% DMSO) or presence of 991 (10 μM) for 50 min followed by an additional 10-min incubation with the radioactive 2-deoxy-glucose tracer. One portion of the muscle extracts was subjected to glucose uptake measurement (A, B) and the other was used for immunoblot analysis using the indicated antibodies (followed by a signal detection using enhanced chemiluminescence) (C, D, n = 3–4 per treatment/genotype). (E–L) EDL or SOL muscles were isolated from the indicated genotypes and incubated in the absence (vehicle, 0.1% DMSO) or presence of the indicated compounds for 50 min followed by an additional 10-min incubation with the radioactive 2-deoxy-glucose tracer. One portion of the muscle extracts was subjected to immunoprecipitation with the γ3 antibody followed by an in vitro AMPK activity assay (E, F, n = 4–14). The other portion was subjected to glucose uptake measurement (G, H, n = 4–9) or immunoblot analysis using the automated capillary immunoblotting system with the indicated antibodies (I–L, n = 4–9). (M) MK-8722 tolerance test. Mice were fasted for 3 h and orally treated either with vehicle or MK-8722 (10 mg/kg body weight) followed by blood glucose kinetics monitoring over the indicated duration. Results are shown as means ± SEM. Statistical significance was determined using the unpaired/two-tailed Student's t-test or one-way analysis of variance (ANOVA) with Bonferroni correction or two-way ANOVA and are shown as ∗P < 0.05 (treatment effect within the same genotype), #P < 0.05 (WT vs. γ3−/− within the same treatment). EDL; extensor digitorum longus; SOL; soleus, AICAR; 5-aminoimidazole-4-carboxamide ribonucleoside.
Figure 6
Figure 6
AMPKγ3 is expressed and forms functional trimeric complexes in mouse brown adipose tissue (BAT). (A) Immunoblot (IB) analysis of the skeletal muscle (EDL) and BAT extracts harvested from wild-type (WT) mice using the automated capillary immunoblotting system with the indicated antibodies. Note that γ1 expression was quantified using another immunoblotting system (Li-COR) due to antibody compatibility. (B) Extracts from GAS muscle (100 μg) or BAT (1,000 μg) were subjected to immunoprecipitation (IP) with γ3 antibody and the γ3-containing immune-complexes were assayed for AMPK activity in vitro. (C, D) γ3- or γ1-containing AMPK complexes were immunoprecipitated from GAS (100 μg) or BAT (1,000 μg) extracts and subsequently subjected to immunoblot analysis using the indicated antibodies followed by a signal detection using enhanced chemiluminescence. (E) Quantification of the isoform-specific AMPK expression of a panel of tissues (harvested from WT or γ3−/− mice) was performed using the automated capillary immunoblotting system with the indicated antibodies. Results are shown as means ± SEM (n = 5–7). GAS; gastrocnemius, EDL; extensor digitorum longus.
Figure 7
Figure 7
AMPK γ3 is not required for the acute activation of non-shivering thermogenesis or the browning of inguinal white adipose tissue (WAT) in mice. (A) Oxygen consumption (VO2), (B, C) Interscapular brown adipose tissue (BAT) surface area temperature with representative thermal images, and (D) serum non-esterified free fatty acid (NEFA) concentration in response to a single injection of saline or CL 316,243 in male WT or γ3−/− mice (0.033 nmol/g, 20 min time-point), n = 9–13 per group. Data are means ± SEM with a CL 316,243 effect shown as ∗P < 0.05, as determined via repeated measures two-way ANOVA. (E) Oxygen consumption (VO2) basally and 6-h post-injection of saline or CL 316,243 in male WT or γ3−/− mice on indicated days, n = 5–8 per group. (F) Final body weight (BW), (G) BAT weight, and (H) inguinal WAT (iWAT) depot weight following 5 consecutive days of saline or CL 316,243 (5D CL) injections in male WT or γ3−/− mice, n = 5–8 per group. (I, J) Representative histological images of H&E-stained BAT (I) and iWAT (J) (10× magnification) from male WT or γ3−/− mice treated with saline or 5D CL. K) mRNA expression of genes indicative of iWAT browning, MT-CO2 (n = 4–8 per group), Cox8b (n = 5–8 per group), and Cidea (n = 5–7 per group) in male WT or γ3−/− mice treated with saline or 5D CL for 5 days. L) Immunoblot analysis and densitometry quantification (M) of UCP1 in male WT and γ3−/− mice treated with saline or 5D CL for 5 days (n = 6–8 per group). Data are means ± SEM with ∗P < 0.05 denoting a 5D CL effect, as determined by repeated measures two-way ANOVA (A) and regular two-way ANOVA. N.D.; not detectable
Supplementary Figure 1
Generation and general characterization of the AMPKγ3 knockout (KO) mice. (A) A schematic illustrating the targeting strategy used to generate Prkag3 knockout (AMPKγ3 KO) mouse model (C57BL/6NTac background). The targeting strategy is based on NCBI transcript NM_153744_3. The constitutive KO allele is obtained after in-vivo Cre-mediated recombination using Cre-Deleter mice (Taconic Biosciences) in which Cre is expressed under the control of the Gt(ROSA)26Sor gene. Deletion of exons 5–10 should result in the loss of function of the Prkag3 gene by deleting the cystathionine β-synthase (CBS) 2 domain and parts of the CBS 1 and 3 domains and by generating a frame shift from exon 4 to exon 11 (premature stop codon in exon 12). In addition, the resulting transcript may be a target for non-sense mediated RNA decay and may, therefore, not be expressed at significant level. (B) Immunoblot analysis of the gastrocnemius (GAS) muscle extracts obtained from the indicated genotypes using the anti-γ3 antibody raised against residues 44–64 (within exon 1–3) of the mouse γ3. (n = 3 per genotype) (C–E) General mouse phenotyping was performed by PHENOMIN (Illkirch, France). Mice were housed in metabolic phenotyping cages (TSE system, Labmaster, Germany) and after a 3h acclimatization period at ambient temperature (21 °C ± 2), food intake (C), ambulatory activity (D) and oxygen consumption (VO2) (E) were monitored. (n = 10 per genotype) Results are shown as means ± SEM.
Supplementary Figure 2
AMPK isoform expression, γ3 activity, AICAR-stimulated glucose uptake, and AMPK signaling in heterozygous γ3+/− mice and muscle energy charge following AICAR injection in WT and γ3−/− mice. (A, B) Immunoblot analysis and quantification of the AMPK isoform expression in extensor digitorum longus (EDL) muscles from wild-type (WT) and heterozygous γ3+/− mice using the indicated antibodies. Representative blot images shown (n = 5–6 per genotype). (C, D) γ3-containing complexes were immunoprecipitated and were subjected to an in vitro AMPK assay. The activity was shown as absolute unit (C) or fold increase relative to vehicle for corresponding genotype (D). (n = 5–6 per treatment/genotype) (E–G) EDL muscles were isolated from the indicated genotypes and incubated in the absence (vehicle, DMSO) or presence of AICAR (2 mM) for 50 min followed by an additional 10-min incubation with the radioactive 2-deoxy-glucose tracer. One portion of the muscle extracts was subjected to glucose uptake measurement (E) and the other was used for immunoblot analysis using the automated capillary immunoblotting system with the indicated antibodies (F. G) (n = 5–7 per treatment/genotype). (H) Following the AICAR tolerance test (Fig. 4G), mice were euthanized and GAS muscles were extracted and nucleotide levels were determined for calculation of the adenylate energy charge. (n = 5–12 per treatment/genotype). Results are shown as means ± SEM. Statistical significance was determined using the unpaired/two-tailed Student's t-test or one-way analysis of variance with Bonferroni correction and are shown as P < 0.05 (treatment effect within the same genotype), #P < 0.05 (WT vs. γ3+/− within the same treatment).
Supplementary Figure 3
MK-8722 tolerance test in WT and γ3−/− mice. Mice were fasted for 3 h and orally treated with MK-8722 (30 mg/kg body weight) followed by blood glucose kinetics monitoring over the indicated duration. (n = 8–10 per treatment/genotype) Results are shown as means ± SEM.

Similar articles

Cited by

References

    1. Hardie D.G. AMP-activated protein kinase: an energy sensor that regulates all aspects of cell function. Genes & Development. 2011;25(18):1895–1908. - PMC - PubMed
    1. Herzig S., Shaw R.J. AMPK: guardian of metabolism and mitochondrial homeostasis. Nature Reviews Molecular Cell Biology. 2018;19(2):121–135. - PMC - PubMed
    1. Hawley S.A., Davison M., Woods A., Davies S.P., Beri R.K., Carling D. Characterization of the AMP-activated protein kinase kinase from rat liver and identification of threonine 172 as the major site at which it phosphorylates AMP-activated protein kinase. Journal of Biological Chemistry. 1996;271(44):27879–27887. - PubMed
    1. Sakamoto K., McCarthy A., Smith D., Green K.A., Grahame Hardie D., Ashworth A. Deficiency of LKB1 in skeletal muscle prevents AMPK activation and glucose uptake during contraction. The EMBO Journal. 2005;24(10):1810–1820. - PMC - PubMed
    1. Shaw R.J., Lamia K.A., Vasquez D., Koo S.H., Bardeesy N., Depinho R.A. The kinase LKB1 mediates glucose homeostasis in liver and therapeutic effects of metformin. Science. 2005;310(5754):1642–1646. - PMC - PubMed

Publication types

MeSH terms