

Modelling the early phase of the Belgian COVID-19 epidemic using a stochastic compartmental model and studying its implied future trajectories
- PMID: 33799289
- PMCID: PMC7986325
- DOI: 10.1016/j.epidem.2021.100449
Modelling the early phase of the Belgian COVID-19 epidemic using a stochastic compartmental model and studying its implied future trajectories
Abstract
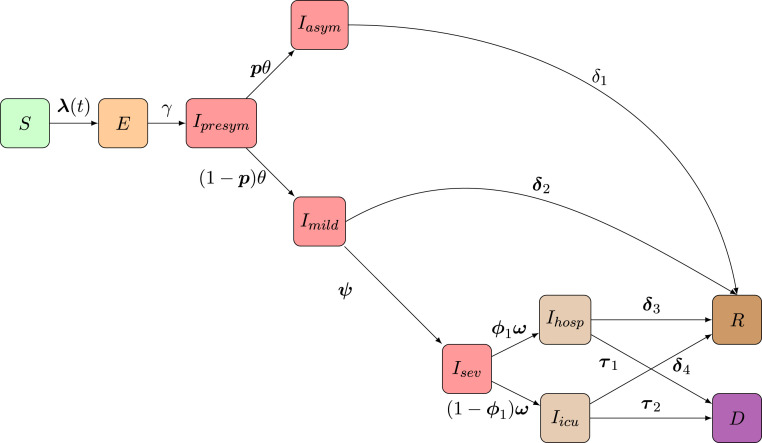
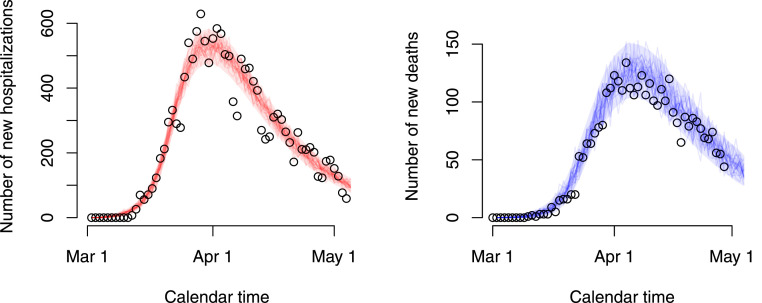
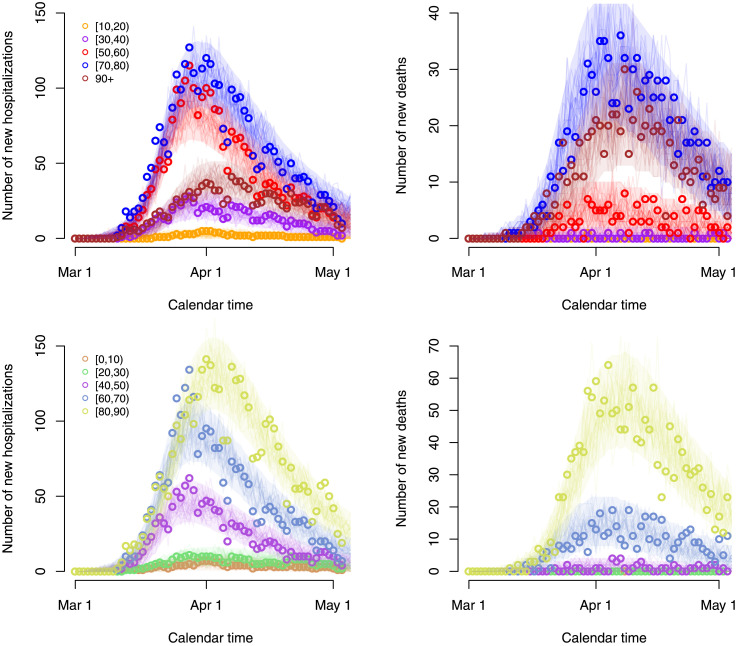
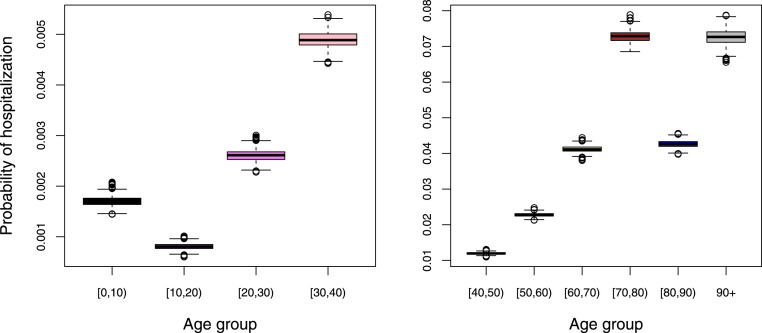
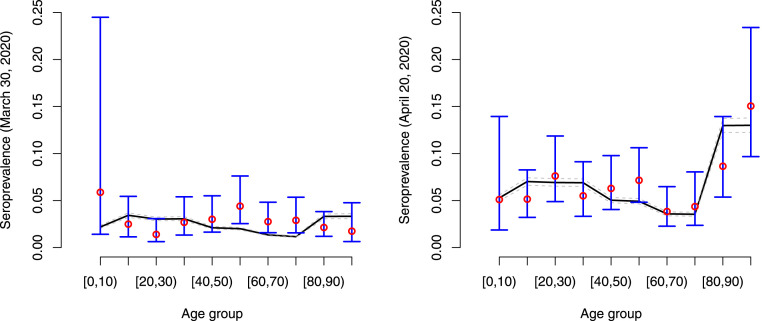
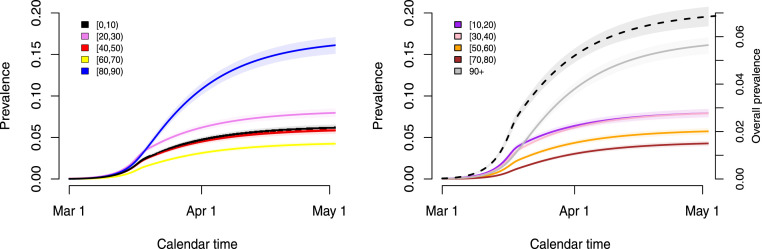
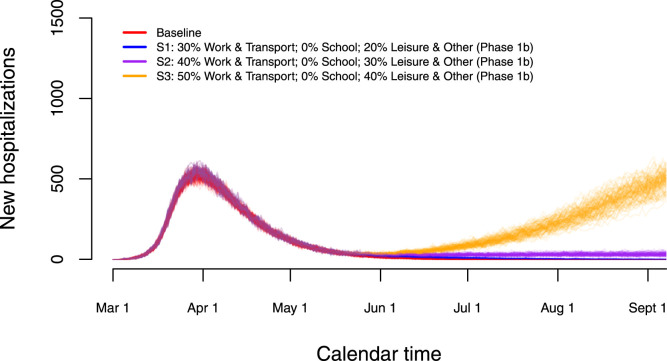
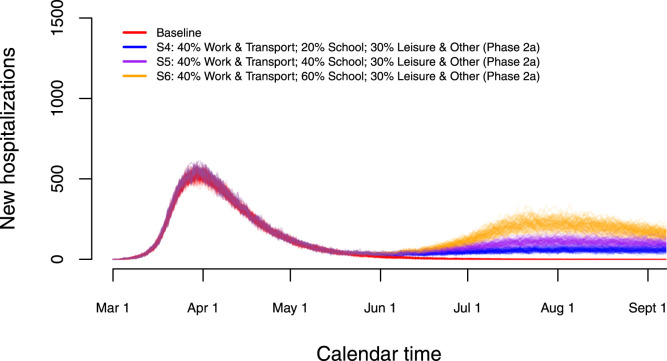
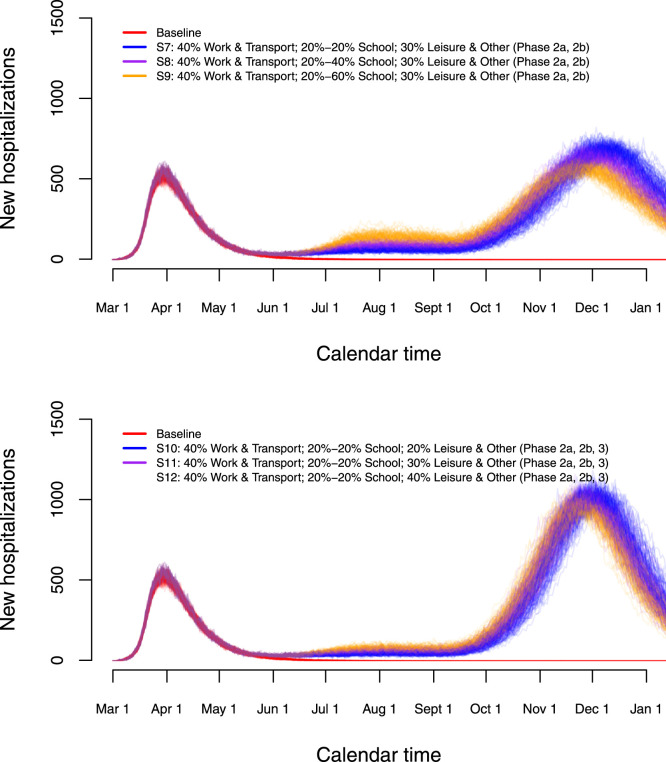
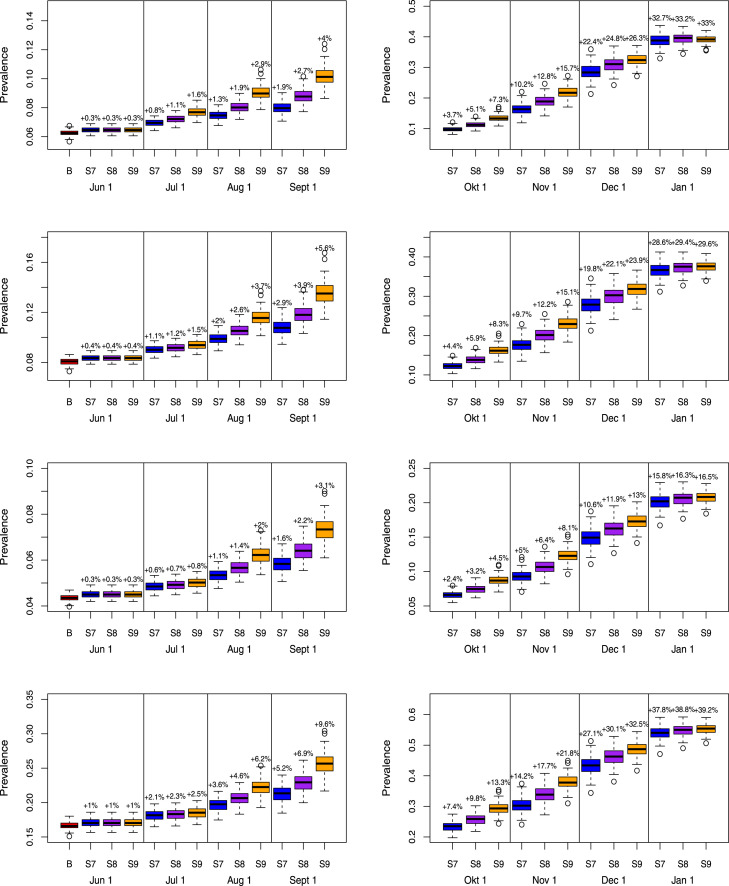
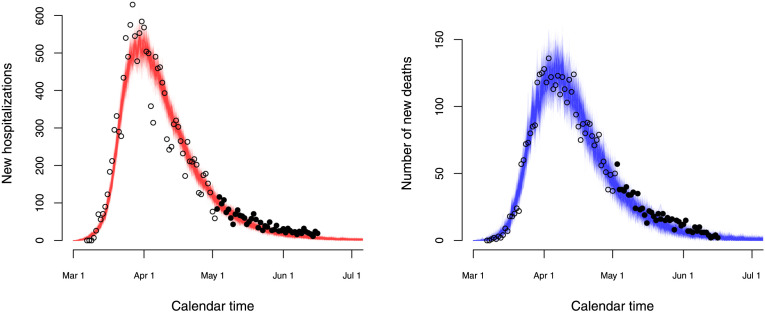
Following the onset of the ongoing COVID-19 pandemic throughout the world, a large fraction of the global population is or has been under strict measures of physical distancing and quarantine, with many countries being in partial or full lockdown. These measures are imposed in order to reduce the spread of the disease and to lift the pressure on healthcare systems. Estimating the impact of such interventions as well as monitoring the gradual relaxing of these stringent measures is quintessential to understand how resurgence of the COVID-19 epidemic can be controlled for in the future. In this paper we use a stochastic age-structured discrete time compartmental model to describe the transmission of COVID-19 in Belgium. Our model explicitly accounts for age-structure by integrating data on social contacts to (i) assess the impact of the lockdown as implemented on March 13, 2020 on the number of new hospitalizations in Belgium; (ii) conduct a scenario analysis estimating the impact of possible exit strategies on potential future COVID-19 waves. More specifically, the aforementioned model is fitted to hospital admission data, data on the daily number of COVID-19 deaths and serial serological survey data informing the (sero)prevalence of the disease in the population while relying on a Bayesian MCMC approach. Our age-structured stochastic model describes the observed outbreak data well, both in terms of hospitalizations as well as COVID-19 related deaths in the Belgian population. Despite an extensive exploration of various projections for the future course of the epidemic, based on the impact of adherence to measures of physical distancing and a potential increase in contacts as a result of the relaxation of the stringent lockdown measures, a lot of uncertainty remains about the evolution of the epidemic in the next months.
Keywords: Age-structured compartmental SEIR model; Hospitalization and mortality data; Markov Chain Monte Carlo (MCMC); Serial serological survey; Stochastic chain-binomial model.
Copyright © 2021. Published by Elsevier B.V.
Conflict of interest statement
The authors declare that they have no known competing financial interests or personal relationships that could have appeared to influence the work reported in this paper.
Figures
References
-
- Bailey N.T.J. Griffin; London: 1975. The Mathematical Theory of Infectious Diseases and Its Applications.
-
- Belgian Government: Federal Public Service – Health, Food Chain Safety and Environment N.T.J. 2020. Coronavirus COVID-19 – current measures.https://www.info-coronavirus.be/en/faq/
-
- den Boon S., Jit M., Brisson M., Medley G., Beutels P., White R., Flasche S., Hollingsworth T.D., Garske T., Pitzer V.E., Hoogendoorn M., Geffen O., Clark A., Kim J., Hutubessy R. Guidelines for multi-model comparisons of the impact of infectious disease interventions. BMC Med. 2019;(163) doi: 10.1186/s12916-019-1403-9. - DOI - PMC - PubMed
-
- Centers for Disease Control and Prevention S. CDC; 2020. Interim Clinical Guidance for Management of Patients with Confirmed Coronavirus Disease (COVID-19)https://www.cdc.gov/coronavirus/2019-ncov/hcp/clinical-guidance-manageme...
-
- Cereda D., Tirani M., Rovida F., Demicheli V., Ajelli M., Poletti P., Trentini F., Guzzetta G., Marziano V., Barone A., Magoni M., Deandrea S., Diurno G., Lombardo M., Faccini M., Pan A., Bruno R., Pariani E., Grasselli G., Piatti A., Gramegna M., Baldanti F., Melegaro A., Merler S. 2020. The early phase of the COVID-19 outbreak in Lombardy, Italy. arXiv. arXiv:2003.09320.
MeSH terms
LinkOut - more resources
Full Text Sources
Other Literature Sources
Medical
