. 2021 Mar 14;22(6):2944.
doi: 10.3390/ijms22062944.

Epithelial Membrane Protein 2 Suppresses Non-Small Cell Lung Cancer Cell Growth by Inhibition of MAPK Pathway

Affiliations

Epithelial Membrane Protein 2 Suppresses Non-Small Cell Lung Cancer Cell Growth by Inhibition of MAPK Pathway

Yunxia Ma et al. Int J Mol Sci. .

Abstract

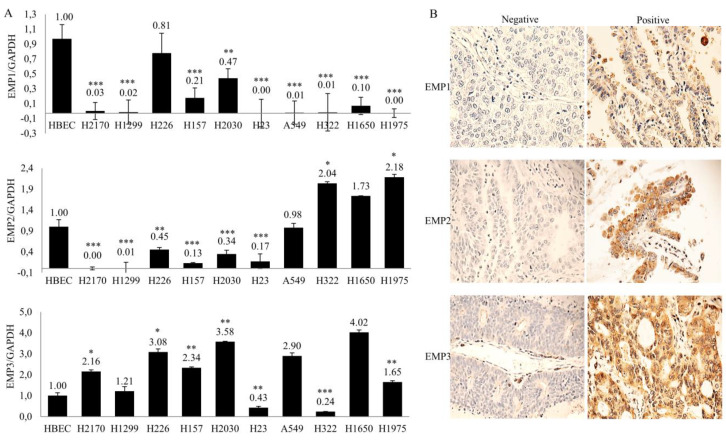
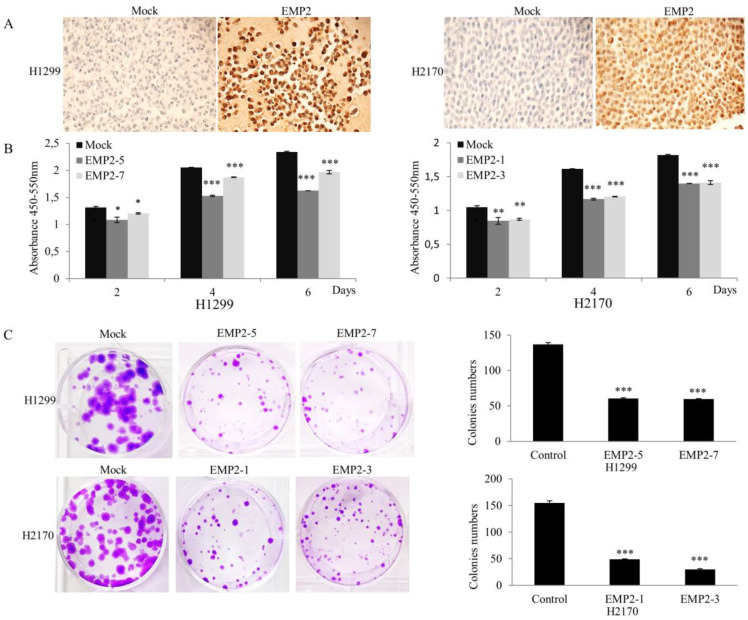
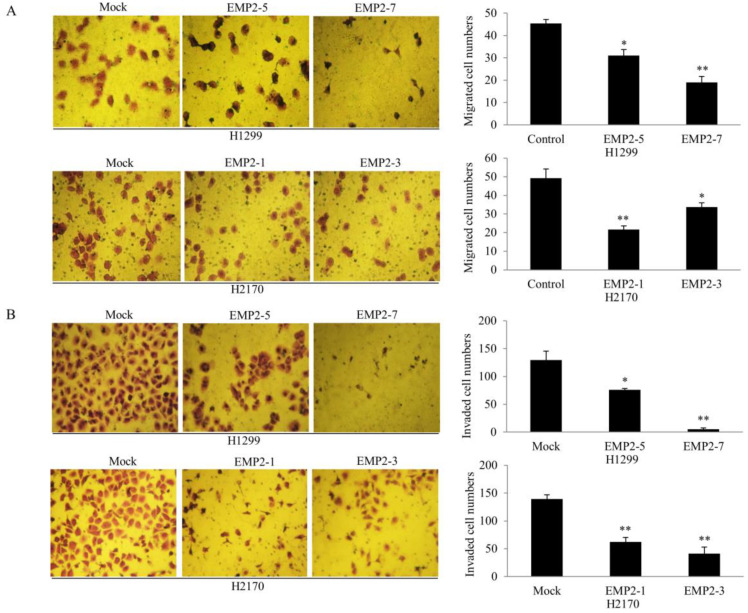
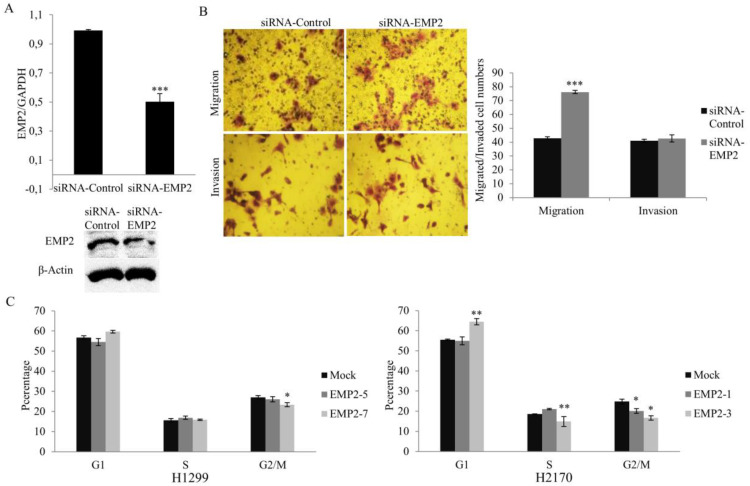
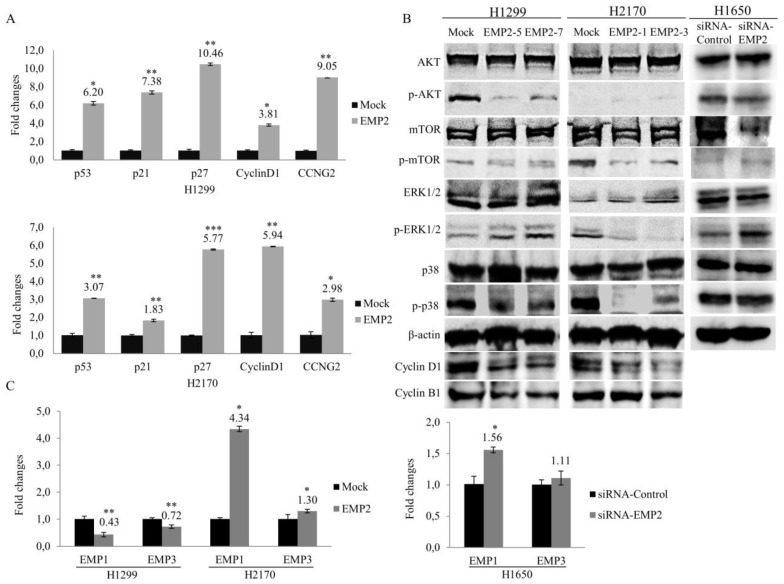
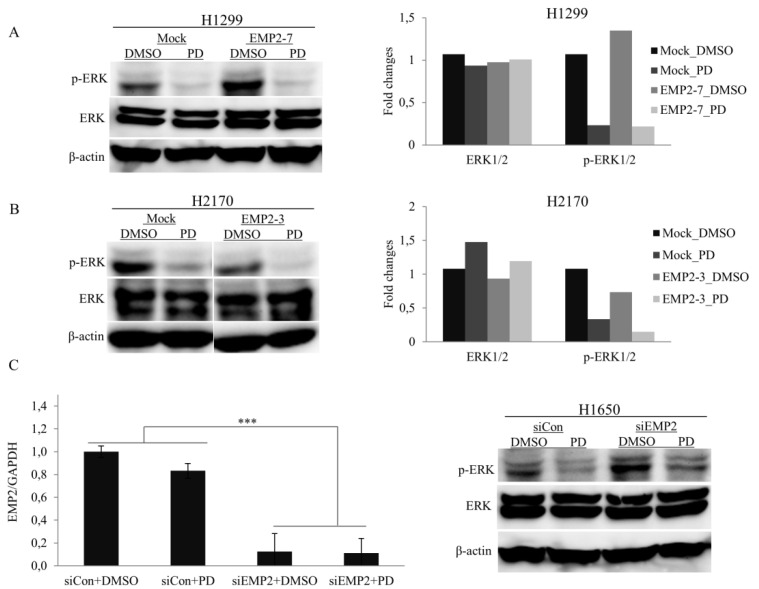
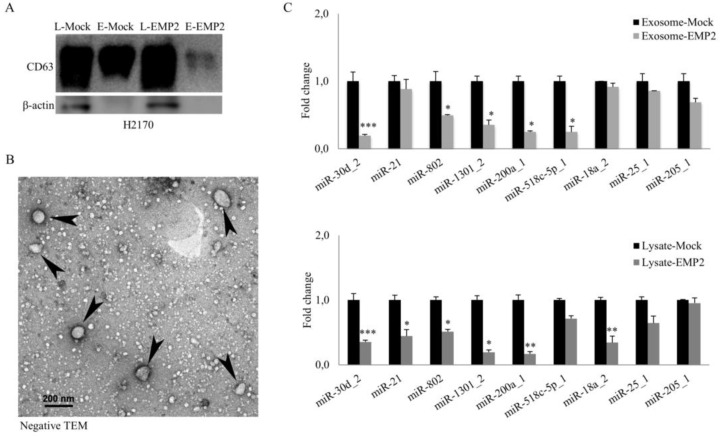
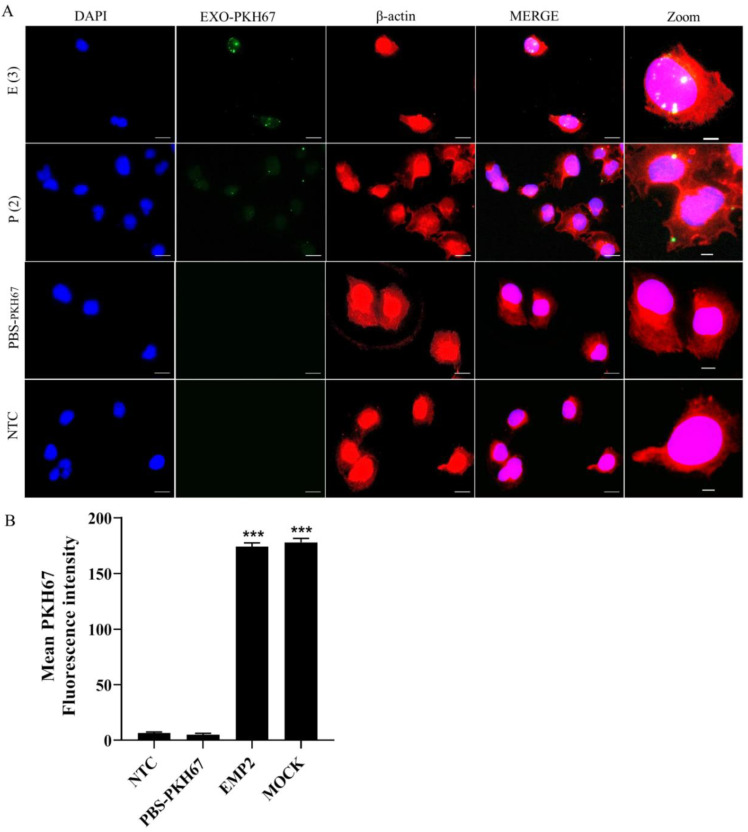
Epithelial membrane proteins (EMP1-3) are involved in epithelial differentiation and carcinogenesis. Dysregulated expression of EMP2 was observed in various cancers, but its role in human lung cancer is not yet clarified. In this study, we analyzed the expression of EMP1-3 and investigated the biological function of EMP2 in non-small cell lung cancer (NSCLC). The results showed that lower expression of EMP1 was significantly correlated with tumor size in primary lung tumors (p = 0.004). Overexpression of EMP2 suppressed tumor cell growth, migration, and invasion, resulting in a G1 cell cycle arrest, with knockdown of EMP2 leading to enhanced cell migration, related to MAPK pathway alterations and disruption of cell cycle regulatory genes. Exosomes isolated from transfected cells were taken up by tumor cells, carrying EMP2-downregulated microRNAs (miRNAs) which participated in regulation of the tumor microenvironment. Our data suggest that decreased EMP1 expression is significantly related to increased tumor size in NSCLC. EMP2 suppresses NSCLC cell growth mainly by inhibiting the MAPK pathway. EMP2 might further affect the tumor microenvironment by regulating tumor microenvironment-associated miRNAs.

Keywords: NSCLC; epithelial membrane protein; exosome; microRNA; tumor pathways.


Conflict of interest statement

The authors declare that they have no conflict of interest.

Figures

Figure 1
Figure 1
Expression analysis of epithelial membrane proteins (EMP) 1-3 in non-small cell lung cancer (NSCLC). (A) Analysis of EMP1-3 mRNA expression in 10 NSCLC cell lines by real-time RT-PCR. Gene expression in comparison to the housekeeping gene (GAPDH) expression in normal bronchial epithelial cells (HBECs) was set to 1.0. The data are shown as the means of three independent experiments ± standard deviation. * p < 0.05, ** p < 0.01, and *** p < 0.001 when analyzed with Student’s t-test. (B) Representative expression of EMP1-3 proteins in primary lung tissues (magnification ×400) using immunohistochemistry with negative staining (score 0; top) and strong staining (score 3; bottom).
Figure 2
Figure 2
Influence of EMP2 overexpression on NSCLC cell growth. (A) EMP2 overexpression in H1299 and H2170 cell lines after stable transfection compared to mock cells was proven by cell-block analysis, confirming a successful transfection of EMP2 (magnification ×200) (B) EMP2-positive transfectant cells (EMP2-5 and EMP2-7 for H1299; EMP2-1 and EMP2-3 for H2170) showed significantly reduced cell proliferation compared to mock cells as revealed by BrdU cell proliferation assay. (C) Colony formation assay revealed that EMP2 overexpression resulted in significantly decreased colony formation in both H1299 and H2170 cells. The data presented are the means ± SE from three independent experiments. * p < 0.05, ** p < 0.01, and *** p < 0.001 when analyzed with Student’s t-test.
Figure 3
Figure 3
Effects of EMP2 overexpression on the migration and invasion of NSCLC cells. (A) Migration assay revealed that EMP2 suppressed migratory ability of the NSCLC cell lines H1299 and H2170 (40× objective). Quantification of cell migration (right). The data presented are the means ± SE from three independent experiments. (B) Invasion assay showed that EMP2 inhibited the invasive ability of NSCLC cells (40× objective). Quantification of invaded cells (right). The data presented are the means ± SE from three independent experiments. * p < 0.05 and ** p < 0.001 when analyzed with Student’s t-test.
Figure 4
Figure 4
Effect of EMP2 knockdown on cell migration and invasion as well as the impact of EMP2 overexpression on the cell cycle. (A) Decreased expression of EMP2 in H1650 cells by siRNA knockdown was confirmed with real-time RT-PCR (top) and Western blotting (bottom). (B) Migration assay revealed that knockdown of EMP2 increased migratory ability of H1650 (50× objective; top), but the invasion assay did not reveal a significantly enhanced ability of tumor cell invasion after EMP2 siRNA knockdown (50× objective; bottom); quantification of migrated and invaded cell (right). Cells transfected with scrambled siRNA (siRNA Control) were used as control. (C) Flow cytometry showed that EMP2 overexpression led to a reduced H1299 cell population in G2/M, alongside an increased H2170 cell population in G1 and decreased cell populations in the S and G2/M phases. * p < 0.05, ** p < 0.01, *** p < 0.001 when analyzed using Student’s t-test.
Figure 5
Figure 5
Influence of EMP2 on cell cycle regulatory genes/proteins and tumor-associated signal pathways. (A) Real-time RT-PCR analysis revealed altered expression of cell cycle regulatory genes in both H1299 and H2170 cells after EMP2 stable transfection. (B) Western blot analysis showed decreased phosphorylated levels of AKT and p38 as well as decreased protein expression levels of cell cycle regulators cyclin D1 and cyclin B1, and an increased phosphorylated level of ERK1/2 in H2199 cells. In H2170 cells, decreased phosphorylated levels of mTOR, ERK1/2, and p38 as well as decreased protein expression levels of cyclin D1 and cyclin B1 (clone EMP2-3) after EMP2 overexpression were found. An increased phosphorylated level of ERK1/2 after EMP2-knockdown was detected in H1650 cells (C) Influence of EMP2 overexpression (left) and knockdown (right) on EMP1 and EMP3 expression. * p < 0.05, ** p < 0.01, *** p < 0.001 when analyzed using Student’s t-test.
Figure 6
Figure 6
Influence of MEK inhibitor PD98059 (PD) on the expression level of phosphorylated ERK1/2 in NSCLC cells with ectopic expression of EMP2 or EMP2-knockdown. (A) PD98059 treatment led to a reduced expression level of p-ERK1/2 in H1299 cells. The expression level of p-ERK1/2 was enhanced in EMP2-transfected H1299 cells (EMP2-7) compared to mock cells after DMSO treatment. No altered expression level of p-ERK1/2 was found in EMP2-transfected H1299 cells compared to mock cells after PD98059 treatment (left). Densitometric quantification of the data from the Western blot analysis (right). (B) PD98059 treatment led to a reduced expression level of p-ERK1/2 in H2170 cells. In EMP2-transfected H2170 cells (EMP2-3), a decreased expression level of p-ERK1/2 was observed compared to mock cells after PD98059 treatment (left). Densitometric quantification of the data from the Western blot analysis (right) (C) A successful knockdown of EMP2 was confirmed by real-time RT-PCR analysis in H1650 cells treated with DMSO or PD98059 (left). H1650 cells treated with PD98059 showed reduced expression of p-ERK1/2 compared to cells treated with DMSO. Cells with EMP2 knockdown (siEMP2) exhibited more expression of p-ERK1/2 compared to mock cells (siCon) after PD98059 treatment (right). *** p < 0.001 when analyzed using Student’s t-test.
Figure 7
Figure 7
Characterization of exosomes secreted by H2170-transfected cells and altered miRNA expression in EMP2 overexpression. (A) Western blot analysis of the exosome marker CD63 from both cell lysates and exosomes. (B) The presence of membranous vesicles in the diameter range of 40–100 nm (arrowheads), as confirmed by transmission electron microscopy (TEM) analysis. (C) Overexpression of EMP2 significantly altered the expression of miRNAs related to regulation of the tumor microenvironment. * p < 0.05, ** p < 0.01, *** p < 0.001 when analyzed using Student’s t-test.
Figure 8
Figure 8
Uptake of exosomes by autologous cells. (A) Cellular uptake of autologous exosomes in H2170 cells imaged by confocal microscopy. The fluorescence of DAPI, β-actin, and that of EXOSOME-PKH67 are labeled with blue, red, and green, respectively. Scale bars: 10 µm. (B) Summary bar graphs of the relative mean fluorescence intensity (MFI) of PKH67 (exosomes) in recipient cells. The results are illustrated as the mean ± SEM of the relative MFI. *** p < 0.001 in comparison with nontreated cells (NTC) analyzed by one-way ANOVA with Bonferroni’s multiple comparisons test; E-Mock: Exosome of mock cells; E-EMP2: Exosomes of EMP2-transfected cells.

Similar articles

Cited by

References

    1. Sayin V.I., LeBoeuf S.E., Papagiannakopoulos T. Targeting Metabolic Bottlenecks in Lung Cancer. Trends Cancer. 2019;5:457–459. doi: 10.1016/j.trecan.2019.06.001. - DOI - PubMed
    1. Siegel R.L., Miller K.D., Jemal A. Cancer statistics, 2020. CA Cancer J. Clin. 2020;70:7–30. doi: 10.3322/caac.21590. - DOI - PubMed
    1. Travis W.D., Brambilla E., Nicholson A.G., Yatabe Y., Austin J.H.M., Beasley M.B., Chirieac L.R., Dacic S., Duhig E., Flieder D.B., et al. WHO Panel. The 2015 World Health Organization Classification of Lung Tumors: Impact of Genetic, Clinical and Radiologic Advances Since the 2004 Classification. J. Thorac. Oncol. 2015;10:1243–1260. doi: 10.1097/JTO.0000000000000630. - DOI - PubMed
    1. Lu T., Yang X., Huang Y., Zhao M., Li M., Ma K., Yin J., Zhan C., Wang Q. Trends in the incidence, treatment, and survival of patients with lung cancer in the last four decades. Cancer Manag. Res. 2019;11:943–953. doi: 10.2147/CMAR.S187317. - DOI - PMC - PubMed
    1. Chen Y., Petersen S., Pacyna-Gengelbach M., Pietas A., Petersen I. Identification of a novel homeobox-containing gene, LAGY, which is downregulated in lung cancer. Oncology. 2003;64:450–458. doi: 10.1159/000070306. - DOI - PubMed

MeSH terms

LinkOut - more resources