Review
. 2021 Mar 11;12(3):398.
doi: 10.3390/genes12030398.

Optical Genome Mapping as a Next-Generation Cytogenomic Tool for Detection of Structural and Copy Number Variations for Prenatal Genomic Analyses

Affiliations
Review

Optical Genome Mapping as a Next-Generation Cytogenomic Tool for Detection of Structural and Copy Number Variations for Prenatal Genomic Analyses

Nikhil Shri Sahajpal et al. Genes (Basel). .

Abstract

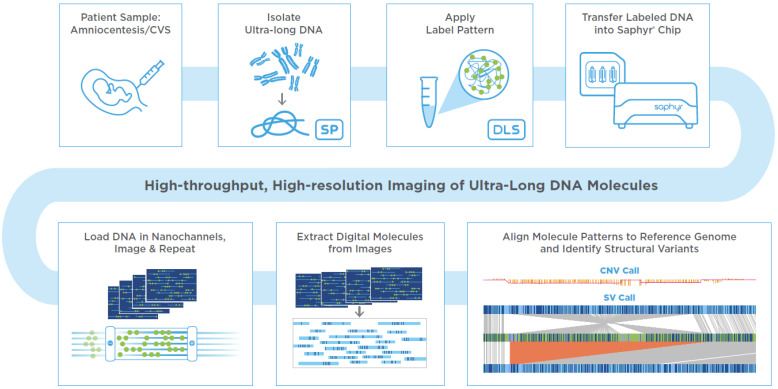
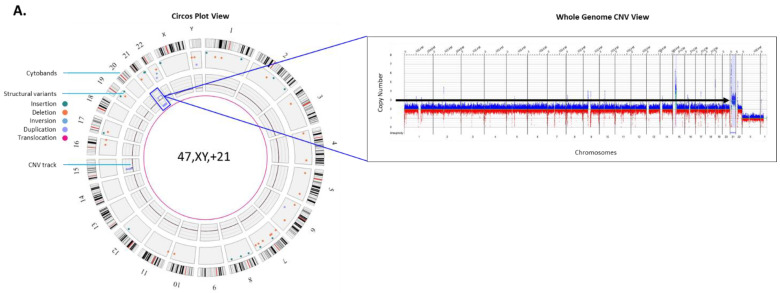
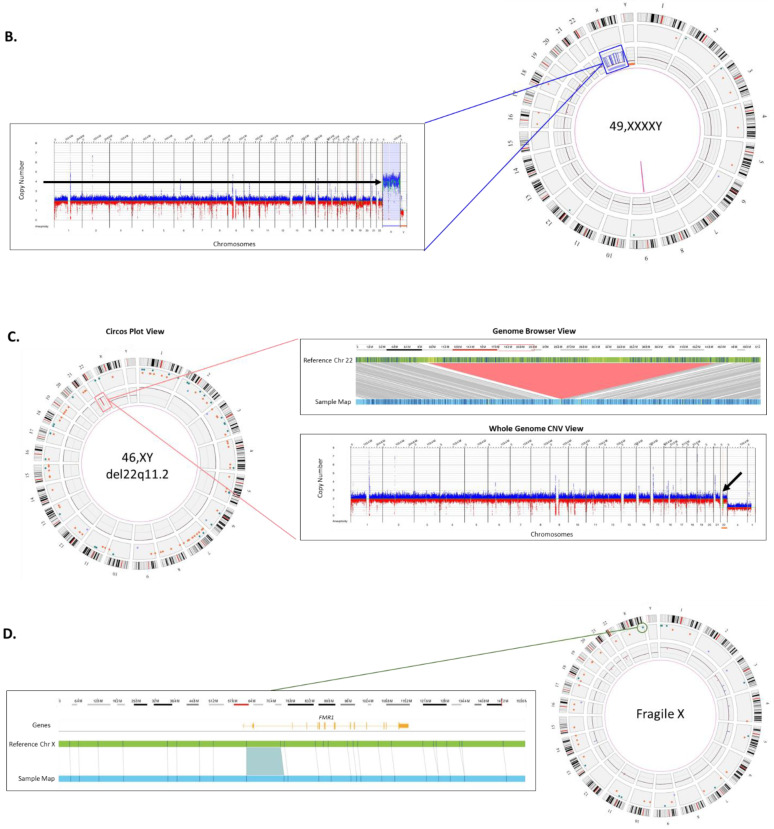
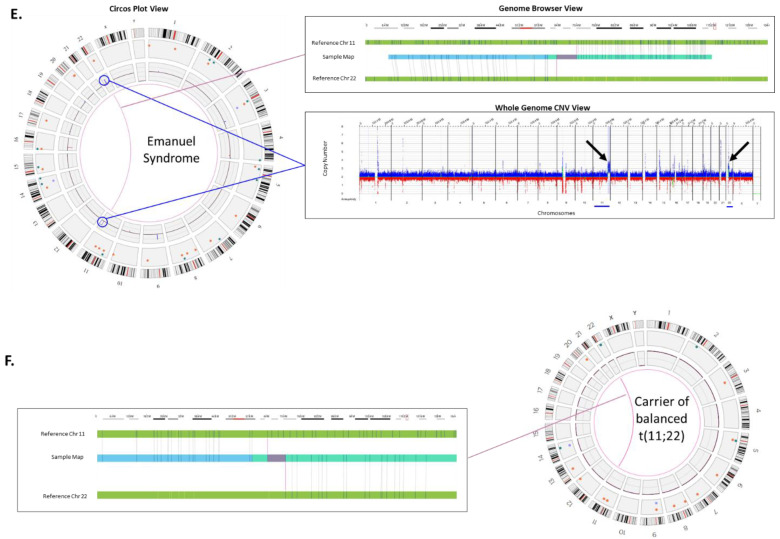
Global medical associations (ACOG, ISUOG, ACMG) recommend diagnostic prenatal testing for the detection and prevention of genetic disorders. Historically, cytogenetic methods such as karyotype analysis, fluorescent in situ hybridization (FISH) and chromosomal microarray (CMA) are utilized worldwide to diagnose common syndromes. However, the limitations of each of these methods, either performed in tandem or simultaneously, demonstrates the need of a revolutionary technology that can alleviate the need for multiple technologies. Optical genome mapping (OGM) is a novel method that fills this void by being able to detect all classes of structural variations (SVs), including copy number variations (CNVs). OGM is being adopted by laboratories as a tool for both postnatal constitutional genetic disorders and hematological malignancies. This commentary highlights the potential for OGM to become a standard of care in prenatal genetic testing based on its capability to comprehensively identify large balanced and unbalanced SVs (currently the strength of karyotyping and metaphase FISH), CNVs (by CMA), repeat contraction disorders (by Southern blotting) and multiple repeat expansion disorders (by PCR-based methods or Southern blotting). Next-generation sequencing (NGS) methods are excellent at detecting sequence variants, but they are unable to accurately resolve repeat regions of the genome, which limits their ability to detect all classes of SVs. Notably, multiple molecular methods are used to identify repeat expansion and contraction disorders in routine clinical laboratories around the world. With non-invasive prenatal testing (NIPT) becoming the standard of care screening assay for all global pregnancies, we anticipate that OGM can provide a high-resolution, cytogenomic assay to be employed following a positive NIPT screen or for high-risk pregnancies with an abnormal ultrasound. Accurate detection of all types of genetic disorders by OGM, such as liveborn aneuploidies, sex chromosome anomalies, microdeletion/microduplication syndromes, repeat expansion/contraction disorders is key to reducing the global burden of genetic disorders.

Keywords: OGM; aneuploidies; chromosomal aberrations; copy number variation; cytogenetics; cytogenomics; optical genome mapping; prenatal genetic testing; structural variation.


Conflict of interest statement

H.B., A.H. and A.C. are employees at Bionano Genomics Inc. H.B. also owns a limited number of stock options of Bionano Genomics Inc. The authors declare no conflict of interest.

Figures

Figure 1
Figure 1
Prenatal workflow for optical genome mapping. From top left to bottom right: Sample format can be from 1 million cells, cultured or directly from cells contained in amniotic fluid or chorionic villus sampling (CVS) sample and can be fresh or frozen. DNA is subsequently labelled at a 6 bp motif by the DLS labeling technology creating a label pattern that spans the whole genome and is unique to each individual sample. Labelled DNA is then loaded on a Saphyr Chip where DNA molecules are electrophoresed into nanochannels where they are uniformly linearized for imaging by the Saphyr instrument in repeated cycles. Images are processed to extract molecules that contain the linear positions of sequence motif labels. Multiple molecules are used to create consensus genome maps representing different alleles from the sample. The sample’s unique optical genome map is aligned to the reference genome and differences are automatically called, allowing for detection of structural variations in a genome wide fashion. (Image modified from: https://bionanogenomics.com, accessed on 2 December 2020).
Figure 2
Figure 2
Examples of structural variants (SVs) identified by Optical genome mapping (OGM). OGM circos plots are automatically generated and the default view is composed of the following layers: the outer circle displays cytoband locations, the middle circle displays color-coded interstitial SVs that were identified in those particular locations, and the innermost circle displays observed copy number changes for each chromosome or region. Translocations are reported as lines in the center connecting the genomic loci involved. (A) Left panel: represents the circos plot with a copy number gain visible and highlighted with a blue box on the circos plot around the inner circle of the CNV plot highlights the chromosome 21 gain, the right panel shows the whole genome CNV profile, a linear visualization of the CNV changes across the genome. The Y-axis represents the copy number change and X-axis lists the chromosome numbers. Gains are highlighted in blue while losses are highlighted in red. Here, the black arrow points to chromosome 21 that has 3 copies. (B) Right panel: shows the circos plot displaying SVs and an aneuploidy in the sample. The blue box around the inner circle of the CNV plot points to chromosome X gain. Left panel: the CNV plot shows a gain of chromosome X. The black arrow points to chromosome X, which is present in four copies. (C) Left panel: shows the circos plot summary displaying SVs in the sample. The orange box around a region on chromosome 22 highlights a pathogenic deletion. Top right panel: The genome browser view details the alignment of the sample’s consensus map (light blue bar) with the reference consensus maps (light green bars) and provides the detail of the structural variation. Here, the sample’s map alignment to the reference maps of chromosomes 22 illustrates a large ~3 Mbp deletion (light red). Bottom right panel: CNV plot showing loss on chromosome 22 (black arrow). (D) Right panel: shows the circos plot summary displaying SVs in the sample. The green circle in the middle circle highlights an insertion identified on chromosome X. Left panel: the genome browser view details the alignment of the sample’s consensus map (light blue bar) with the reference chromosome X (light green bars) showing a highlighted region on the sample map that contains an insertion. The insertion is within the FMR1 gene, inferred (and confirmed) to be a triplet repeat expansion. (E) Left panel: shows the circos plot summary displaying SVs in the sample. Blue lines point to regions on chromosomes 11 and 22 with CNV gains. The purple line points to a translocation also observed between chromosomes 11 and 22. Top right panel: The genome browser view detailing the alignment of the sample’s consensus map (light blue bar) with the reference chromosome 11 and 22. Here, the sample’s map aligns to two reference chromosomes indicating a translocation. Bottom right panel: CNV plot showing CNV gains on chromosomes 11 and 22 (black arrows). (F) The carrier mother of the case in Figure 2E showing a balanced translocation between chromosomes 11 and 22, but no CNV gains on either chromosome 11 or 22.
Figure 2
Figure 2
Examples of structural variants (SVs) identified by Optical genome mapping (OGM). OGM circos plots are automatically generated and the default view is composed of the following layers: the outer circle displays cytoband locations, the middle circle displays color-coded interstitial SVs that were identified in those particular locations, and the innermost circle displays observed copy number changes for each chromosome or region. Translocations are reported as lines in the center connecting the genomic loci involved. (A) Left panel: represents the circos plot with a copy number gain visible and highlighted with a blue box on the circos plot around the inner circle of the CNV plot highlights the chromosome 21 gain, the right panel shows the whole genome CNV profile, a linear visualization of the CNV changes across the genome. The Y-axis represents the copy number change and X-axis lists the chromosome numbers. Gains are highlighted in blue while losses are highlighted in red. Here, the black arrow points to chromosome 21 that has 3 copies. (B) Right panel: shows the circos plot displaying SVs and an aneuploidy in the sample. The blue box around the inner circle of the CNV plot points to chromosome X gain. Left panel: the CNV plot shows a gain of chromosome X. The black arrow points to chromosome X, which is present in four copies. (C) Left panel: shows the circos plot summary displaying SVs in the sample. The orange box around a region on chromosome 22 highlights a pathogenic deletion. Top right panel: The genome browser view details the alignment of the sample’s consensus map (light blue bar) with the reference consensus maps (light green bars) and provides the detail of the structural variation. Here, the sample’s map alignment to the reference maps of chromosomes 22 illustrates a large ~3 Mbp deletion (light red). Bottom right panel: CNV plot showing loss on chromosome 22 (black arrow). (D) Right panel: shows the circos plot summary displaying SVs in the sample. The green circle in the middle circle highlights an insertion identified on chromosome X. Left panel: the genome browser view details the alignment of the sample’s consensus map (light blue bar) with the reference chromosome X (light green bars) showing a highlighted region on the sample map that contains an insertion. The insertion is within the FMR1 gene, inferred (and confirmed) to be a triplet repeat expansion. (E) Left panel: shows the circos plot summary displaying SVs in the sample. Blue lines point to regions on chromosomes 11 and 22 with CNV gains. The purple line points to a translocation also observed between chromosomes 11 and 22. Top right panel: The genome browser view detailing the alignment of the sample’s consensus map (light blue bar) with the reference chromosome 11 and 22. Here, the sample’s map aligns to two reference chromosomes indicating a translocation. Bottom right panel: CNV plot showing CNV gains on chromosomes 11 and 22 (black arrows). (F) The carrier mother of the case in Figure 2E showing a balanced translocation between chromosomes 11 and 22, but no CNV gains on either chromosome 11 or 22.

Similar articles

Cited by

References

    1. Rose N.C., Kaimal A.J., Dugoff L., Norton M.E., American College of Obstetricians and Gynecologists Screening for Fetal Chromosomal Abnormalities: ACOG Practice Bulletin, Number 226. Obstet. Gynecol. 2020;136:e48–e69. - PubMed
    1. Salomon L., Alfirevic Z., Audibert F., Kagan K.O., Paladini D., Yeo G., Raine-Fenning N., ISUOG Clinical Standards Committee ISUOG consensus statement on the impact of non-invasive prenatal testing (NIPT) on prenatal ultrasound practice. Ultrasound Obstet. Gynecol. 2014;44:122–123. doi: 10.1002/uog.13393. - DOI - PubMed
    1. Gregg A.R., Skotko B.G., Benkendorf J.L., Monaghan K.G., Bajaj K., Best R.G., Klugman S., Watson M.S. Noninvasive prenatal screening for fetal aneuploidy, 2016 update: A position statement of the American College of Medical Genetics and Genomics. Genet. Med. 2016;18:1056–1065. doi: 10.1038/gim.2016.97. - DOI - PubMed
    1. Van Opstal D., Srebniak M.I. Cytogenetic confirmation of a positive NIPT result: Evidence-based choice between chorionic villus sampling and amniocentesis depending on chromosome aberration. Expert Rev. Mol. Diagn. 2016;16:513–520. doi: 10.1586/14737159.2016.1152890. - DOI - PubMed
    1. Carlson L.M., Vora N.L. Prenatal Diagnosis: Screening and Diagnostic Tools. Obstet. Gynecol. Clin. N. Am. 2017;44:245–256. doi: 10.1016/j.ogc.2017.02.004. - DOI - PMC - PubMed

Publication types

LinkOut - more resources