

Quantification of the Tradeoff between Test Sensitivity and Test Frequency in a COVID-19 Epidemic-A Multi-Scale Modeling Approach
- PMID: 33799660
- PMCID: PMC7999334
- DOI: 10.3390/v13030457
Quantification of the Tradeoff between Test Sensitivity and Test Frequency in a COVID-19 Epidemic-A Multi-Scale Modeling Approach
Abstract
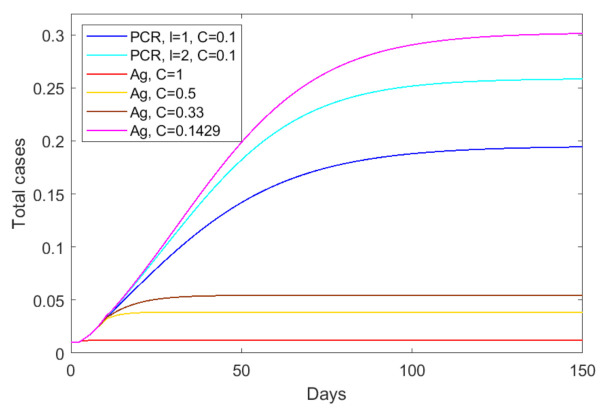
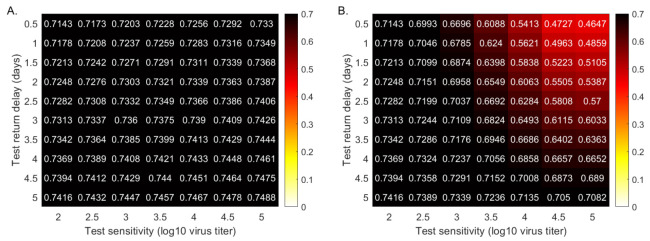
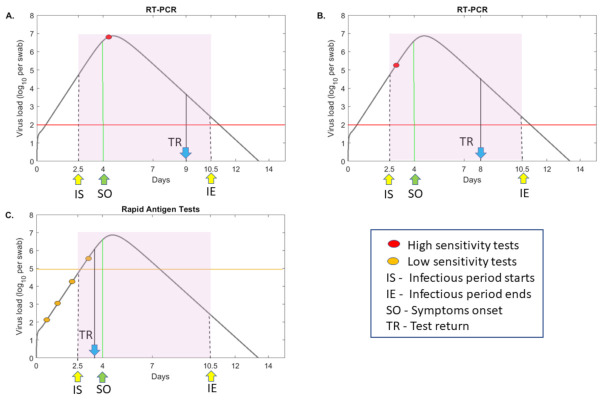
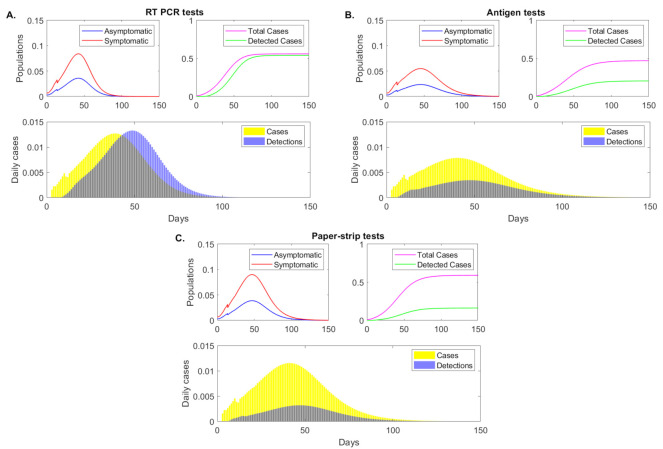
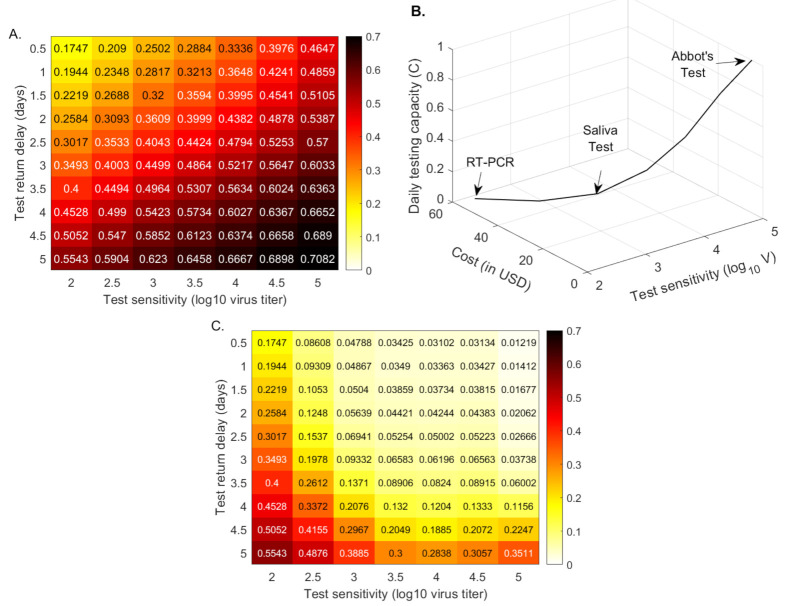
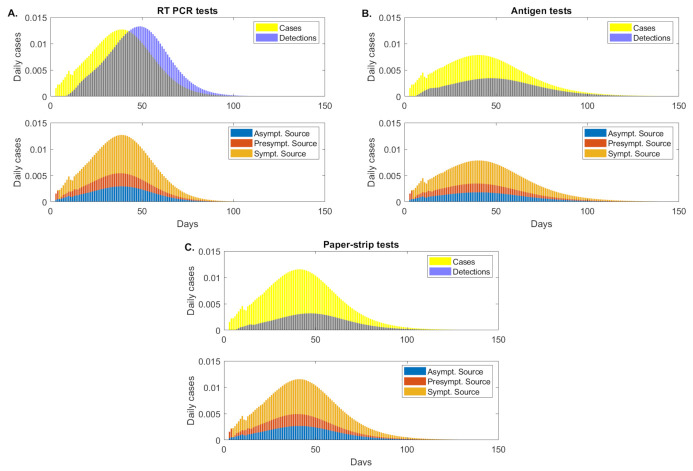
Control strategies that employ real time polymerase chain reaction (RT-PCR) tests for the diagnosis and surveillance of COVID-19 epidemic are inefficient in fighting the epidemic due to high cost, delays in obtaining results, and the need of specialized personnel and equipment for laboratory processing. Cheaper and faster alternatives, such as antigen and paper-strip tests, have been proposed. They return results rapidly, but have lower sensitivity thresholds for detecting virus. To quantify the effects of the tradeoffs between sensitivity, cost, testing frequency, and delay in test return on the overall course of an outbreak, we built a multi-scale immuno-epidemiological model that connects the virus profile of infected individuals with transmission and testing at the population level. We investigated various randomized testing strategies and found that, for fixed testing capacity, lower sensitivity tests with shorter return delays slightly flatten the daily incidence curve and delay the time to the peak daily incidence. However, compared with RT-PCR testing, they do not always reduce the cumulative case count at half a year into the outbreak. When testing frequency is increased to account for the lower cost of less sensitive tests, we observe a large reduction in cumulative case counts, from 55.4% to as low as 1.22% half a year into the outbreak. The improvement is preserved even when the testing budget is reduced by one half or one third. Our results predict that surveillance testing that employs low-sensitivity tests at high frequency is an effective tool for epidemic control.
Keywords: SARS-CoV-2; mathematical modeling; multiscale modeling; testing.
Conflict of interest statement
The authors declare no conflict of interest.
Figures
Similar articles
-
Effectiveness and cost-effectiveness of four different strategies for SARS-CoV-2 surveillance in the general population (CoV-Surv Study): a structured summary of a study protocol for a cluster-randomised, two-factorial controlled trial.Trials. 2021 Jan 8;22(1):39. doi: 10.1186/s13063-020-04982-z. Trials. 2021. PMID: 33419461 Free PMC article.
-
Predictors of negative first SARS-CoV-2 RT-PCR despite final diagnosis of COVID-19 and association with outcome.Sci Rep. 2021 Jan 27;11(1):2388. doi: 10.1038/s41598-021-82192-6. Sci Rep. 2021. PMID: 33504923 Free PMC article.
-
Accuracy and cost description of rapid antigen test compared with reverse transcriptase-polymerase chain reaction for SARS-CoV-2 detection.Dan Med J. 2021 Jun 14;68(7):A03210217. Dan Med J. 2021. PMID: 34169830
-
In vitro diagnostics of coronavirus disease 2019: Technologies and application.J Microbiol Immunol Infect. 2021 Apr;54(2):164-174. doi: 10.1016/j.jmii.2020.05.016. Epub 2020 Jun 5. J Microbiol Immunol Infect. 2021. PMID: 32513617 Free PMC article. Review.
-
A systematic review of the sensitivity and specificity of lateral flow devices in the detection of SARS-CoV-2.BMC Infect Dis. 2021 Aug 18;21(1):828. doi: 10.1186/s12879-021-06528-3. BMC Infect Dis. 2021. PMID: 34407759 Free PMC article.
Cited by
-
Analysis of the risk and pre-emptive control of viral outbreaks accounting for within-host dynamics: SARS-CoV-2 as a case study.Proc Natl Acad Sci U S A. 2023 Oct 10;120(41):e2305451120. doi: 10.1073/pnas.2305451120. Epub 2023 Oct 3. Proc Natl Acad Sci U S A. 2023. PMID: 37788317 Free PMC article.
-
Modeling the Influence of Vaccine Administration on COVID-19 Testing Strategies.Viruses. 2021 Dec 19;13(12):2546. doi: 10.3390/v13122546. Viruses. 2021. PMID: 34960814 Free PMC article.
-
A systematic review comparing at-home diagnostic tests for SARS-CoV-2: Key points for pharmacy practice, including regulatory information.J Am Pharm Assoc (2003). 2021 Nov-Dec;61(6):666-677.e2. doi: 10.1016/j.japh.2021.06.012. Epub 2021 Jun 12. J Am Pharm Assoc (2003). 2021. PMID: 34274214 Free PMC article.
-
Identifiability of parameters in mathematical models of SARS-CoV-2 infections in humans.Sci Rep. 2022 Aug 27;12(1):14637. doi: 10.1038/s41598-022-18683-x. Sci Rep. 2022. PMID: 36030320 Free PMC article.
-
Projections of the transmission of the Omicron variant for Toronto, Ontario, and Canada using surveillance data following recent changes in testing policies.Infect Dis Model. 2022 Jun;7(2):83-93. doi: 10.1016/j.idm.2022.03.004. Epub 2022 Mar 30. Infect Dis Model. 2022. PMID: 35372735 Free PMC article.
References
-
- World Health Organization Coronavirus Disease (COVID-19) Dashboard. [(accessed on 12 February 2021)]; Available online: https://covid19.who.int/
Publication types
MeSH terms
Grants and funding
LinkOut - more resources
Full Text Sources
Other Literature Sources
Medical
Miscellaneous
