Long-Term Interannual and Seasonal Links between the Nutrient Regime, Sestonic Chlorophyll and Dominant Bluegreen Algae under the Varying Intensity of Monsoon Precipitation in a Drinking Water Reservoir
- PMID: 33799714
- PMCID: PMC7998934
- DOI: 10.3390/ijerph18062871
Long-Term Interannual and Seasonal Links between the Nutrient Regime, Sestonic Chlorophyll and Dominant Bluegreen Algae under the Varying Intensity of Monsoon Precipitation in a Drinking Water Reservoir
Abstract
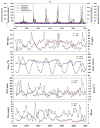
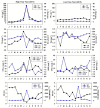
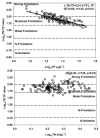
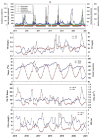
Long-term variations in reservoir water chemistry could provide essential data in making sustainable water quality management decisions. Here, we analyzed the spatiotemporal variabilities of nutrients, sestonic chlorophyll-a (CHL-a), nutrient enrichment, dominant algal species, and overall chemical water health of the third-largest drinking water reservoir in South Korea during 2000-2020. Our results distinctly explained the strong influence of monsoon rainfall on spatial and annual water chemistry variations. We observed a consistent increase in the chemical oxygen demand alluding to organic matter pollutants, while a steady declining trend in the sestonic CHL-a. The long-term total phosphorus (TP) level showed a steady reduction from the riverine zone to the lacustrine area. However, a higher total coliform bacteria (TCB) was observed at the water intake tower sites. TP displayed a strong link to algal CHL-a and ambient nitrogen phosphorus ratios, suggesting a robust phosphorus-limitation state. The severe phosphorus-limitation was also corroborated by the findings of trophic state index deviation. The high and low flow dynamics exhibited the strong influence of intensive rainfall carrying many nutrients and sediments and flushing out the sestonic CHL-a. Successive eutrophic conditions prevailed along with dominating blue-green algae species (Microcystis and Anabaena). We observed a strong positive correlation (r = 0.62) between water temperature and CHL-a and between total suspended solids and TP (r = 0.65). The multi-metric water pollution index characterized the overall water quality as 'good' at all the study sites. In conclusion, the long-term spatiotemporal variabilities of the ecological functions based on the nutrient-CHL-a empirical models are regulated mainly by the intensive monsoon precipitation. The drinking water could become hazardous under the recurrent eutrophication events and chemical degradations due to uncontrolled and untreated inflow of sewage and wastewater treatment plant effluents. Therefore, we strongly advocate stringent criteria to mitigate phosphorus and organic pollutant influx for sustainable management of Daecheong Reservoir.
Keywords: Daecheong Reservoir; algal blooms; drinking water; high flow; long-term water quality; nutrients; sewage pollution.
Conflict of interest statement
The authors declare no conflict of interest.
Figures






Similar articles
-
Seasonal Water Quality and Algal Responses to Monsoon-Mediated Nutrient Enrichment, Flow Regime, Drought, and Flood in a Drinking Water Reservoir.Int J Environ Res Public Health. 2021 Oct 13;18(20):10714. doi: 10.3390/ijerph182010714. Int J Environ Res Public Health. 2021. PMID: 34682459 Free PMC article.
-
Multiyear Links between Water Chemistry, Algal Chlorophyll, Drought-Flood Regime, and Nutrient Enrichment in a Morphologically Complex Reservoir.Int J Environ Res Public Health. 2020 Apr 30;17(9):3139. doi: 10.3390/ijerph17093139. Int J Environ Res Public Health. 2020. PMID: 32365942 Free PMC article.
-
Long-Term Water Quality Patterns in an Estuarine Reservoir and the Functional Changes in Relations of Trophic State Variables Depending on the Construction of Serial Weirs in Upstream Reaches.Int J Environ Res Public Health. 2021 Nov 29;18(23):12568. doi: 10.3390/ijerph182312568. Int J Environ Res Public Health. 2021. PMID: 34886296 Free PMC article.
-
Biochar-enhanced bioremediation of eutrophic waters impacted by algal blooms.J Environ Manage. 2024 Sep;367:122044. doi: 10.1016/j.jenvman.2024.122044. Epub 2024 Aug 3. J Environ Manage. 2024. PMID: 39096732 Review.
-
Evaluating nutrient impacts in urban watersheds: challenges and research opportunities.Environ Pollut. 2013 Feb;173:138-49. doi: 10.1016/j.envpol.2012.10.004. Epub 2012 Nov 29. Environ Pollut. 2013. PMID: 23202644 Review.
Cited by
-
Inter-Annual and Seasonal Variations of Water Quality and Trophic Status of a Reservoir with Fluctuating Monsoon Precipitation.Int J Environ Res Public Health. 2021 Aug 11;18(16):8499. doi: 10.3390/ijerph18168499. Int J Environ Res Public Health. 2021. PMID: 34444247 Free PMC article.
-
Enhancement of adsorption efficiency of crystal violet and chlorpyrifos onto pectin hydrogel@Fe3O4-bentonite as a versatile nanoadsorbent.Sci Rep. 2023 Jul 4;13(1):10764. doi: 10.1038/s41598-023-38005-z. Sci Rep. 2023. PMID: 37402768 Free PMC article.
-
Seasonal Water Quality and Algal Responses to Monsoon-Mediated Nutrient Enrichment, Flow Regime, Drought, and Flood in a Drinking Water Reservoir.Int J Environ Res Public Health. 2021 Oct 13;18(20):10714. doi: 10.3390/ijerph182010714. Int J Environ Res Public Health. 2021. PMID: 34682459 Free PMC article.
-
Comprehensive Assessment of Eutrophication in Xiamen Bay and Its Implications for Management Strategy in Southeast China.Int J Environ Res Public Health. 2022 Oct 11;19(20):13055. doi: 10.3390/ijerph192013055. Int J Environ Res Public Health. 2022. PMID: 36293633 Free PMC article.
-
Satellite-Based Monitoring of Eutrophication in the Earth's Largest Transboundary Lake.Geohealth. 2023 Apr 29;7(5):e2022GH000770. doi: 10.1029/2022GH000770. eCollection 2023 May. Geohealth. 2023. PMID: 37128244 Free PMC article.
References
-
- Mahdiyan O., Filazzola A., Molot L.A., Gray D., Sharma S. Drivers of water quality changes within the Laurentian Great Lakes region over the past 40 years. Limnol. Oceanogr. 2021;66:237–254. doi: 10.1002/lno.11600. - DOI
-
- Atique U., An K.-G. Reservoir Water Quality Assessment Based on Chemical Parameters and the Chlorophyll Dynamics in Relation to Nutrient Regime. Pol. J. Environ. Stud. 2019;28:1043–1061. doi: 10.15244/pjoes/85675. - DOI
-
- Lee S.W., Hwang S.J., Lee S.B., Hwang H.S., Sung H.C. Landscape ecological approach to the relationships of land use patterns in watersheds to water quality characteristics. Landsc. Urban Plan. 2009;92:80–89. doi: 10.1016/j.landurbplan.2009.02.008. - DOI
Publication types
MeSH terms
Substances
LinkOut - more resources
Full Text Sources
Other Literature Sources
Medical

