. 2021 Mar 11;13(6):1230.
doi: 10.3390/cancers13061230.

Single-Cell Deconvolution of Head and Neck Squamous Cell Carcinoma

Affiliations

Single-Cell Deconvolution of Head and Neck Squamous Cell Carcinoma

Zongtai Qi et al. Cancers (Basel). .

Abstract

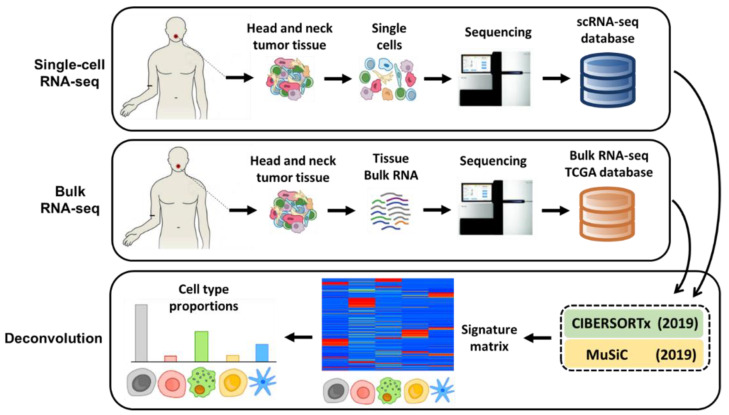
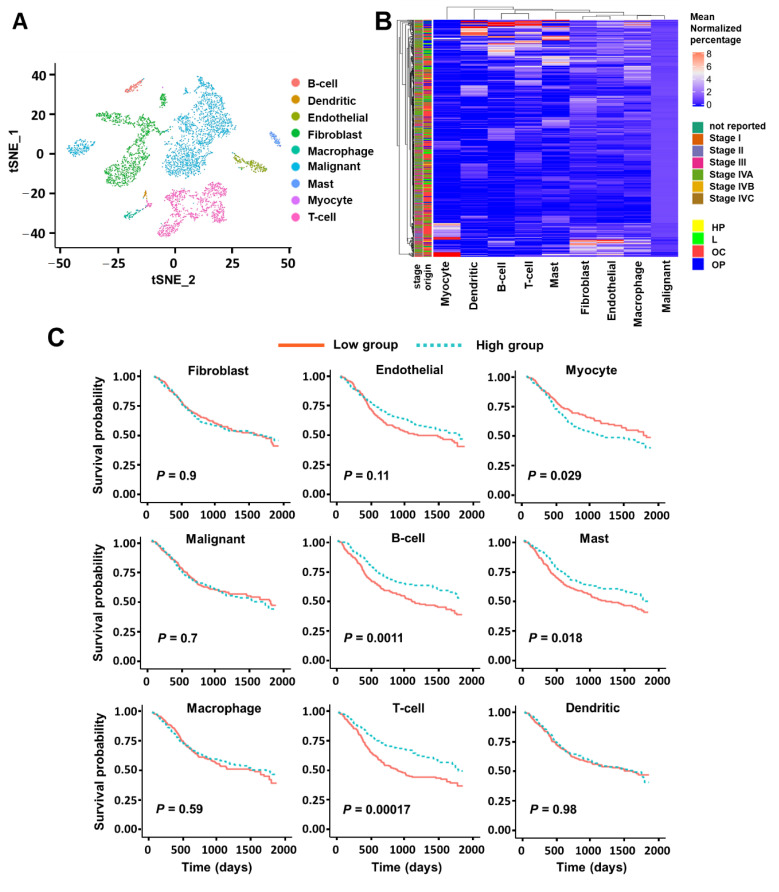
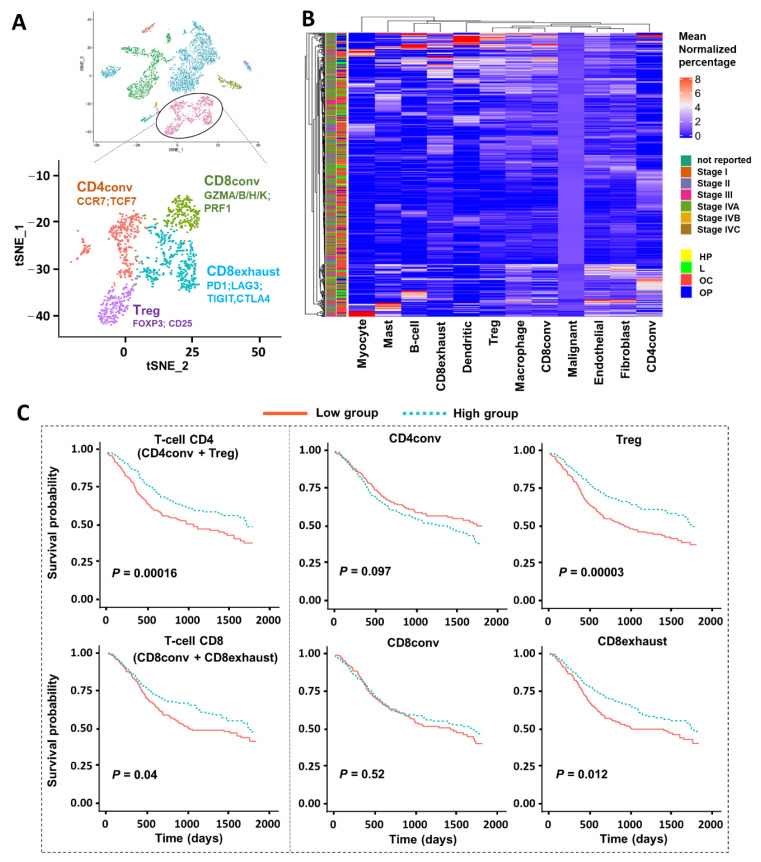
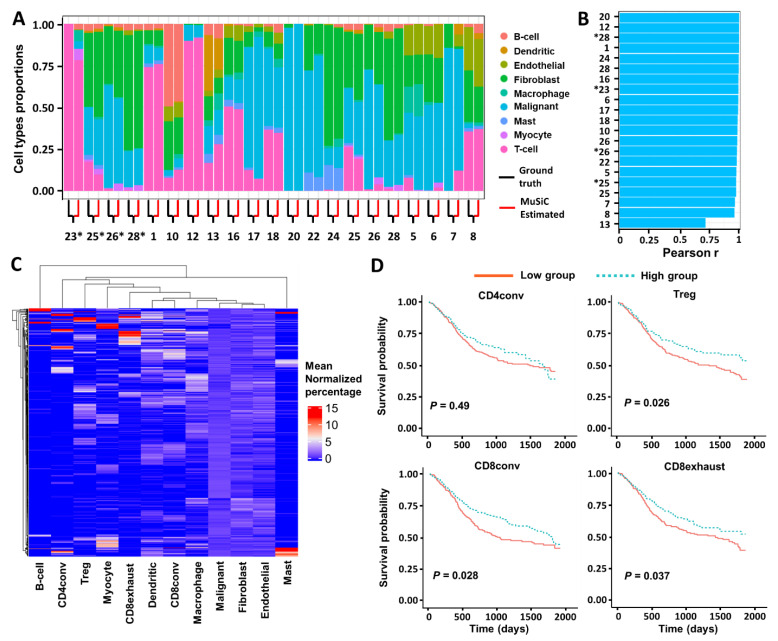
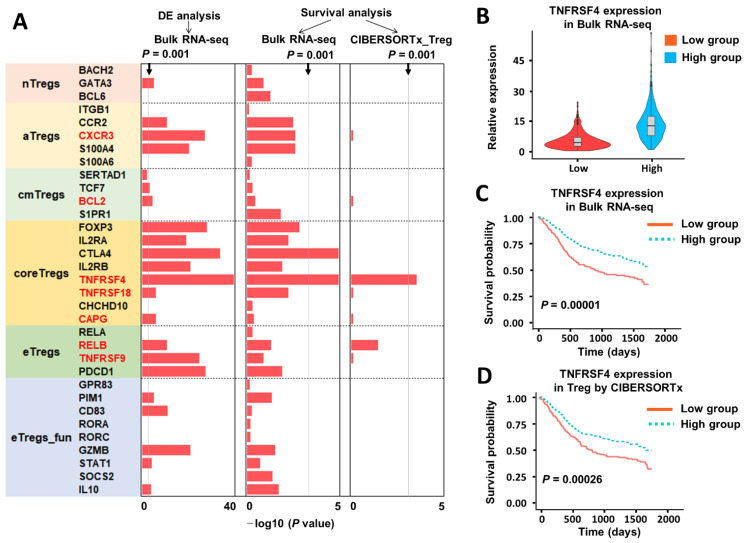
Complexities in cell-type composition have rightfully led to skepticism and caution in the interpretation of bulk transcriptomic analyses. Recent studies have shown that deconvolution algorithms can be utilized to computationally estimate cell-type proportions from the gene expression data of bulk blood samples, but their performance when applied to tumor tissues, including those from head and neck, remains poorly characterized. Here, we use single-cell data (~6000 single cells) collected from 21 head and neck squamous cell carcinoma (HNSCC) samples to generate cell-type-specific gene expression signatures. We leverage bulk RNA-seq data from >500 HNSCC samples profiled by The Cancer Genome Atlas (TCGA), and using single-cell data as a reference, apply two newly developed deconvolution algorithms (CIBERSORTx and MuSiC) to the bulk transcriptome data to quantitatively estimate cell-type proportions for each tumor in TCGA. We show that these two algorithms produce similar estimates of constituent/major cell-type proportions and that a high T-cell fraction correlates with improved survival. By further characterizing T-cell subpopulations, we identify that regulatory T-cells (Tregs) were the major contributor to this improved survival. Lastly, we assessed gene expression, specifically in the Treg population, and found that TNFRSF4 (Tumor Necrosis Factor Receptor Superfamily Member 4) was differentially expressed in the core Treg subpopulation. Moreover, higher TNFRSF4 expression was associated with greater survival, suggesting that TNFRSF4 could play a key role in mechanisms underlying the contribution of Treg in HNSCC outcomes.

Keywords: deconvolution; head and neck squamous cell carcinoma; regulatory T-cells; single-cell RNA sequencing.


Conflict of interest statement

The authors declare no conflict of interest.

Figures

Figure 1
Figure 1
Schematic illustration of the bulk RNA-sequencing (RNA-seq) deconvolution with single-cell reference profile. A schematic overview of deconvolution analysis is illustrated. First, we derived a cell-type expression matrix from our previously profiled transcriptomes of ~6000 single cells by SMART-seq2 protocol from 21 HNSCC (Head and Neck Squamous Cell Carcinomas) samples, including four matched pairs of primary tumors and lymph node metastases. This established a benchmark for cell-type proportions in heterogenous HNSCC tissue. Second, we obtained the bulk RNA-seq data from ~500 HNSCC samples within TCGA. Lastly, we used either CIBERSORTx or MuSiC to derive a signature matrix and then deconvolve the bulk RNA-seq data to get cell proportions.
Figure 2
Figure 2
CIBERSORTx analysis with scRNA-seq reference of nine major cell types. (A) t-SNE projection of scRNA-seq data from 21 HNSCC samples colored by nine major cell clusters. (B) Heatmap of the relative cell fractions of the nine major cell types for each sample estimated by CIBERSORTx. The percentage is normalized by the corresponding mean within each cell type. The tissue origin and tumor stage are annotated as side bars. (HP = Hypopharynx; L = Larynx; OC = Oral Cavity; OP = Oropharynx). (C) Association between cell proportions and overall survival in patients with HNSCC profiled by TCGA. Estimated cell proportions were stratified by a half–half split, and the separation between survival curves was evaluated using a log-rank test.
Figure 3
Figure 3
CIBERSORTx analysis based on T-cell subtypes/subpopulations. (A) t-SNE plots of T-cell population colored by four subtypes based on the corresponding marker genes: conventional CD4 T-cells (CD4conv; CCR7, TCF7), regulatory T-cells (Treg; FOXP3, CD25), conventional CD8 T-cells (CD8conv; GZMA/B/H/K, PRF1), and CD8 exhausted T-cells (CD8exhaust; PD1, LAG3, TIGIT, CTLA4). (B) Heatmap of the relative cell fractions of the 12 cell types (eight major cell types and four T-cell subtypes) for each sample estimated by CIBERSORTx. The percentage is normalized by the corresponding mean within each cell type. The tissue origin and tumor stage are annotated as side bars. (HP = Hypopharynx; L = Larynx; OC = Oral Cavity; OP = Oropharynx). (C) Association between cell proportions and overall survival in patients with HNSCC profiled by TCGA. Estimated cell proportions were stratified by a half–half split, and the separation between survival curves was evaluated using a log-rank test. The T-cell CD4 has two subtypes: conventional CD4 cells and regulatory T-cells (Tregs). The T-cell CD8 population includes conventional CD8 T-cells and exhausted CD8 T-cells.
Figure 4
Figure 4
MuSiC deconvolution based on T-cell subtypes/subpopulations. (A) Comparison of ground-truth cell proportions with the estimated proportions by MuSiC for all HNSCC samples. The validation run used a combination of 18 (reference) and 3 (validation). The ground-truth and estimated cell proportions are paired for each sample and demarcated by black and red lines, respectively. Sample tumor numbers shown with an asterisk (*) indicate metastatic samples. (B) Concordance between cell type proportions measured by scRNA-seq (ground truth) and MuSiC for all HNSCC samples. The validation run used a combination of 18 (reference) and 3 (validation). The correlation is calculated by Pearson method and samples have the same naming criteria as in (A). (C) Heatmap of the relative cell fractions of the 12 cell types (eight major cell types and four T-cell subtypes) for each sample estimated by MuSiC. The percentage is normalized by the corresponding mean within each cell type. (D) Association between cell proportions and overall survival in patients with HNSCC profiled by TCGA. Estimated cell proportions were stratified by a half–half split, and the separation between survival curves was evaluated using a log-rank test.
Figure 5
Figure 5
CIBERSORTx analysis of gene expression of regulatory T-cells (Treg). (A) Bar plot of the p-values calculated from differential gene analysis of low and high group defined by Treg proportions, log-rank tests for survival outcomes of the low and high fraction groups of Treg marker genes. In the first column, gene expression is obtained from bulk RNA-seq in TCGA. In the second column, gene expression is from the Treg subpopulation estimated by CIBERSORTx. Genes marked in red have imputed values noted. Gray lines represent the p-value threshold (p = 0.001). (B) Violin plot of TNFRSF4 expression in low and high group defined by Treg proportions. (C) Association between TNFRSF4 expression and overall survival in patients with HNSCC profiled by TCGA. Estimated cell proportions were stratified by a half–half split, and the separation between survival curves was evaluated using a log-rank test. (D) Association between Treg-specific TNFRSF4 expression estimated by CIBERSORTx and overall survival in patients with HNSCC profiled by TCGA. The same calculation method is performed as in (C).

References

    1. Puram S.V., Rocco J.W. Molecular aspects of head and neck cancer therapy. Hematol. Clin. N. Am. 2015;29:971–992. doi: 10.1016/j.hoc.2015.07.003. - DOI - PMC - PubMed
    1. Bray F., Ferlay J., Soerjomataram I., Siegel R.L., Torre L.A., Jemal A. Global cancer statistics 2018: GLOBOCAN estimates of incidence and mortality worldwide for 36 cancers in 185 countries. CA Cancer J. Clin. 2018;68:394–424. doi: 10.3322/caac.21492. - DOI - PubMed
    1. Chow L.Q.M. Head and neck cancer. N. Engl. J. Med. 2020;382:60–72. doi: 10.1056/NEJMra1715715. - DOI - PubMed
    1. Alsahafi E., Begg K., Amelio I., Raulf N., Lucarelli P., Sauter T., Tavassoli M. Clinical update on head and neck cancer: Molecular biology and ongoing challenges. Cell Death Dis. 2019;10:1–17. doi: 10.1038/s41419-019-1769-9. - DOI - PMC - PubMed
    1. Hanahan D., Weinberg R.A. Hallmarks of cancer: The next generation. Cell. 2011;144:646–674. doi: 10.1016/j.cell.2011.02.013. - DOI - PubMed