. 2021 Mar 11;13(6):1237.
doi: 10.3390/cancers13061237.

Mast Cell-Derived SAMD14 Is a Novel Regulator of the Human Prostate Tumor Microenvironment

Affiliations

Mast Cell-Derived SAMD14 Is a Novel Regulator of the Human Prostate Tumor Microenvironment

Linda K H Teng et al. Cancers (Basel). .

Abstract

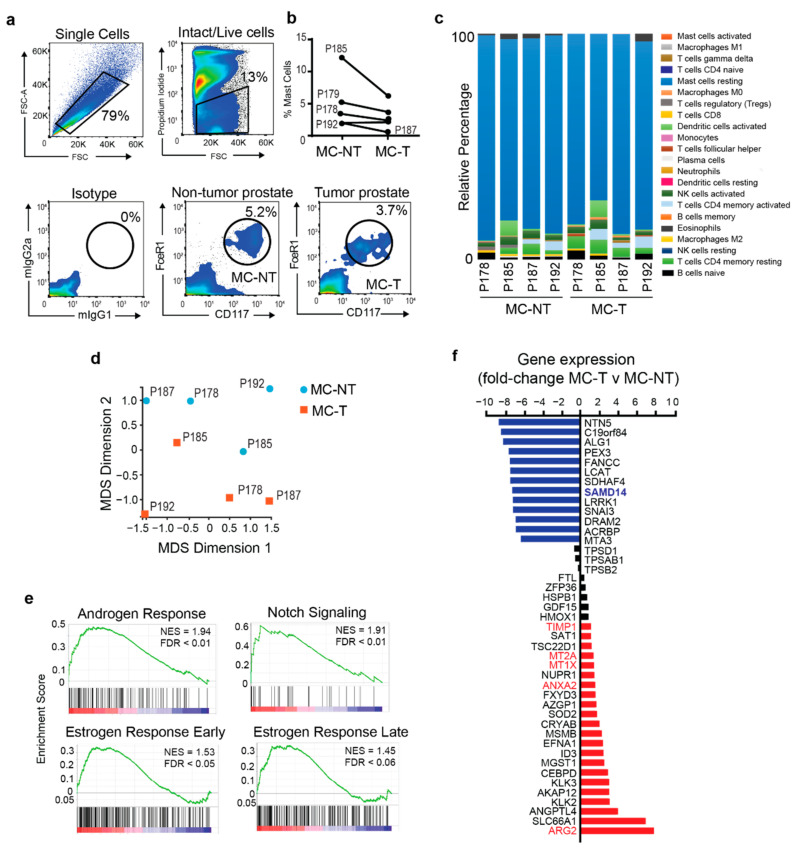
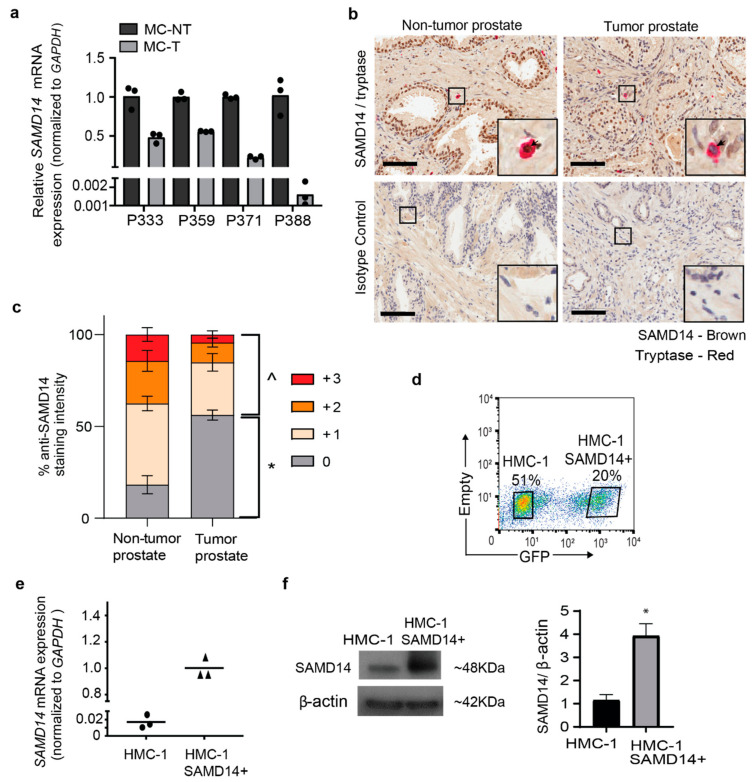
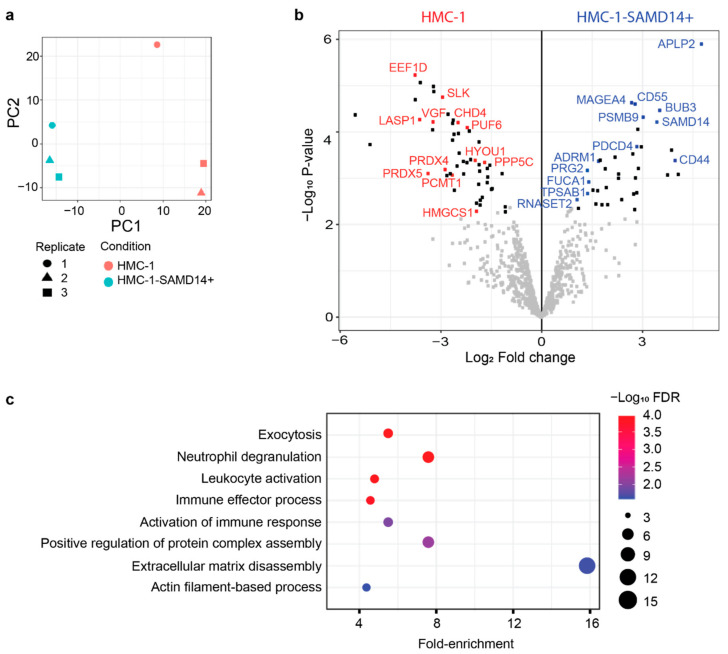
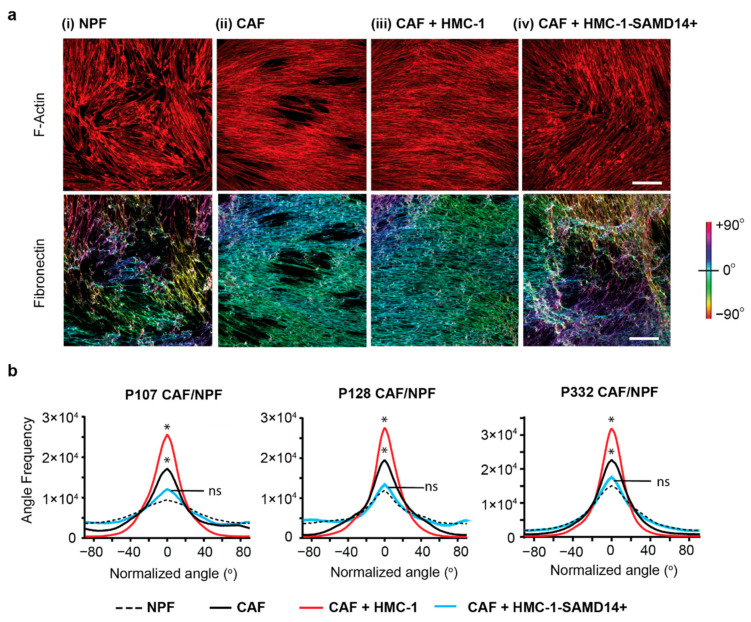
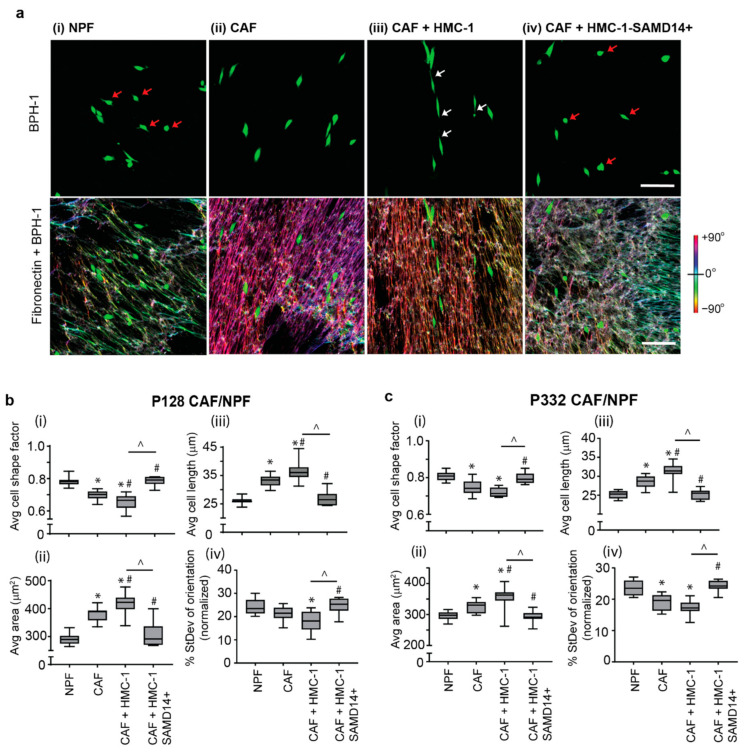
Mast cells (MCs) are important cellular components of the tumor microenvironment and are significantly associated with poor patient outcomes in prostate cancer and other solid cancers. The promotion of tumor progression partly involves heterotypic interactions between MCs and cancer-associated fibroblasts (CAFs), which combine to potentiate a pro-tumor extracellular matrix and promote epithelial cell invasion and migration. Thus far, the interactions between MCs and CAFs remain poorly understood. To identify molecular changes that may alter resident MC function in the prostate tumor microenvironment, we profiled the transcriptome of human prostate MCs isolated from patient-matched non-tumor and tumor-associated regions of fresh radical prostatectomy tissue. Transcriptomic profiling revealed a distinct gene expression profile of MCs isolated from prostate tumor regions, including the downregulation of SAMD14, a putative tumor suppressor gene. Proteomic profiling revealed that overexpression of SAMD14 in HMC-1 altered the secretion of proteins associated with immune regulation and extracellular matrix processes. To assess MC biological function within a model of the prostate tumor microenvironment, HMC-1-SAMD14+ conditioned media was added to co-cultures of primary prostatic CAFs and prostate epithelium. HMC-1-SAMD14+ secretions were shown to reduce the deposition and alignment of matrix produced by CAFs and suppress pro-tumorigenic prostate epithelial morphology. Overall, our data present the first profile of human MCs derived from prostate cancer patient specimens and identifies MC-derived SAMD14 as an important mediator of MC phenotype and function within the prostate tumor microenvironment.

Keywords: SAMD14; cancer-associated fibroblasts; extracellular matrix; mast cells; prostate cancer; tumor microenvironment.


Conflict of interest statement

The authors declare no conflict of interest.

Figures

Figure 1
Figure 1
Isolation and transcriptomic profiling of primary mast cells from human prostate tissue (a) Flow cytometric plots demonstrate gating strategy for mast cell isolation from primary human radical prostatectomy tissue based on isotype control staining. Plots are representative; n = 5 patients. (b) Graph shows the percentage of viable mast cells isolated from paired tumor (MC-T) and non-tumor (MC-NT) patient prostate tissue from 5 localized prostate cancer patients. (c) CIBERSORT analysis of primary mast cell RNAseq dataset shows that relative percentage of genes associated with immune subtypes. (d) MDS (multidimensional scaling) plot of MC-T (orange squares) and MC-NT (blue circles) patient samples based on gene expression. (e) GSEA analysis of MC-T and MC-NT transcriptomes using 50 hallmark gene sets (MSigDB) demonstrates enriched biological pathways in MC-T relative to MC-NT. Normalized enrichment score (NES); false discovery rate (FDR). (f) Differential gene expression analysis shows fold-change of genes decreased in MC-T (blue bars) and increased in MC-T (Red bars) based on false discovery rate (FDR) < 0.1 and fold-change (FC) > 2 relative to MC-NT; grey bars indicate FC < 2.
Figure 2
Figure 2
SAMD14 expression in primary mast cells. (a) SAMD14 mRNA expression in validation cohort of mast cells isolated from tumor (MC-T) and non-tumor (MC-NT) regions of human prostate tissue (n = 4 patients) normalized to GAPDH. (b) Images show representative human prostate tissue sections stained with SAMD14+ (brown) and tryptase+ mast cells (red) and corresponding isotype controls in matched non-tumor and tumor prostate tissues. Scale bars = 100 µm. Images are representative; n = 3 patients. (c) Semi-quantitative scoring of SAMD14 staining intensity in tryptase+ mast cells in non-tumor and tumor prostate tissue sections. Bar graph shows the average percentage (±SEM) SAMD14 staining intensity of 3 individual patient tissues (two-way ANOVA Sidak’s multiple comparisons test between tumor and non-tumor prostate tissue regions; ^ p < 0.0001 total SAMD14 positivity; * p < 0.0001 total SAMD14 negativity). (d) Flow cytometric plot shows isolation of live HMC-1-SAMD14 + cell-based GFP expression. Viable cells are gated using propidium iodide. Plot is representative; n = 5. (e) SAMD14 mRNA expression in FACS-purified GFP- (HMC-1) and GFP+ (HMC-1-SAMD14+) viable cells normalized to GAPDH. (f) Western blot show SAMD14 protein expression and β-actin loading control in HMC-1 and HMC-1-SAMD14+ purified cell populations; 25 µg of protein was loaded per lane. Quantification of blot by densitometry shows the average fold-change of SAMD14 expression in HMC-1 and HMC-1-SAMD14+ cells (unpaired student t-test; p < 0.005). Replicate and uncropped SAMD14 and β-actin western blots are shown in Figure S4.
Figure 3
Figure 3
Proteomic analysis of secreted proteins in HMC-1 CM and HMC-1-SAMD14+ CM. (a) PCA plot of HMC-1 (red) and HMC-1-SAMD14+ (blue) CM based on secreted protein analysis. For each condition, the experiment was repeated 3 times (circle, triangle, and square). (b) Volcano plot visualization of the differentially secreted proteins between HMC-1 (red) and HMC-1-SAMD14+ (blue) based on FDR < 0.05 cutoff (black). (c) Functional analysis of the secreted proteins in HMC-1-SAMD14+ CM compared to HMC-1 CM. The plot shows the functional categories that are over-represented in HMC-1-SAMD14+ CM relative to HMC-1 CM using a permutation-based false discovery rate (FDR) analysis.
Figure 4
Figure 4
SAMD14 overexpression in mast cells abrogated ECM alignment in CAFs (a) Representative image of CAF and NPF derived from P128. Prostate fibroblasts were visualized with F-actin staining (red). Fibronectin staining show ECM fiber alignment for cell-derived matrices produced by (i) NPF, (ii) CAF and (iii) CAF + HMC-1 CM and (iv) CAF + HMC-1-SAMD14+ CM. ECM Images were processed and color-coded to represent the degree of fiber orientation distribution within each sample. Scale bar: 200 µm. (b) Quantification of fiber alignment for NPF, CAF and CAF cultured with HMC-1 CM and HMC-1-SAMD14+ CM for the CAF and NPF derived from P332, P107, and P128. Line plots represent analysis with 4 technical replicates per patient, from 4 images per replicate. Statistics performed using Kruskal–Wallis test with Dunn’s post-hoc multiple comparisons test (*, p <0.05) to determine statistical significance. Data represented as mean.
Figure 5
Figure 5
SAMD14 overexpression in mast cells reduces pro-tumor prostate epithelial morphology. (a) Representative images show BPH-1 cell morphology when cultured with fibroblasts (CAF/NPF) derived from P128. Corresponding fibronectin staining after image processing to represent the degree of ECM fiber alignment produced by (i) NPF (from left), (ii) CAF, (iii) CAF + HMC-1 and (iv) CAF + HMC-1-SAMD14+ CM. Scale bar: 100 µm. (b) Quantification of (i) shape factor, (ii) area, (iii) cell length and (iv) standard deviation of orientation of BPH-1 cells cultured on NPF, CAF, CAF + HMC-1 CM and CAF + HMC-1-SAMD14+ CM (P128) after 24 h of co-culture. Box and whisker plots represent the max to min value of BPH-1 shape factor, area, cell length and standard deviation of orientation. (c) Quantification of (i) shape factor, (ii) area, (iii) cell length and (iv) standard deviation of orientation of BPH-1 cells on NPF, CAF, CAF + HMC-1 CM and CAF + HMC-1-SAMD14+ CM (P332) after 24 h of co-culture. Box and whisker plots represent the max to min value of BPH-1 shape factor, area, cell length and standard deviation of orientation. Graphs represent analysis of 3 images per replicate and 4 replicates are conducted per patient (>50 BPH-1 cells/image). Statistics performed using two-way ANOVA with Tukey’s post hoc test for average shape factor, area and cell length (* = p < 0.0001 compared to NPF; # = p < 0.005 compared to CAF; ^ = p < 0.0001 compared to CAF+ HMC-1) and a one-Way ANOVA with Tukey’s post hoc for average standard deviation of orientation (* = p < 0.001 compared to NPF; # = p < 0.05 compared to CAF; ^ = p < 0.001 compared to CAF+ HMC-1).

Similar articles

Cited by

References

    1. Bray F., Ferlay J., Soerjomataram I., Siegel R.L., Torre L.A., Jemal A. Global cancer statistics 2018: GLOBOCAN estimates of incidence and mortality worldwide for 36 cancers in 185 countries. CA Cancer J. Clin. 2018;68:394–424. doi: 10.3322/caac.21492. - DOI - PubMed
    1. Cunha G.R. Epithelio-mesenchymal interactions in primordial gland structures which become responsive to androgenic stimulation. Anat. Rec. 1972;172:179–195. doi: 10.1002/ar.1091720206. - DOI - PubMed
    1. Goldstein A.S., Witte O.N. Does the microenvironment influence the cell types of origin for prostate cancer? Genes Dev. 2013;27:1539–1544. doi: 10.1101/gad.222380.113. - DOI - PMC - PubMed
    1. Tuxhorn J.A., Ayala G.E., Rowley D.R. Reactive stroma in prostate cancer progression. J. Urol. 2001;166:2472–2483. doi: 10.1016/S0022-5347(05)65620-0. - DOI - PubMed
    1. Hagglof C., Bergh A. The stroma—A key regulator in prostate function and malignancy. Cancers. 2012;4:531–548. doi: 10.3390/cancers4020531. - DOI - PMC - PubMed