. 2021 Mar 11;13(3):463.
doi: 10.3390/v13030463.

Spatiotemporal Analysis of COVID-19 Incidence Data

Affiliations

Spatiotemporal Analysis of COVID-19 Incidence Data

Ilaria Spassiani et al. Viruses. .

Abstract

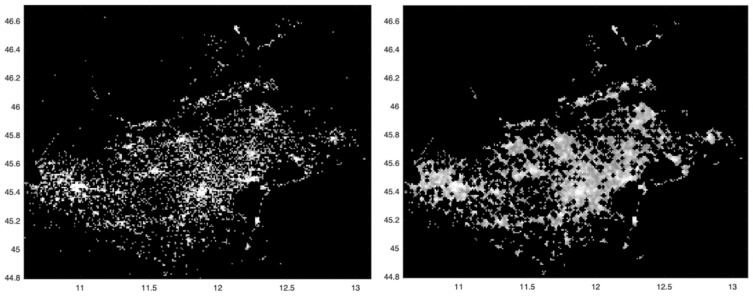
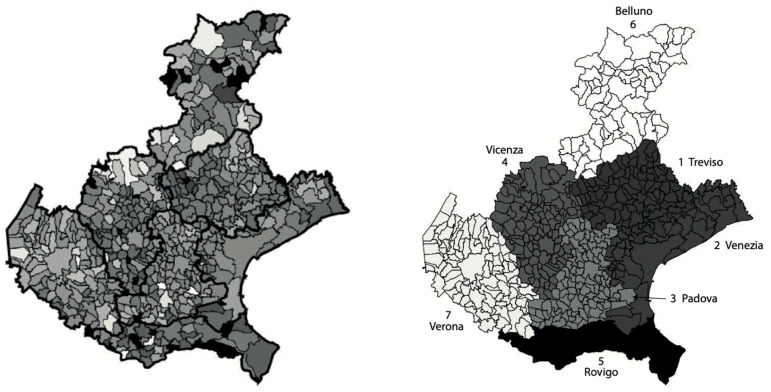
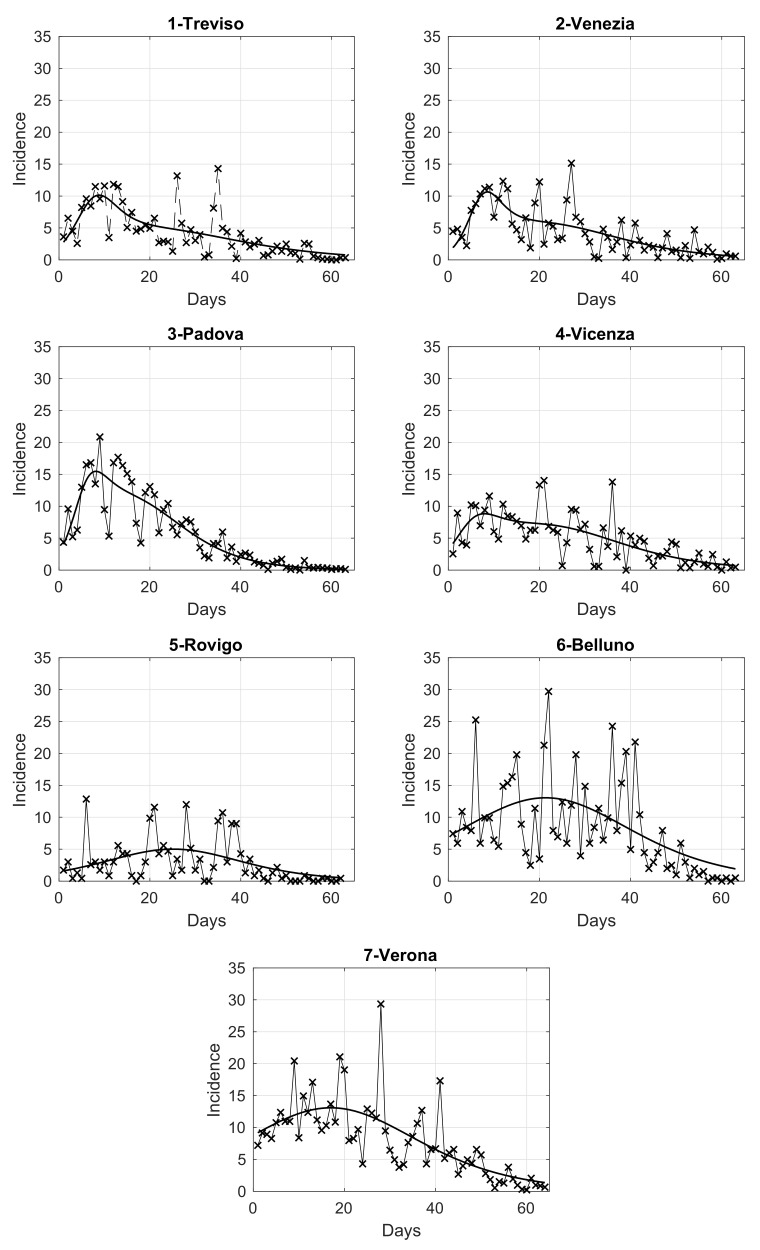
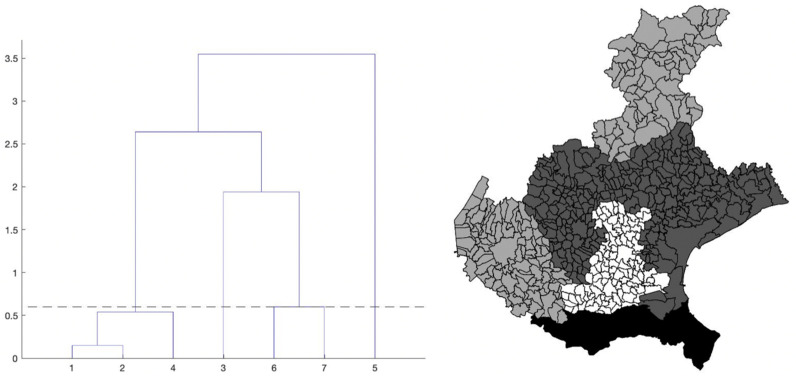
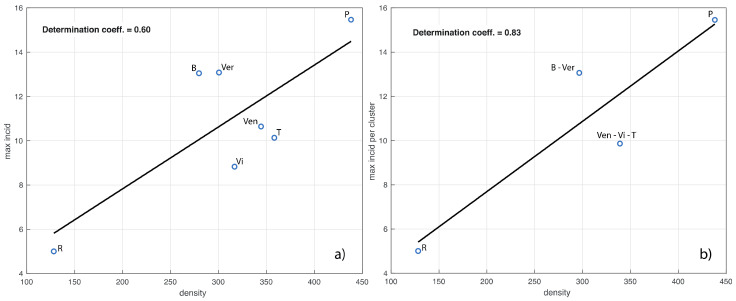
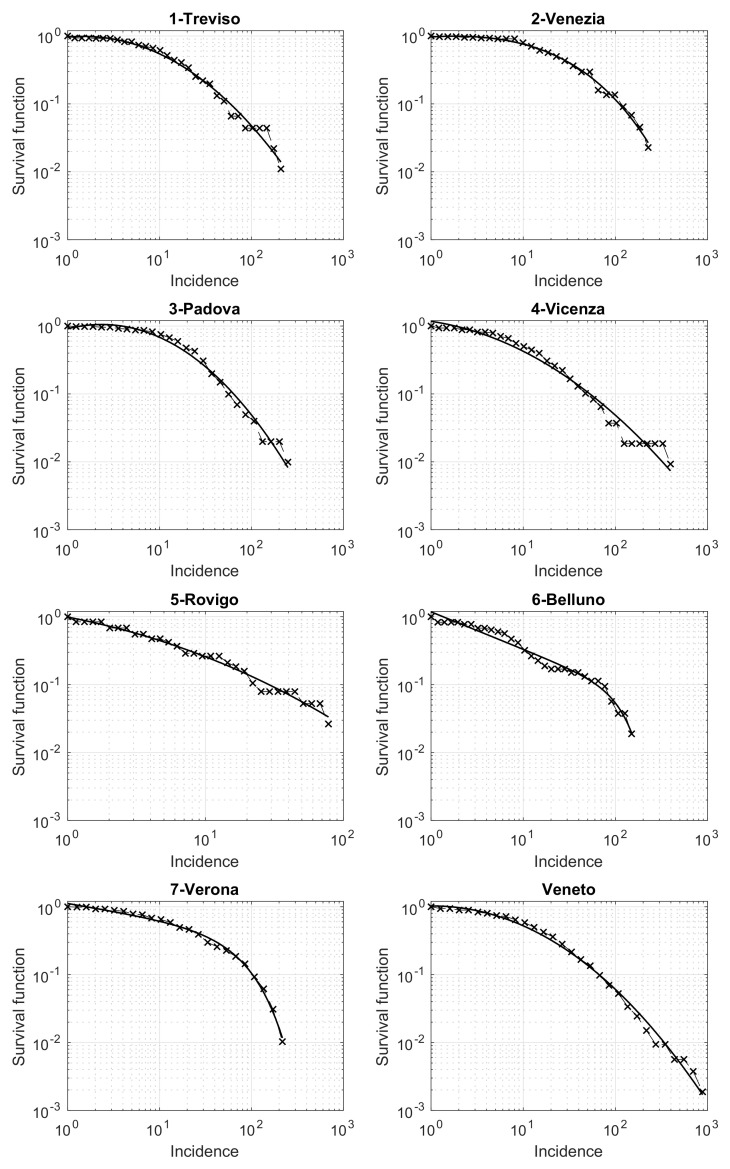
(1) Background: A better understanding of COVID-19 dynamics in terms of interactions among individuals would be of paramount importance to increase the effectiveness of containment measures. Despite this, the research lacks spatiotemporal statistical and mathematical analysis based on large datasets. We describe a novel methodology to extract useful spatiotemporal information from COVID-19 pandemic data. (2) Methods: We perform specific analyses based on mathematical and statistical tools, like mathematical morphology, hierarchical clustering, parametric data modeling and non-parametric statistics. These analyses are here applied to the large dataset consisting of about 19,000 COVID-19 patients in the Veneto region (Italy) during the entire Italian national lockdown. (3) Results: We estimate the COVID-19 cumulative incidence spatial distribution, significantly reducing image noise. We identify four clusters of connected provinces based on the temporal evolution of the incidence. Surprisingly, while one cluster consists of three neighboring provinces, another one contains two provinces more than 210 km apart by highway. The survival function of the local spatial incidence values is modeled here by a tapered Pareto model, also used in other applied fields like seismology and economy in connection to networks. Model's parameters could be relevant to describe quantitatively the epidemic. (4) Conclusion: The proposed methodology can be applied to a general situation, potentially helping to adopt strategic decisions such as the restriction of mobility and gatherings.

Keywords: COVID-19; hierarchical clustering; mathematical analysis; networks; spatial distribution.


Conflict of interest statement

The authors have no conflicts of interest to declare that are relevant to the content of this article.

Figures

Figure 1
Figure 1
Left: spatial distribution of the SARS-CoV-2 incidence in the period from 12 March to 15 May 2020, in all 1 km squared cells covering the Veneto region. Darker pixels correspond to lower intensity values. To increase the contrast of the image, a non-linear mapping (fourth root) is applied. Outlier values with very high intensity were reassigned through the 0.993 quantile (low-pass filter). Right: mathematical morphology opening operator applied to the image in the left panel followed by removal of “isolated” points. The values along x and y axes refer respectively to longitude and latitude.
Figure 2
Figure 2
Left: map of the SARS-CoV-2 municipalities incidences in Veneto relative to the period from 12 March to 15 May 2020, normalized by the corresponding populations at 31 December 2019. Intensity increases with respect to the normalized incidence. The intensities of a few municipalities with outlier values of the incidence were rescaled to increase the contrast of the map. The provinces boarders are thicker. Right: map of the Veneto provinces normalized incidences, obtained as the ratio between the sum of the total number of cases in all province municipalities and the corresponding total province population. The populations for the provinces (numbered from 1 to 7) are, respectively: 888,309; 851,663; 939,672; 862,363; 233,386; 201,972; 930,339.
Figure 3
Figure 3
Daily SARS-CoV-2 incidence in the seven provinces of Veneto, relative to the period from 12 March to 15 May 2020, normalized by the corresponding population at 31 December 2019, referred to 100,000 inhabitants. The continuous curve overlapped to the data is the best fit given by the extended logistic model.
Figure 4
Figure 4
Left: dendrogram from the hierarchical clustering analysis applied to the pairs (maximum value, maximum location) of the estimated curves of the daily SARS-CoV-2 normalized incidence of the seven Veneto provinces, shown in Figure 3. The numbers on the x-axis correspond to the province numbering in Figure 2, right panel. The numbers on the y-axis are instead the square root of the difference between the summation over the k clusters of the within cluster sum of squares, and the same quantity for k + 1 clusters, multiplied by √2. Right: provinces of the Veneto region with their municipalities, grouped according to the hierarchical clustering partition. The four province clusters identified are: cluster1 = {1-Treviso, 2-Venice, 4-Vicenza}; cluster2 = {3-Padua}; cluster3 = {6-Belluno, 7-Verona}; cluster4 = {5-Rovigo}. The greyscale intensity increases with the mean of the maximum value of the estimated curves in Figure 3, among the provinces belonging to the same cluster.
Figure 5
Figure 5
In panel (a) we show the linear fit of the maximum value of the province incidence curves in Figure 3 vs. the corresponding population density. In panel (b), the provinces are grouped according to the clusters shown in the right panel of Figure 4. The determination coefficients are also shown. The acronyms B, Ver, Ven, T, Vi, P and R stand for Belluno, Verona, Venezia, Treviso, Vicenza, Padua and Rovigo, respectively.
Figure 6
Figure 6
Survival function of the Veneto municipalities incidence in the period from 12 March to 15 May 2020, in a loglog scale. The best fit by the tapered Pareto model is shown by a continuous black line.

References

    1. Zhou F.T., Yu R., Du G., Fan Z., Liu J., Xiang Y., Wang B., Song X., Gu L., Guan Y., et al. Clinical course and risk factors for mortality of adult inpatients with covid-19 in Wuhan, China: A retrospective cohort study. Lancet. 2020;395:1054–1062. doi: 10.1016/S0140-6736(20)30566-3. - DOI - PMC - PubMed
    1. Wu Z., McGoogan J.M. Characteristics of and important lessons from the coronavirus disease 2019 (covid-19) outbreak in china: Summary of a report of 72314 cases from the chinese center for disease control and prevention. JAMA. 2020;323:1239–1242. doi: 10.1001/jama.2020.2648. - DOI - PubMed
    1. Guan W.J., Ni Z.Y., Hu Y., Liang W.H., Ou C.Q., He J.X., Liu L., Shan H., Lei C.-L., Hui D.S.C., et al. Clinical characteristics of coronavirus disease 2019 in China. N. Engl. J. Med. 2020;382:1708–1720. doi: 10.1056/NEJMoa2002032. - DOI - PMC - PubMed
    1. Velavan T.P., Meyer C.G. The COVID-19 epidemic. Trop. Med. Int. Health. 2020;25:278. doi: 10.1111/tmi.13383. - DOI - PMC - PubMed
    1. Wittkowski K.M. The first three months of the COVID-19 epidemic: Epidemiological evidence for two separate strains of SARS-CoV-2 viruses spreading and implications for prevention strategies. medRxiv. 2020 doi: 10.1101/2020.03.28.20036715. - DOI - PMC - PubMed

Publication types

LinkOut - more resources