. 2021 Mar 7;18(5):2683.
doi: 10.3390/ijerph18052683.

Alcohol-Induced Blood-Brain Barrier Impairment: An In Vitro Study

Affiliations

Alcohol-Induced Blood-Brain Barrier Impairment: An In Vitro Study

Donatello Carrino et al. Int J Environ Res Public Health. .

Abstract

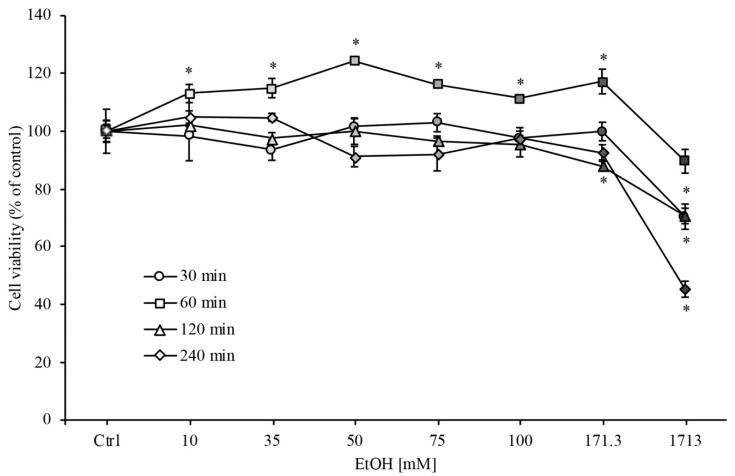
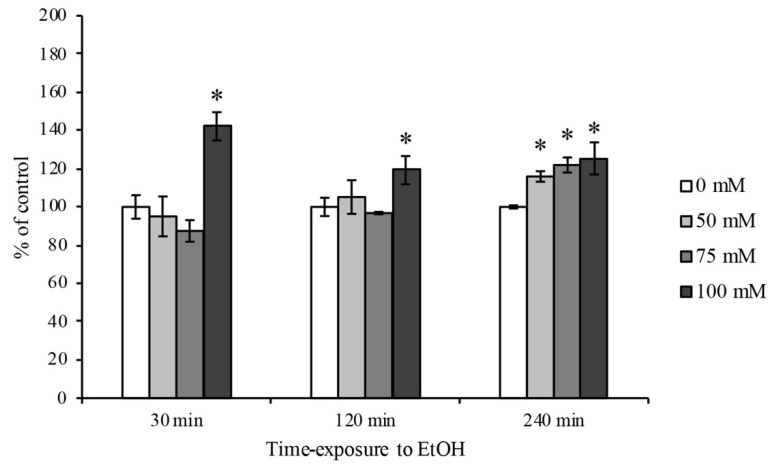
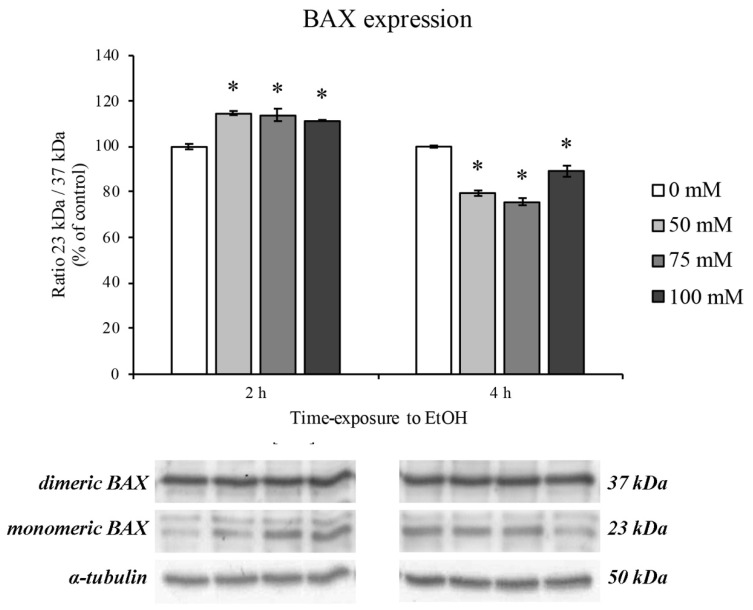
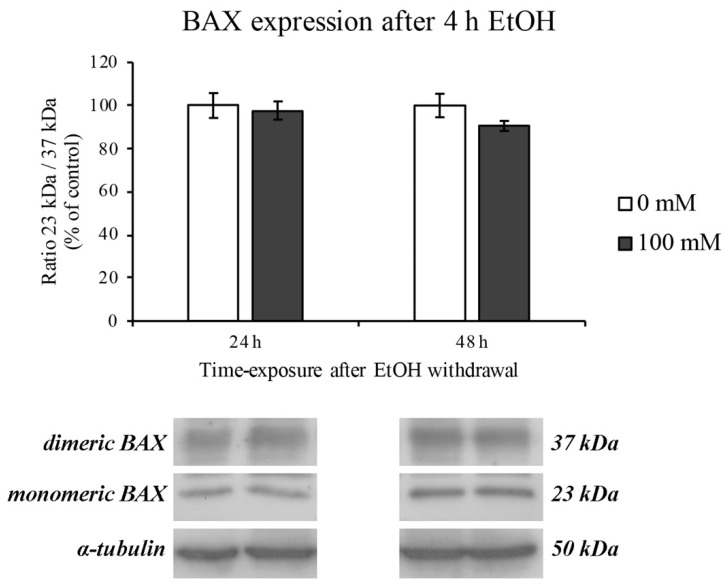
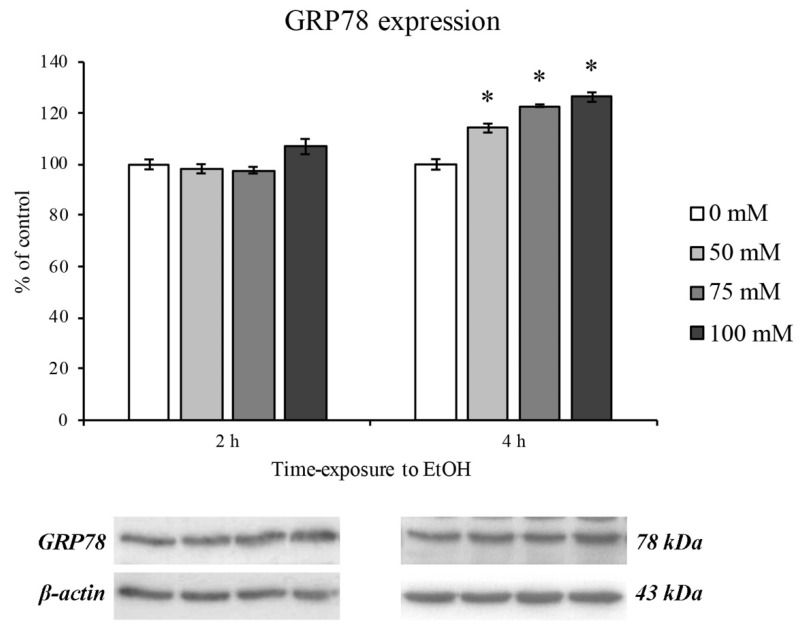
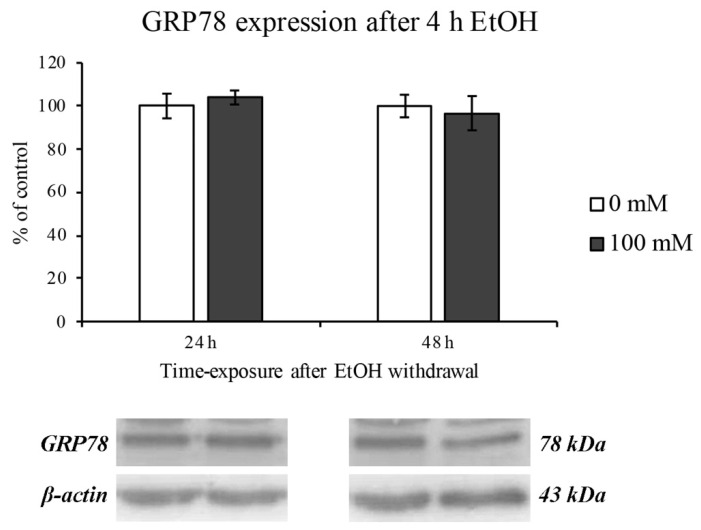
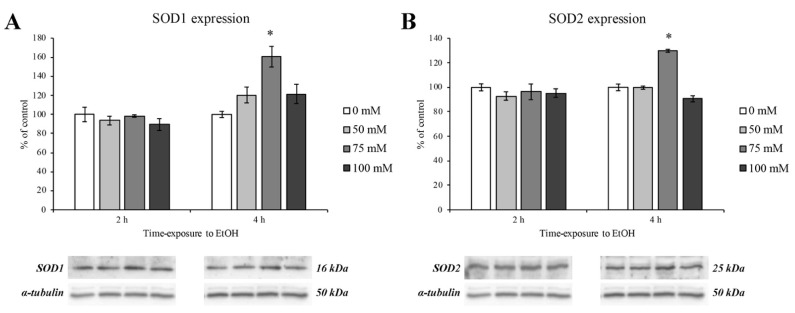
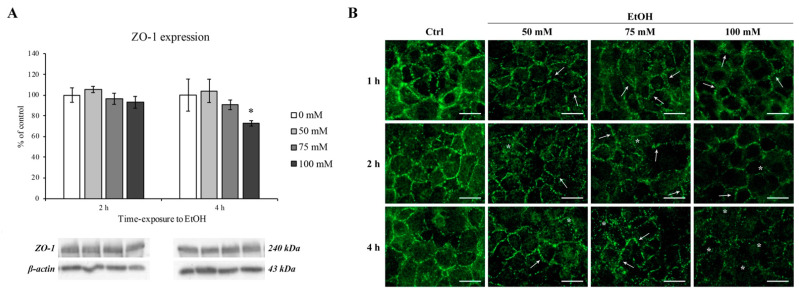
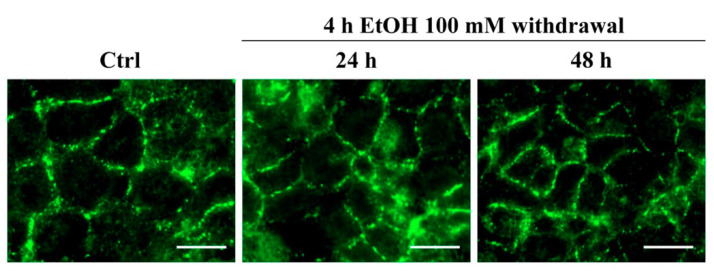
In recent years, alcohol abuse has dramatically grown with deleterious consequence for people's health and, in turn, for health care costs. It has been demonstrated, in humans and animals, that alcohol intoxication induces neuroinflammation and neurodegeneration thus leading to brain impairments. Furthermore, it has been shown that alcohol consumption is able to impair the blood-brain barrier (BBB), but the molecular mechanisms underlining this detrimental effect have not been fully elucidated. For this reason, in this study we investigated the effects of alcohol exposure on a rat brain endothelial (RBE4) cell line, as an in vitro-validated model of brain microvascular endothelial cells. To assess whether alcohol caused a concentration-related response, the cells were treated at different times with increasing concentrations (10-1713 mM) of ethyl alcohol (EtOH). Microscopic and molecular techniques, such as cell viability assay, immunofluorescence and Western blotting, were used to examine the mechanisms involved in alcohol-induced brain endothelial cell alterations including tight junction distribution, apoptosis, and reactive oxygen species production. Our findings clearly demonstrate that alcohol causes the formation of gaps between cells by tight junction disassembly, triggered by the endoplasmic reticulum and oxidative stress, highlighted by GRP78 chaperone upregulation and increase in reactive oxygen species production, respectively. The results from this study shed light on the mechanisms underlying alcohol-induced blood-brain barrier dysfunction and a better understanding of these processes will allow us to take advantage of developing new therapeutic strategies in order to prevent the deleterious effects of alcohol.

Keywords: alcohol abuse; alcoholism; blood–brain barrier; oxidative stress; tight junction.


Conflict of interest statement

The authors declare no conflict of interest.

Figures

Figure 1
Figure 1
RBE4 cell viability assay during ethanol (EtOH) treatment. RBE4 cells were incubated with increasing EtOH concentrations (10–1731 mM) for 30 min, 1, 2 and 4 h. Cell viability, quantified by MTT (3-(4,5-di-methylthiozol-2-yl)-2,5-diphenyltetrazolium bromide) assay (570 nm wavelength absorbance), decreased significantly (* p < 0.05) only at the highest EtOH concentrations. Values are expressed in percentage of control (untreated cells) absorbance as the mean ± S.E.M. of three independent experiments in quintuplicate. Grayscale refers to the increasing EtOH concentration. * p < 0.05 vs. control (untreated cells).
Figure 2
Figure 2
ROS quantification on RBE4 cells after EtOH treatment. Representative ROS production by H2DCFDA fluorescence probe after EtOH (50, 75 and 100 mM) treatment at 30 min, 2 and 4 h timepoints. The reported values are expressed in percentage of control (untreated cells) as the mean ± S.E.M. of three independent experiments in triplicate. * p < 0.05 vs. control for each timepoint.
Figure 3
Figure 3
Bcl-2-associated protein (BAX) expression on RBE4 cells after EtOH treatment. Representative Western blotting analysis of the EtOH (50–100 mM) effects on the protein levels of dimeric (upper bars) and monomeric (lower bars) BAX after 2 and 4 h of treatment. Value bars are expressed in percentage of control (untreated cells) as the mean ± S.E.M. of three independent experiments in triplicate. * p < 0.05 vs. control.
Figure 4
Figure 4
BAX expression on RBE4 cells after EtOH withdrawal. Representative Western blotting analysis after EtOH 100 mM withdrawal for 24 and 48 h. Value bars are expressed in percentage of control (untreated cells) as the mean ± S.E.M. of three independent experiments in triplicate.
Figure 5
Figure 5
ER stress (GRP78 expression) on RBE4 cells after EtOH treatment. Western blotting analysis and quantification of GRP78 expression during EtOH (50, 75 and 100 mM) treatments at 2 and 4 h timepoints. Values are expressed in percentage of control (untreated cells) as the mean ± S.E.M. of three independent experiments in triplicate. * p < 0.05 vs. control.
Figure 6
Figure 6
ER stress (GRP78 expression) on RBE4 cells after EtOH withdrawal. Western blotting analysis and quantification of GRP78 expression levels after 24 and 48 of EtOH 100 mM (4 h treatment) withdrawal. Values are expressed in percentage of control (untreated cells) as the mean ± S.E.M. of three independent experiments in triplicate.
Figure 7
Figure 7
SOD1 and SOD2 expression levels on RBE4 cells after EtOH treatment. Western blotting analysis and quantification of SOD1 (panel A) and SOD2 (panel B) protein expression levels during EtOH (50, 75 and 100 mM) treatments at 2 and 4 h. Values are expressed in percentage of control (untreated cells) as the mean ± S.E.M. of three independent experiments in triplicate. * p < 0.05 vs. control.
Figure 8
Figure 8
ZO-1 expression and immunofluorescent staining on RBE4 cells after EtOH treatment. (A) Western blotting analysis and quantification of ZO-1 after EtOH (50, 75 and 100 mM) exposure at 2 and 4 h. Values are expressed in percentage of control (untreated cells) as the mean ± S.E.M. of three independent experiments in triplicate. * p < 0.05 vs. control. (B) Changes in ZO-1 distribution were evaluated after EtOH (50, 75 and 100 mM) treatments at 1, 2, and 4 h in comparison to control (untreated cells). Arrows show the “zip-like” structure as indicative for morphological alterations in intercellular junctions. Asterisks show the presence of holes formed between endothelial cells. Scale bar: 25 µm.
Figure 9
Figure 9
ZO-1 immunofluorescent staining on RBE4 cells after EtOH withdrawal. The ZO-1 staining pattern of distribution evaluated after EtOH withdrawal showing a normal pattern of distribution. Scale bar: 25 µm.

Similar articles

Cited by

References

    1. World Health Organization . Global Status Report on Alcohol and Health 2018. World Health Organization; Geneva, Switzerland: 2018. Management of Substance Abuse Team.
    1. Osna N.A., Donohue T.M., Jr., Kharbanda K.K. Alcoholic Liver Disease: Pathogenesis and Current Management. Alcohol Res. Curr. Rev. 2017;38:147–161. - PMC - PubMed
    1. Larsson S.C., Burgess S., Mason A.M., Michaëlsson K. Alcohol Consumption and Cardiovascular Disease: A Mendelian Randomization Study. Circ. Genom. Precis. Med. 2020;13 doi: 10.1161/CIRCGEN.119.002814. - DOI - PMC - PubMed
    1. Bagnardi V., Rota M., Botteri E., Tramacere I., Islami F., Fedirko V., Scotti L., Jenab M., Turati F., Pasquali E., et al. Alcohol Consumption and Site-Specific Cancer Risk: A Comprehensive Dose–Response Meta-Analysis. Br. J. Cancer. 2015;112:580–593. doi: 10.1038/bjc.2014.579. - DOI - PMC - PubMed
    1. Trevejo-Nunez G., de Wit M. Alcohol Use As a Risk Factor in Infections and Healing. Alcohol Res. Curr. Rev. 2015;37:177–184. - PMC - PubMed

Substances

LinkOut - more resources