

Intratumor Heterogeneity in Uveal Melanoma BAP-1 Expression
- PMID: 33800007
- PMCID: PMC7962103
- DOI: 10.3390/cancers13051143
Intratumor Heterogeneity in Uveal Melanoma BAP-1 Expression
Abstract
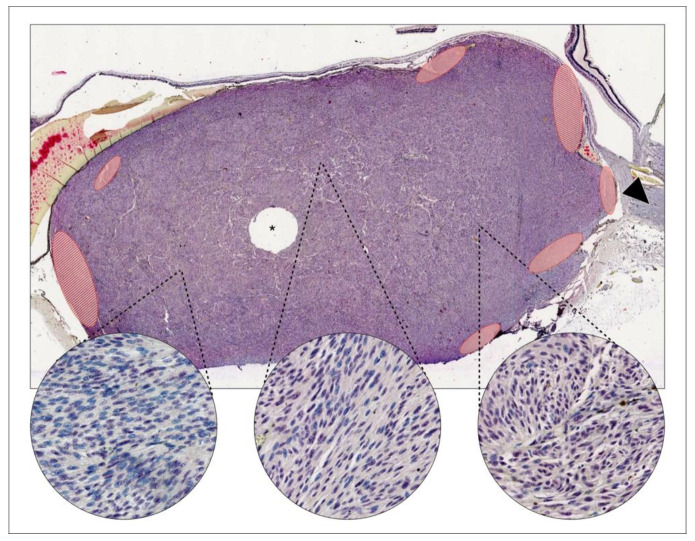
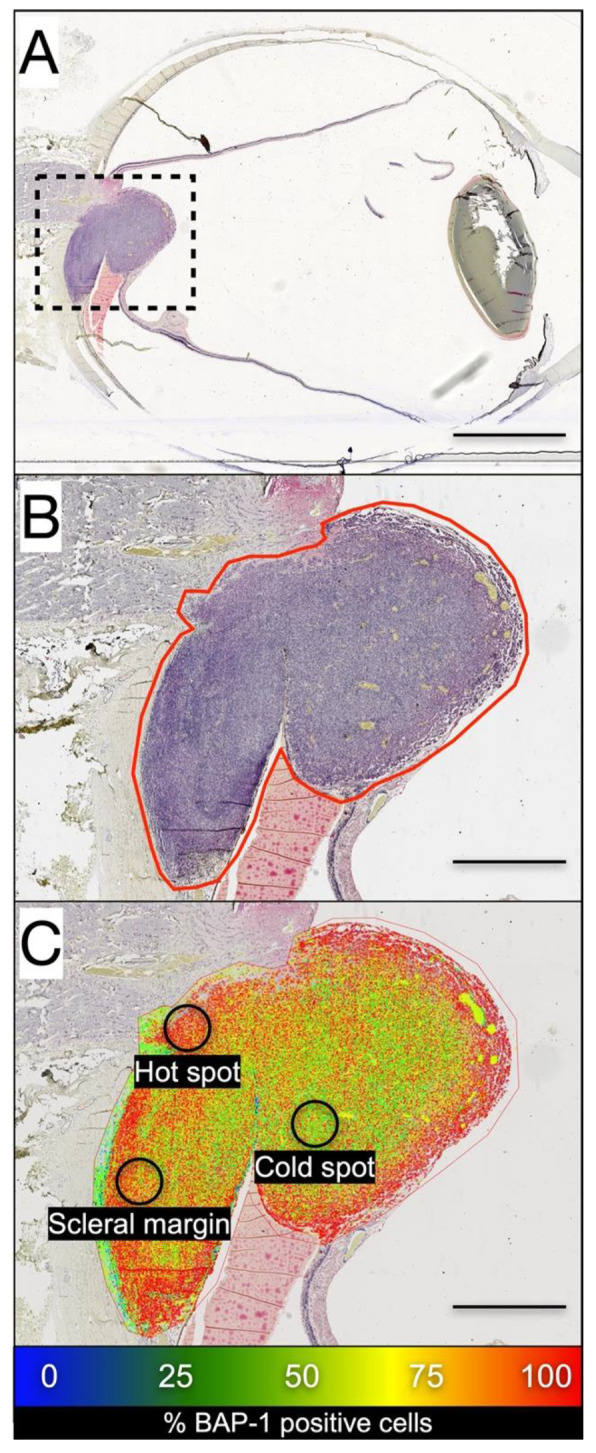
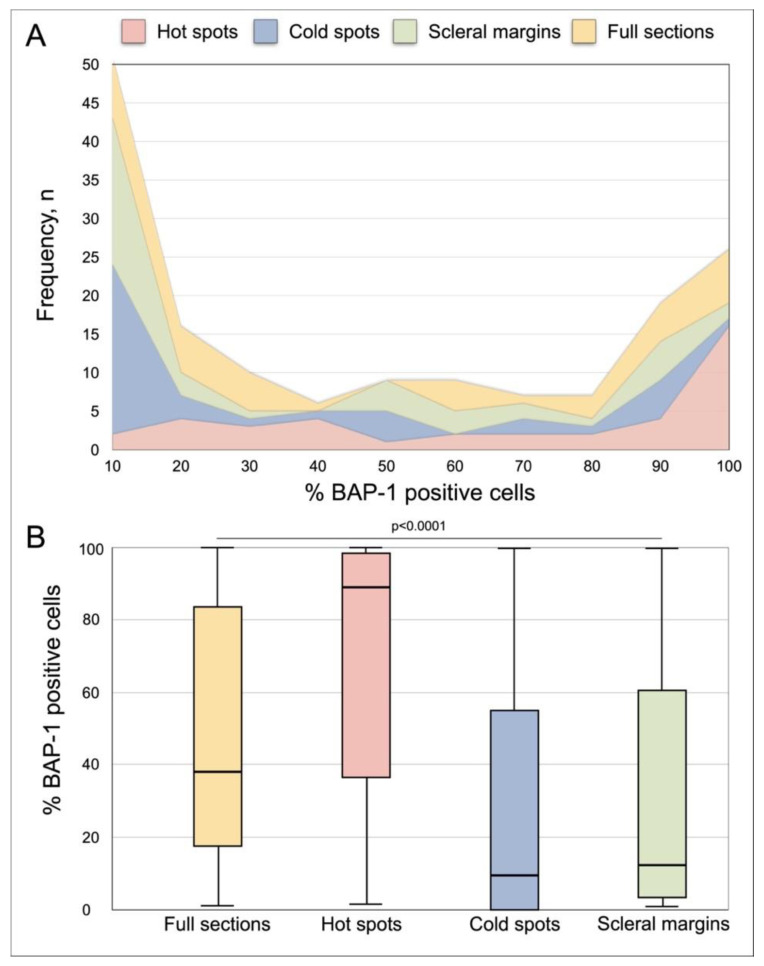
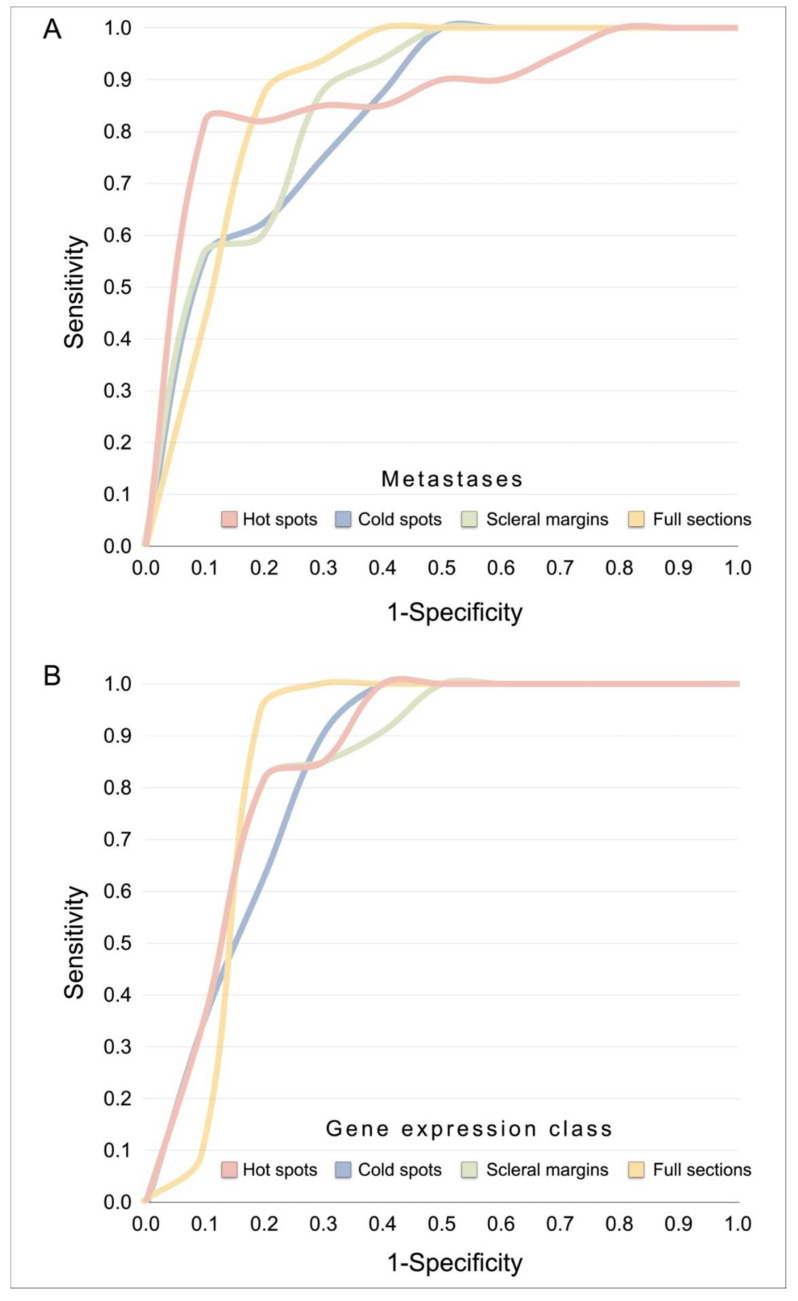
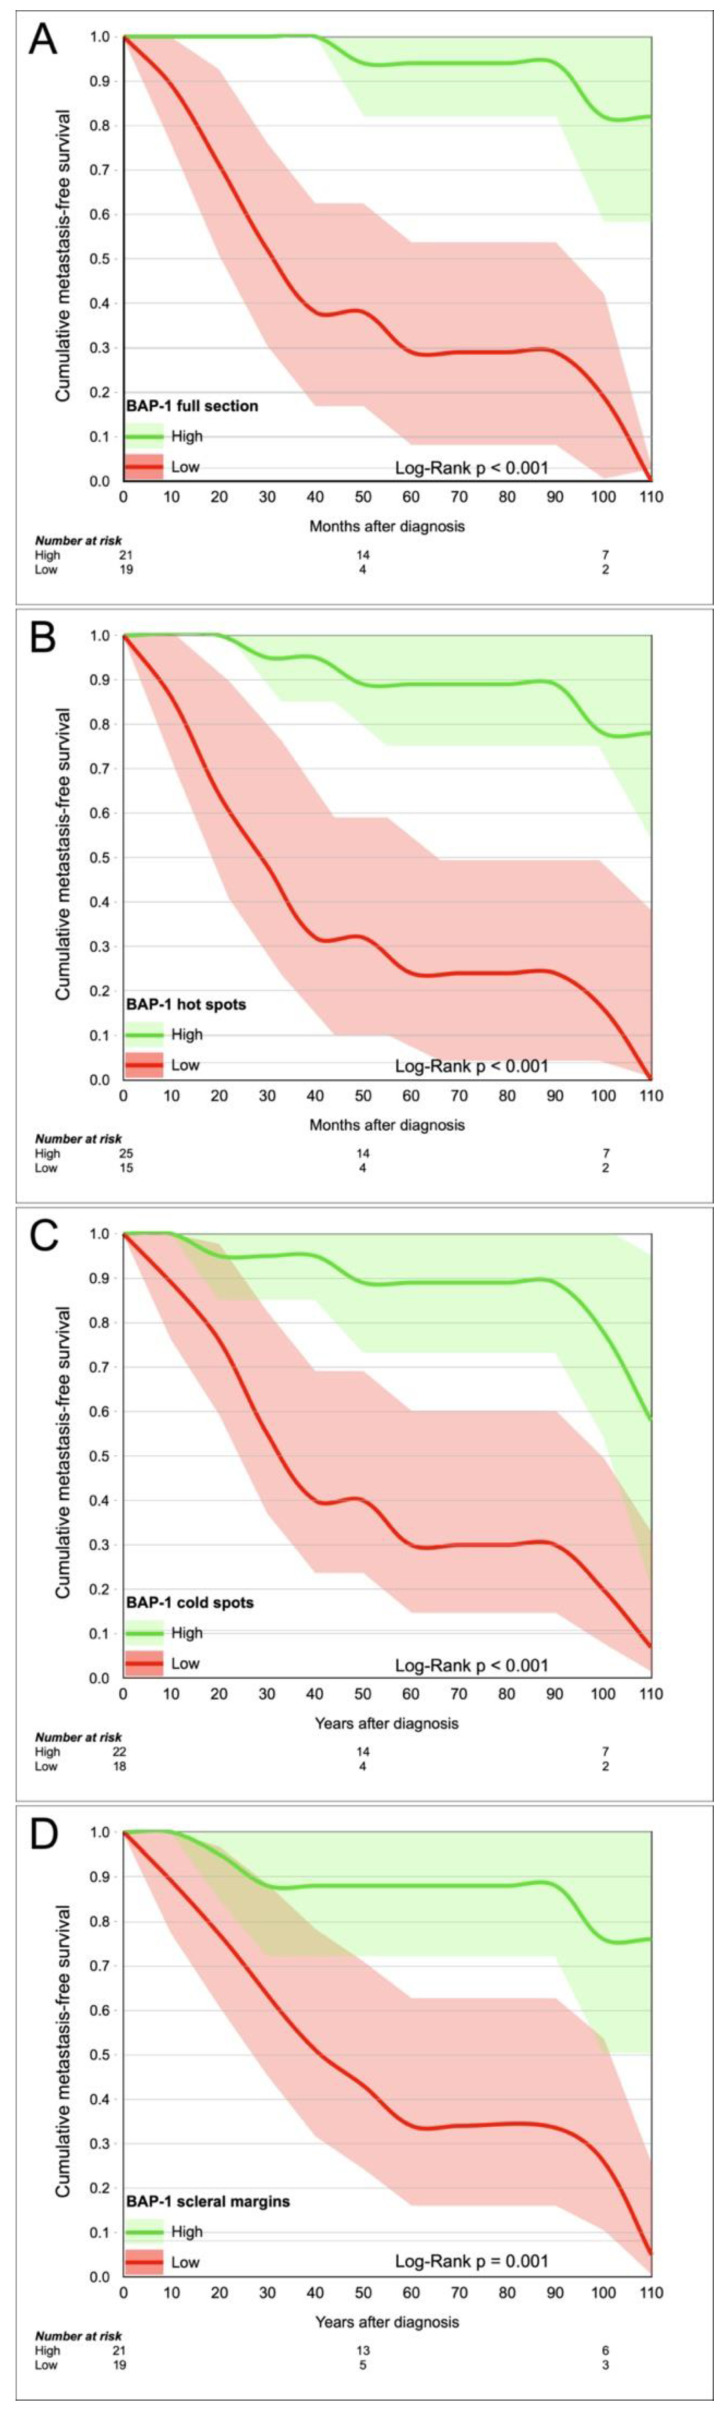
Malignant tumors are rarely homogenous on the morphological, genome, transcriptome or proteome level. In this study, we investigate the intratumor heterogeneity of BAP-1 expression in uveal melanoma with digital image analysis of 40 tumors. The proportion of BAP-1 positive cells was measured in full tumor sections, hot spots, cold spots and in scleral margins. The mean difference between hot spots and cold spots was 41 percentage points (pp, SD 29). Tumors with gene expression class 1 (associated with low metastatic risk) and 2 (high metastatic risk) had similar intratumor heterogeneity. Similarly, the level of intratumor heterogeneity was comparable in tumors from patients that later developed metastases as in patients that did not. BAP-1 measured in any tumor region added significant prognostic information to both American Joint Committee on Cancer (AJCC) tumor size category (p ≤ 0.001) and gene expression class (p ≤ 0.04). We conclude that there is substantial intratumor heterogeneity in uveal melanoma BAP-1 expression. However, it is of limited prognostic importance. Regardless of region, analysis of BAP-1 expression adds significant prognostic information beyond tumor size and gene expression class.
Keywords: BAP-1; survival; tumor heterogeneity; uveal melanoma.
Conflict of interest statement
The authors declare no conflict of interest.
Figures
Similar articles
-
Digital morphometry of tumor nuclei correlates to BAP-1 status, monosomy 3, gene expression class and survival in uveal melanoma.Exp Eye Res. 2020 Apr;193:107987. doi: 10.1016/j.exer.2020.107987. Epub 2020 Feb 22. Exp Eye Res. 2020. PMID: 32097618
-
Digital Image Analysis of BAP-1 Accurately Predicts Uveal Melanoma Metastasis.Transl Vis Sci Technol. 2019 May 6;8(3):11. doi: 10.1167/tvst.8.3.11. eCollection 2019 May. Transl Vis Sci Technol. 2019. PMID: 31110912 Free PMC article.
-
Chromosome 3 intratumor heterogeneity in uveal melanoma.Invest Ophthalmol Vis Sci. 2009 Feb;50(2):500-4. doi: 10.1167/iovs.08-2279. Epub 2008 Sep 29. Invest Ophthalmol Vis Sci. 2009. PMID: 18824727
-
Intratumor and Intertumor Heterogeneity in Melanoma.Transl Oncol. 2017 Dec;10(6):956-975. doi: 10.1016/j.tranon.2017.09.007. Epub 2017 Oct 24. Transl Oncol. 2017. PMID: 29078205 Free PMC article. Review.
-
New concepts in the molecular understanding of uveal melanoma.Curr Opin Ophthalmol. 2017 May;28(3):219-227. doi: 10.1097/ICU.0000000000000366. Curr Opin Ophthalmol. 2017. PMID: 28257297 Review.
Cited by
-
A serum protein signature at the time of Uveal Melanoma diagnosis predicts long-term patient survival.BMC Cancer. 2023 Mar 27;23(1):277. doi: 10.1186/s12885-023-10757-x. BMC Cancer. 2023. PMID: 36973672 Free PMC article.
-
Expression of GNAQ, BAP1, SF3B1, and EIF1AX Proteins in the Aqueous Humor of Eyes Affected by Uveal Melanoma.Invest Ophthalmol Vis Sci. 2024 Jan 2;65(1):15. doi: 10.1167/iovs.65.1.15. Invest Ophthalmol Vis Sci. 2024. PMID: 38175637 Free PMC article.
-
The prognostic implication of latitude in uveal melanoma: a nationwide observational cohort study of all patients born in Sweden between 1947 and 1989.Discov Oncol. 2022 Oct 31;13(1):116. doi: 10.1007/s12672-022-00584-0. Discov Oncol. 2022. PMID: 36310339 Free PMC article.
-
Digital morphometry and cluster analysis identifies four types of melanocyte during uveal melanoma progression.Commun Med (Lond). 2023 Apr 28;3(1):60. doi: 10.1038/s43856-023-00291-z. Commun Med (Lond). 2023. PMID: 37117276 Free PMC article.
-
Genetics and RNA Regulation of Uveal Melanoma.Cancers (Basel). 2023 Jan 26;15(3):775. doi: 10.3390/cancers15030775. Cancers (Basel). 2023. PMID: 36765733 Free PMC article. Review.
References
-
- Singh N., Bergman L., Seregard S., Singh A.D. Epidemiologic Aspects. In: Damato B., Singh A.D., editors. Clinical Ophthalmic Oncology: Uveal Tumors. 2nd ed. Springer; Berlin/Heidelberg, Germany: 2014. pp. 75–87.
Grants and funding
LinkOut - more resources
Full Text Sources
Other Literature Sources
Miscellaneous
