. 2021 Mar 8;11(3):652.
doi: 10.3390/nano11030652.

Antibacterial Activity of Positively and Negatively Charged Hematite (α-Fe2O3) Nanoparticles to Escherichia coli, Staphylococcus aureus and Vibrio fischeri

Affiliations

Antibacterial Activity of Positively and Negatively Charged Hematite (α-Fe2O3) Nanoparticles to Escherichia coli, Staphylococcus aureus and Vibrio fischeri

Svetlana Vihodceva et al. Nanomaterials (Basel). .

Abstract

In the current study, the antibacterial activity of positively and negatively charged spherical hematite (α-Fe2O3) nanoparticles (NPs) with primary size of 45 and 70 nm was evaluated against clinically relevant bacteria Escherichia coli (gram-negative) and Staphylococcus aureus (gram-positive) as well as against naturally bioluminescent bacteria Vibrio fischeri (an ecotoxicological model organism). α-Fe2O3 NPs were synthesized using a simple green hydrothermal method and the surface charge was altered via citrate coating. To minimize the interference of testing environment with NP's physic-chemical properties, E. coli and S. aureus were exposed to NPs in deionized water for 30 min and 24 h, covering concentrations from 1 to 1000 mg/L. The growth inhibition was evaluated following the postexposure colony-forming ability of bacteria on toxicant-free agar plates. The positively charged α-Fe2O3 at concentrations from 100 mg/L upwards showed inhibitory activity towards E. coli already after 30 min of contact. Extending the exposure to 24 h caused total inhibition of growth at 100 mg/L. Bactericidal activity of positively charged hematite NPs against S. aureus was not observed up to 1000 mg/L. Differently from positively charged hematite NPs, negatively charged citrate-coated α-Fe2O3 NPs did not exhibit any antibacterial activity against E. coli and S. aureus even at 1000 mg/L. Confocal laser scanning microscopy and flow cytometer analysis showed that bacteria were more tightly associated with positively charged α-Fe2O3 NPs than with negatively charged citrate-coated α-Fe2O3 NPs. Moreover, the observed associations were more evident in the case of E. coli than S. aureus, being coherent with the toxicity results. Vibrio fischeri bioluminescence inhibition assays (exposure medium 2% NaCl) and colony forming ability on agar plates showed no (eco)toxicity of α-Fe2O3 (EC50 and MBC > 1000 mg/L).

Keywords: MicrobeJ; antibacterial; confocal; environmental safety; hematite; hydrothermal synthesis; nano-bio interactions; surface charge; α-Fe2O3 nanoparticles.


Conflict of interest statement

The authors declare no conflict of interest. The funders had no role in the design of the study; in the collection, analyses, or interpretation of data; in the writing of the manuscript, or in the decision to publish the results.

Figures

Figure 1
Figure 1
(a) XRD patterns of α-Fe2O3 nanoparticles (NPs): (A) α-Fe2O3-p45, (B) α-Fe2O3-p70, (C) α-Fe2O3-n45, (D) α-Fe2O3-n70. The peak positions of the pure rhombohedral phase of α-Fe2O3 (ICDD 98-000-0240). (b) Attenuated total reflection–Fourier transform infrared (ATR-FTIR) spectra of α-Fe2O3 NPs before and after citrate coating.
Figure 2
Figure 2
SEM observation of α-Fe2O3 NPs prepared with different concentrations of Fe (III) nitrate, (A) 0.05 M (α-Fe2O3-p45), (B) 0.1 M (α-Fe2O3-p70), and after ɑ-Fe2O3 NPs coating with the citrate, (C) 0.05 M (α-Fe2O3-n45), (D) 0.1 M (α-Fe2O3-n70).
Figure 3
Figure 3
TEM images of the α-Fe2O3 NPs: (A) uncoated-positively charged (α-Fe2O3-p70), (B) citrate coated-negatively charged (α-Fe2O3-n70).
Figure 4
Figure 4
Visualization of stability of the α-Fe2O3 NPs in DI water and 2% NaCl (see also Table 3).
Figure 5
Figure 5
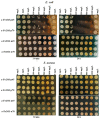
Viability of Escherichia coli (upper panels) and Staphylococcus aureus (lower panels) after exposure to α-Fe2O3 NPs in DI water for 30 min and 24 h at room temperature. Viability was evaluated by the ability of exposed bacteria to yield colonies at the nutrient agar plate as indicated on the panels.
Figure 6
Figure 6
Agar diffusion test using Escherichia coli: (a) α-Fe2O3-p45 (b) α-Fe2O3-n45. Exposure time 24 h, temperature 30 °C, Mueller–Hinton agar medium (MHA). Agar diffusion test images for Staphylococcus aureus can be found in the Supplementary Material (Figure S2).
Figure 7
Figure 7
Kinetics of the Vibrio fischeri bioluminescence inhibition upon exposure of bacteria to different concentrations of α-Fe2O3 NPs. (a) α-Fe2O3-p45; (b) α-Fe2O3-p70; (c) α-Fe2O3-n45; (d) α-Fe2O3-n70
Figure 8
Figure 8
Viability of Vibrio fischeri after exposure to α-Fe2O3 NPs in 2% NaCl for 30 min and 24 h at room temperature. Viability was evaluated by the ability of exposed bacteria to yield colonies at the Beneckea Harvey (BH) agar plate as indicated on the panels. Blue-green spots are bioluminescent bacterial colonies photographed in the dark; 3,5-dichlorophenol (3,5 DCP) was used as a positive control.
Figure 9
Figure 9
Generation of reactive oxygen species (ROS) measured with fluorescent dye DCF-DA in abiotic conditions (i.e., without of the cells) after 30 min (a) and 24 h (b) exposure to hematite NPs (1–100 mg/L), and Mn3O4 NPs—a positive control (0.1–100 mg/L)—in DI water. The values are presented as fold-increase in fluorescence in the presence of the NPs compared to the control (DI water); the mean of 4 experiments is given ± SD. All exposure concentrations are nominal. The dashed horizontal line indicates the ROS level in the DI water.
Figure 10
Figure 10
Generation of ROS measured with fluorescent dye DCF-DA in the biotic conditions after 30 min (ac) and 24 h (bd) exposure to hematite NPs (1–100 mg/L), and H2O2 as a positive control (1–100 mg/L for Escherichia coli; 1–1000 mg/L for Staphylococcus aureus) in DI water. The values are presented as fold-increase in fluorescence of exposed cells compared to unexposed cells; the mean of 3 experiments is given ± SD. All exposure concentrations are nominal. The dashed horizontal line highlights the ROS level in the control bacteria in DI water. Graphs of ROS generation in biotic conditions after 24 h of NP incubation with bacteria and 30 min after dye adding points can be found in the Supplementary Material (Figure S3).
Figure 11
Figure 11
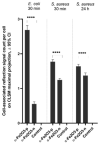
Representative maximal projections of confocal laser scanning microscopy (CLSM) images (pseudocolored: cellular Syto9 signal—cyan, NPs signal from reflection mode—red) of Escherichia coli (AF) and Staphylococcus aureus (GL) exposed to 100 mg/L α-Fe2O3-p (left column), α-Fe2O3-n (middle column) or incubated without NPs (right column) for 30 min. Merged multichannel images (AC,GI), as well as reflection channel signals, are presented (DF,JL). Scale bars represent 10 µm. Single-channel and multichannel projection images for 30 min and 24h time points can be found in the Supplementary Material (Figures S4 and S5). A respective quantitative analysis is presented in Figure 12.
Figure 12
Figure 12
Results for quantitative cellular fluorescent and reflective NP signal analysis from maximal projections of CLSM images of bacteria exposed to 100 mg/L NPs or unexposed controls. Significantly more (p < 0.0001; ****) α-Fe2O3-p NPs signals were associated with both Escherichia coli and Staphylococcus aureus cellular signals than α-Fe2O3-n NPs signals, showing that more positively charged NPs were associated with generally negatively charged bacterial cells than negatively charged NPs and that this effect was larger for of E. coli, which is also in concordance with α-Fe2O3-p NPs being more toxic to E. coli than S. aureus. The 24 h time point was excluded from analysis for E. coli due to lethal exposure and thus poor cellular signals. No reflective NPs signals were detected in nonexposed controls.
Figure 13
Figure 13
Quantification of hematite NPs binding to the bacteria Escherichia coli (a) and Staphylococcus aureus (b) by flow cytometry to determine the side-scattered (SSC) signal shift of Syto9-stained cells. Control cells-gated cell population is marked by the dashed red line. The spot test (c) shows that α-Fe2O3-p45 NPs at 50 mg/L were toxic to E. coli but not to S. aureus, and α-Fe2O3-n45 NPs were not toxic to both bacteria. After exposure to 70% ethanol for 60 min, the colony-forming ability of E. coli and S. aureus was not observed.

References

    1. Leung Y., Xu X., Ma A., Liu F., Ng A.M.C., Shen Z., Gethings L.A., Guo M.Y., Djurišić A.B., Lee P.K.H., et al. Toxicity of ZnO and TiO2 to Escherichia coli cells. Sci. Rep. 2016;6:35243. doi: 10.1038/srep35243. - DOI - PMC - PubMed
    1. Kashef N., Huang Y.Y., Hamblin R. Advances in antimicrobial photodynamic inactivation at the nanoscale. Nanophotonics. 2017;6:853–879. doi: 10.1515/nanoph-2016-0189. - DOI - PMC - PubMed
    1. Brushan M., Kumar Y., Periyasamy L., Viswanath A.K. Antibacterial applications of ɑ-Fe2O3/Co3O4 nanocomposites and study of their structural, optical, magnetic and cytotoxic characteristics. Appl. Nanosci. 2018;8:137–153. doi: 10.1007/s13204-018-0656-5. - DOI
    1. Abbaszadegan A., Ghahramani Y., Gholami A., Hemmateenejad B., Dorostkar S., Nabavizadeh M., Sharghi H. The effect of charge at the surface of silver nanoparticles on antimicrobial activity against gram-positive and gram-negative bacteria: A preliminary study. J. Nanomater. 2015;2015:720654. doi: 10.1155/2015/720654. - DOI
    1. Gabrielyan L., Hovhannisyn A., Gevorqyan V., Ananyan M., Trchounian A. Antibacterial effects of iron oxide (Fe3O4) nanoparticles: Distinguishing concentration-dependent effects with different bacterial cells growth and membrane-associated mechanisms. Appl. Microbiol. Biotechnol. 2019;103:2773–2782. doi: 10.1007/s00253-019-09653-x. - DOI - PubMed

LinkOut - more resources