. 2021 Mar 8;11(3):188.
doi: 10.3390/jpm11030188.

Telomere Length Dynamics and Chromosomal Instability for Predicting Individual Radiosensitivity and Risk via Machine Learning

Affiliations

Telomere Length Dynamics and Chromosomal Instability for Predicting Individual Radiosensitivity and Risk via Machine Learning

Jared J Luxton et al. J Pers Med. .

Abstract

The ability to predict a cancer patient's response to radiotherapy and risk of developing adverse late health effects would greatly improve personalized treatment regimens and individual outcomes. Telomeres represent a compelling biomarker of individual radiosensitivity and risk, as exposure can result in dysfunctional telomere pathologies that coincidentally overlap with many radiation-induced late effects, ranging from degenerative conditions like fibrosis and cardiovascular disease to proliferative pathologies like cancer. Here, telomere length was longitudinally assessed in a cohort of fifteen prostate cancer patients undergoing Intensity Modulated Radiation Therapy (IMRT) utilizing Telomere Fluorescence in situ Hybridization (Telo-FISH). To evaluate genome instability and enhance predictions for individual patient risk of secondary malignancy, chromosome aberrations were assessed utilizing directional Genomic Hybridization (dGH) for high-resolution inversion detection. We present the first implementation of individual telomere length data in a machine learning model, XGBoost, trained on pre-radiotherapy (baseline) and in vitro exposed (4 Gy γ-rays) telomere length measurements, to predict post radiotherapy telomeric outcomes, which together with chromosomal instability provide insight into individual radiosensitivity and risk for radiation-induced late effects.

Keywords: IMRT; chromosomal instability; individual radiosensitivity; inversions; late effects; machine learning; personalized medicine; prostate cancer; telomeres.


Conflict of interest statement

S.M.B. is a cofounder and scientific advisory board member of KromaTiD, Inc.

Figures

Figure 1
Figure 1
Telomere length dynamics (Telo-FISH). Mean telomere length expressed as relative fluorescence intensity. (A) Time-course of blood sample collection for all prostate cancer patients (n = 15; 50 cells/patient/time point scored): 1 non irrad = pre-IMRT non-irradiated (0 Gy); 2 irrad @ 4 Gy: pre-IMRT in vitro irradiated; 3B: immediate post-IMRT; and 4C: 3-months post-IMRT. Boxes denote quantiles, horizontal grey lines denote medians. Telomere length values were standardized using BJ1/BJ-hTERT controls. (B) Hierarchical clustering of patients by longitudinal changes in mean telomere length (z-score normalized). (C) Time-course for clustered groups of patients (n = 3, purple; n = 11, blue); center lines denote medians, lighter bands denote confidence intervals. Patient ID 13 not clustered (sample failed to culture). Significance was assessed using a repeated measures ANOVA and post hoc Tukey’s HSD test.
Figure 2
Figure 2
Telomere length distributions (Telo-FISH). Individual telomere length distributions of prostate cancer patients (n = 15): 1 non irrad = pre-IMRT non-irradiated (0 Gy); 2 irrad @ 4 Gy = pre-IMRT in vitro irradiated; 3B = immediate post-IMRT; and 4C = 3-months post-IMRT. RFI: Relative Fluorescence Intensity. Individual telomeres from the pre-therapy non-irradiated time point were split into quartiles, designating telomeres in the bottom 25% (yellow), middle 50% (blue), and top 25% (red). Quartile cut-off values, established by the distribution of the pre-therapy non-irradiated time point, were applied to subsequent time points to feature engineer the relative shortest, mid-length, and longest individual telomeres per time point. (A) Individual telomere length distributions for all patients (averaged) per time point. (B) Individual telomere length distributions for patients in mean telomere length clustered group 1 (n = 3) and (C) group 2 (n = 11).
Figure 3
Figure 3
Longitudinal shifts in numbers of short and long telomeres (Telo-FISH). Numbers of short and long telomeres from individual telomere length distributions: 1 non irrad = pre-IMRT non-irradiated (0 Gy); 2 irrad @ 4 Gy = pre-IMRT in vitro irradiated; 3B = immediate post-IMRT; and 4C = 3-months post-IMRT. Shortest (yellow), mid-length (blue), and longest (red) telomeres were feature engineered per patient (n = 15). (A) Counts of short, medium, and long telomeres; 4600 individual telomeres per patient per time point. Significance was assessed using a square-root transformation and a repeated measures ANOVA with post hoc Tukey’s HSD test. Hierarchical clustering of patients by longitudinal changes in numbers of short (B) and long telomeres (D) (z-score normalized). Time-courses of patient groups (n = 3, purple; n = 11, blue) clustered by numbers of short (C) and long (E) telomeres; center lines denote medians and lighter bands denote confidence intervals. Patient ID 13 not clustered (sample failed to culture).
Figure 4
Figure 4
Linear regression models failed to predict post-IMRT telomeric outcomes. Ordinary least squares linear regression models were employed using pre-IMRT telomeric data (Telo-FISH) from the pre-IMRT non-irradiated (0 Gy) or the pre-IMRT in vitro irradiated (4 Gy) samples to predict 3-month post-IMRT telomeric outcomes. Models were made using (A) mean telomere length (R2 = 0.161, 0.165), (B) numbers of short (R2 = 0.433, 0.554), and (C) numbers of long (R2 = 0.046, 0.208) telomeres.
Figure 5
Figure 5
Processing of Telo-FISH data for training and testing XGBoost models. Schematic for machine learning pipeline used for individual telomere length data (Telo-FISH). Preprocessed data: Feature 1: pre-IMRT individual telomere length measurements (n = 128,800); Feature 2: pre-IMRT sample labels (non-irradiated, in vitro irradiated, encoded as 0/1); Target: 3 months post-IMRT telomeric outcomes (mean telomere length or numbers of short and long telomeres). Data is randomly shuffled and stratified (by patient ID and pre-therapy sample origin) and split into training (80%) and test (20%) datasets; patient IDs are stripped after splitting. Five-fold cross validation was used, and models were evaluated with Mean Absolute Error (MAE) and R2 scores between predicted and true values in the test set.
Figure 6
Figure 6
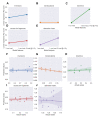
High performance of XGBoost models for predicting post-IMRT telomeric outcomes. Three separate XGBoost models were trained on pre-IMRT individual telomere length measurements (n = 103,040, Telo-FISH) to predict 3-month post-IMRT telomeric outcomes. Trained XGBoost models were challenged with the test set (new data, n = 25,760 individual telomeres) to predict 3-month post-IMRT telomeric outcomes for (A) mean telomere length, (B) numbers of short, and (C) numbers of long telomeres. XGBoost predictions were averaged on a per patient basis for (D) mean telomere length, (E) numbers of short, and (F) numbers of long telomeres; blue line represents a simple regression line (X/Y), lighter bands the 95% confidence interval, R2 values (coefficient of determination) are noted in bold.
Figure 7
Figure 7
Strong generalizability of XGBoost models to new patient data (leave one out approach). (AN) Fourteen separate XGBoost models were iteratively trained on pre-IMRT individual telomere length measurements (n = 93,840, Telo-FISH) excluding one patient, and tested to predict 3-month post-IMRT mean telomere length, with inclusion of the patient excluded during training. Each panel is one model; patients excluded during training for that model are noted in the panel headers and plotted in black. Lines represent a simple regression line (X/Y), lighter bands the 95% confidence interval, R2 values (coefficient of determination) are noted in bold.
Figure 8
Figure 8
Longitudinal analyses of chromosomal instability. Whole blood was collected from prostate cancer patients undergoing IMRT (n = 15) and chromosome aberrations assessed using directional Genomic Hybridization (dGH) on metaphase spreads (n = 30/patient/timepoint scored): 1 non irrad = pre-IMRT non-irradiated (0 Gy); 2 irrad @ 4 Gy = pre-IMRT in vitro irradiated; 3B = immediate post-IMRT; and 4C = 3-month post-IMRT. Frequencies of (A) inversions, (B) translocations, (C) dicentrics, (D) excess chromosome fragments (deletions), and (E) sister chromatid exchanges (SCE). Significance was assessed for average aberration frequencies using a repeated measures ANOVA and post hoc Tukey’s HSD test. p < 0.05 *, p < 0.01 **, p < 0.001 ***.
Figure 9
Figure 9
Clustering of patients by chromosome aberration frequencies. Time-courses for groups of patients hierarchically clustered into discrete groups (blue, purple) per aberration type: 1 non irrad = pre-IMRT non-irradiated (0 Gy); 2 irrad @ 4 Gy = pre-IMRT in vitro irradiated; 3B = immediate post-IMRT; and 4C = 3-month post-IMRT. Clustered groups of patients for frequencies of (A) inversions, (B) translocations, (C) dicentrics, (D) excess chromosome fragments (deletions), and (E) aberration index, which was created by summing all aberration types. Center lines denote medians and lighter bands denote confidence intervals.
Figure 10
Figure 10
Neither linear regression nor XGBoost models successfully predicted post-IMRT chromosome aberration (CA) frequencies. Ordinary least squares linear regression models were made using pre-IMRT average CA frequencies from the non-irradiated (0 Gy) or in vitro irradiated (4 Gy) samples to predict 3-month post-IMRT average CA frequencies. Models were made for (A) inversions, (B) translocations, (C) dicentrics, (D) excess chromosome fragments (deletions), and (E) aberration index, which was created by summing all CA per cell. The model for dicentrics performed best, with an R2 = 0.514. XGBoost models were trained on pre-IMRT counts of different CA types per cell (n = 672) to predict 3-month post-IMRT average CA frequencies. Trained XGBoost models were challenged with the test set (new data, n = 168 cells) to predict 3-month post-IMRT average CA frequencies. XGBoost predictions were averaged on a per patient basis for (F) inversions, (G) translocations, (H) dicentrics, (I) excess chromosome fragments (deletions), and (J) aberration index. For all models, R2 values between averaged predictions and actual values did not exceed 0.100.

Similar articles

Cited by

References

    1. Barnett G.C., West C.M.L., Dunning A.M., Elliott R.M., Coles C.E., Pharoah P.D.P., Burnet N.G. Normal Tissue Reactions to Radiotherapy. Nat. Rev. Cancer. 2009;9:134–142. doi: 10.1038/nrc2587. - DOI - PMC - PubMed
    1. Bentzen S.M. Preventing or Reducing Late Side Effects of Radiation Therapy: Radiobiology Meets Molecular Pathology. Nat. Rev. Cancer. 2006;6:702–713. doi: 10.1038/nrc1950. - DOI - PubMed
    1. Yusuf S.W., Venkatesulu B.P., Mahadevan L.S., Krishnan S. Radiation-Induced Cardiovascular Disease: A Clinical Perspective. Front. Cardiovasc. Med. 2017;4 doi: 10.3389/fcvm.2017.00066. - DOI - PMC - PubMed
    1. Carver J.R., Shapiro C.L., Ng A., Jacobs L., Schwartz C., Virgo K.S., Hagerty K.L., Somerfield M.R., Vaughn D.J., ASCO Cancer Survivorship Expert Panel American Society of Clinical Oncology Clinical Evidence Review on the Ongoing Care of Adult Cancer Survivors: Cardiac and Pulmonary Late Effects. J. Clin. Oncol. 2007;25:3991–4008. doi: 10.1200/JCO.2007.10.9777. - DOI - PubMed
    1. Greene-Schloesser D., Robbins M.E. Radiation-Induced Cognitive Impairment-from Bench to Bedside. Neuro Oncol. 2012;14:iv37–iv44. doi: 10.1093/neuonc/nos196. - DOI - PMC - PubMed