. 2021 Mar 8;14(5):1301.
doi: 10.3390/ma14051301.

The Effect of Surface Treatment on Structural Properties of CVD Diamond Layers with Different Grain Sizes Studied by Raman Spectroscopy

Affiliations

The Effect of Surface Treatment on Structural Properties of CVD Diamond Layers with Different Grain Sizes Studied by Raman Spectroscopy

Anna Dychalska et al. Materials (Basel). .

Abstract

Extensive Raman spectroscopy studies combined with scanning electron microscopy (SEM) and X-ray photoelectron spectroscopy (XPS) measurements were performed to investigate structural and chemical changes in diamond layers deposited by chemical vapour deposition (CVD) upon post-growth treatment with hydrogen. The aim of this study is to characterize the changes in micro-structural properties of diamond layers with different grain sizes and different contents of sp2 carbon phase. Hydrogenation or oxidization of diamond layer surface is often performed to modify its properties; however, it can also strongly affect the surface structure. In this study, the impact of hydrogenation on the structure of diamond layer surface and its chemical composition is investigated. Owing to their polycrystalline nature, the structural properties of CVD diamond layers can strongly differ within the same layer. Therefore, in this project, in order to compare the results before and after hydrogen treatment, the diamond layers are subjected to Raman spectroscopy studies in the vicinity of a T-shape marker fabricated on the surface of each diamond layer studied.

Keywords: CA; Raman spectroscopy; SEM; XPS; diamond CVD; hydrogen treatment.


Conflict of interest statement

The authors declare no conflict of interest.

Figures
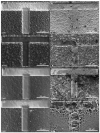
Figure 1
Figure 1
SEM micrographs of diamond layer surface before (left panel) and after hydrogen treatment (right panel) for samples (ab) MCD2, (cd) MCD2.5, (ef) NCD0.2, (gh) NCD0.02.
Figure 2
Figure 2
The position of linear Raman map (ah) in the marker, and (ip) outside the marker. The as-deposited diamond layers are shown on the left side of the figure, while the layers after hydrogen treatment are given on the right side. The line length is 20 µm, short vertical lines indicate the points at which the Raman spectra were taken.
Figure 3
Figure 3
Raman spectra of diamond layers (a) MCD2, (b) MCD2.5, (c) NCD0.2, (d) NCD0.02. Black and green line—before hydrogen treatment, red and blue line—after hydrogen treatment.
Figure 4
Figure 4
The first order Raman spectra of diamond layers with indication of diamond, D, G, t-Pa band positions: (a) MCD2, (b) MCD2.5, (c) NCD0.2, (d) NCD0.02. Black and green lines- before hydrogen treatment, red and blue line—after hydrogen treatment.
Figure 5
Figure 5
Changes in (a) quality factor Q(A) and (b) m/IG parameter, upon hydrogen treatment of the diamond layer. Green and blue stacks—average values for measurements taken outside the marker, before and after hydrogenation, respectively. Black and red stacks—average values for measurements taken in the marker, before and after hydrogenation, respectively. The insert plot in (a) presents the dependence of Q(A) on grain size of diamond layers and in (b) the dependence of m/IG on hydrogen concentration in the processing gases. Green or red numbers in plots (a) and (b) indicate an increase or decrease in Q(A) and m/IG values after hydrogenation.
Figure 6
Figure 6
The dependence of (ab) G FWHM and (cd) ID/IG ratio on the G band position for all measurements points. Data collected before hydrogen treatment (a) and (c) are shown in the left panel, while those collected after hydrogen treatment (b) and (d)—in the right panel. The filled symbols represent the results obtained outside the marker, empty symbols—those obtained inside the marker.
Figure 7
Figure 7
The relation between the diamond band position and its FWHM for all measurements points, (a) before hydrogen treatment, (b) after hydrogen treatment. Filled symbols represent results of measurements taken outside the marker, empty points—inside the marker.
Figure 8
Figure 8
The percentages of (a) t-Pa and (b) t-Pa1 (at 1150 cm−1) bands in the Raman spectra. Green and blue stacks—average values for measurements taken outside the marker, before and after hydrogenation, respectively. Black and red stacks – average values for measurements taken within the marker, before and after hydrogenation, respectively. Green or red numbers in plots (a) and (b) indicate an increase or decrease in t-Pa or t-Pa1 contribution in Raman spectra after hydrogenation.
Figure 9
Figure 9
C1s peaks from XPS spectra of diamond layers before and after treatment exposure to hydrogen (black and red line, respectively) (a) MCD2, (b) MCD2.5, (c) NCD0.2, (d) NCD0.02.
Figure 10
Figure 10
Exemplary C1s XPS spectra deconvolution for diamond layers NCD0.02, before hydrogenation.
Figure 11
Figure 11
The relative contribution of C–C sp2, C–C sp3 CHx, C–O–C, -C=O and C–O–O components as derived from the peak fitting procedure for diamond layers MCD2, MCD2.5, NCD0.2, NCD0.02 before and after hydrogen treatment.
Figure 12
Figure 12
The dependence of CA on chemical composition, before (black squares), and after hydrogenation (red circles). CA versus (a) the sum of peaks from oxidised carbon, (b) content of CHx bonds and (c) ratio of CHx bond content to the sum of oxidized carbon species.

References

    1. Pei X., Cheng S., Ma Y., Wu D., Liu J., Wang Q., Yang Y., Li H. Structure and wettability property of the growth and nucleation surfaces of thermally treated freestanding CVD diamond films. Appl. Surf. Sci. 2015;346:189–193. doi: 10.1016/j.apsusc.2015.03.172. - DOI
    1. Kaibara Y., Sugata K., Tachiki M., Umezawa H., Kawarada H. Control wettability of the hydrogen-terminated diamond surface and the oxidized diamond surface using an atomic force microscope. Diam. Relat. Mater. 2003;12:560–564. doi: 10.1016/S0925-9635(02)00373-4. - DOI
    1. Landstrass M.I., Ravi K.V. Resistivity of chemical vapor deposited diamond films. Appl. Phys. Lett. 1989;55:975–977. doi: 10.1063/1.101694. - DOI
    1. Sato H., Kasu M. Electronic properties of H-terminated diamond during NO2 and O3 adsorption and desorption. Diam. Relat. Mater. 2012;24:99–103. doi: 10.1016/j.diamond.2011.12.004. - DOI
    1. Kubovic M., Kasu M., Kageshima H., Maeda F. Electronic and surface properties of H-terminated diamond surface affected by NO2 gas. Diam. Relat. Mater. 2010;19:889–893. doi: 10.1016/j.diamond.2010.02.021. - DOI

LinkOut - more resources