. 2021 Mar 28;22(7):3505.
doi: 10.3390/ijms22073505.

Systemic Administration of G-CSF Accelerates Bone Regeneration and Modulates Mobilization of Progenitor Cells in a Rat Model of Distraction Osteogenesis

Affiliations

Systemic Administration of G-CSF Accelerates Bone Regeneration and Modulates Mobilization of Progenitor Cells in a Rat Model of Distraction Osteogenesis

Flavy Roseren et al. Int J Mol Sci. .

Abstract

Granulocyte colony-stimulating factor (G-CSF) was shown to promote bone regeneration and mobilization of vascular and osteogenic progenitor cells. In this study, we investigated the effects of a systemic low dose of G-CSF on both bone consolidation and mobilization of hematopoietic stem/progenitor cells (HSPCs), endothelial progenitor cells (EPCs) and mesenchymal stromal cells (MSCs) in a rat model of distraction osteogenesis (DO). Neovascularization and mineralization were longitudinally monitored using positron emission tomography and planar scintigraphy. Histological analysis was performed and the number of circulating HSPCs, EPCs and MSCs was studied by flow cytometry. Contrary to control group, in the early phase of consolidation, a bony bridge with lower osteoclast activity and a trend of an increase in osteoblast activity were observed in the distracted callus in the G-CSF group, whereas, at the late phase of consolidation, a significantly lower neovascularization was observed. While no difference was observed in the number of circulating EPCs between control and G-CSF groups, the number of MSCs was significantly lower at the end of the latency phase and that of HSPCs was significantly higher 4 days after the bone lengthening. Our results indicate that G-CSF accelerates bone regeneration and modulates mobilization of progenitor cells during DO.

Keywords: G-CSF; bone formation; endothelial progenitor cells; hematopoietic stem/progenitor cells; mesenchymal stromal cells; neovascularization.


Conflict of interest statement

The authors declare no conflict of interest. The funders had no role in the design of the study; in the collection, analyses, or interpretation of data; in the writing of the manuscript, or in the decision to publish the results.

Figures

Figure 1
Figure 1
Mobilization of hematopoietic stem/progenitor cells (HSPCs) (A,B), endothelial progenitor cells (EPCs) (C) and mesenchymal stromal cells (MSCs) (DF) during the three phases of distraction osteogenesis. (A) A significant peak of HSPC concentration at D11 for the granulocyte colony-stimulating factor (G-CSF) group compared to the control group. (B) Representation of intragroup mobilization patterns of HSPCs. (C) For EPC count, only an effect of time is observed, with a significant peak at D17. (D) A statistical difference in the mobilization pattern of total MSCs at an early time point (D7). (E) Intragroup kinetic pattern for MSC population. A marked augmentation of MSCs in the blood stream at 31 days post-surgery is effective for both groups. (F) For MSC-271+ cells, a statistical time effect is seen for later times (D24 and D31) compared to early time points. formula image 
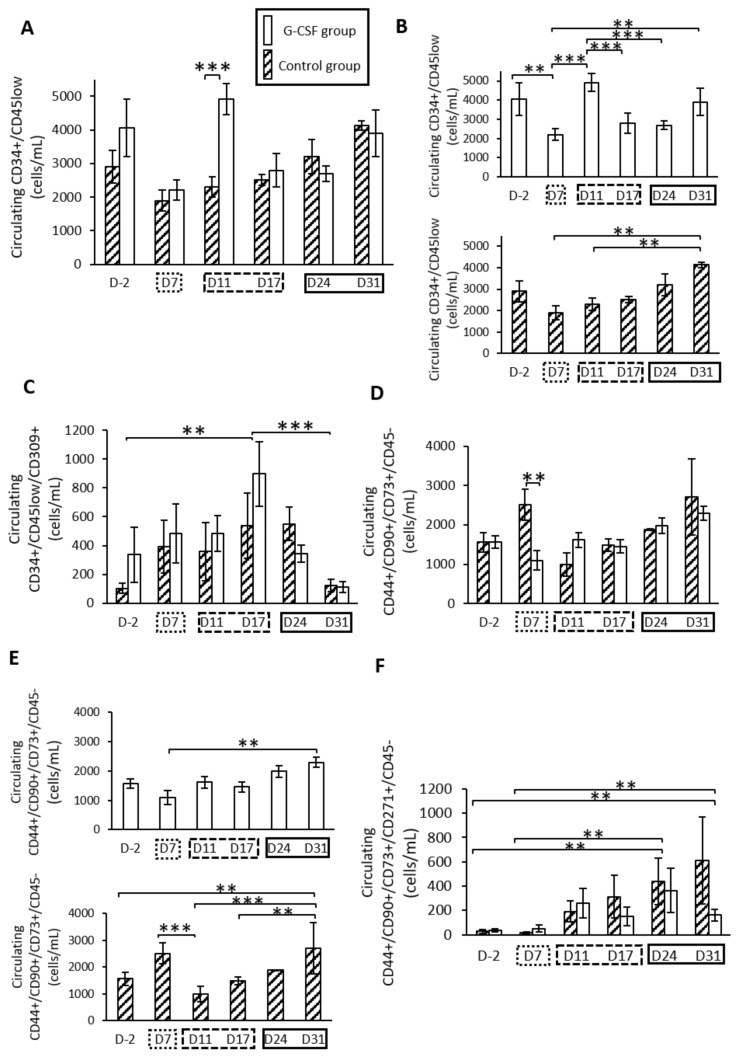
represents the latency period, the distraction phase is represented by formula image, and formula image represents the consolidation phase. ** p < 0.05, *** p < 0.01. Cytometry assays were performed on 6 G-CSF animals and 4 control animals.
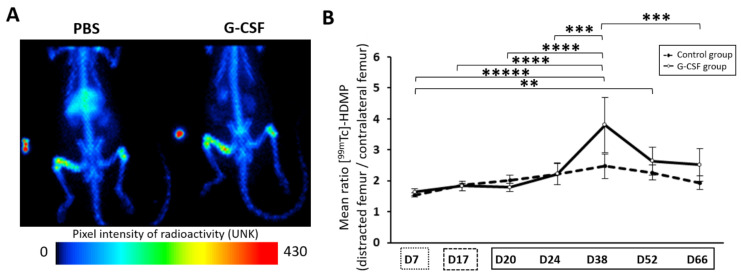
Figure 2
Figure 2
Assessment of bone metabolism throughout the protocol of distraction. (A) Representation of planar scintigraphy imaging at 38 days post-surgery. Maximum radioactivity values are indicated in red to orange, medium values in yellow to green and lowest values in blue to black (UNK unity). (B) The temporal pattern of the mean ratio uptake is presented and demonstrates osteoblast activity. The solid line corresponds to the injected group while the dashed line is for the control group. At D38, a time effect is apparent and differs from all time points except for D52. formula image represents the latency period, formula image represents the distraction phase and the consolidation phase is represented by formula image. Planar scintigraphy was performed on 6 control animals and 4 G-CSF animals. ** p < 0.05, *** p < 0.01, **** p < 0.001, ***** p < 0.0001.
Figure 3
Figure 3
Course of vascularization metabolism during distraction osteogenesis (DO). (A) Representative positron emission tomography (PET) imaging 7, 17, 20, 24, 38, 52 and 66 days after surgery. (B) The temporal pattern of the mean uptake ratio of [68Ga]-RGD is presented and demonstrates vascular metabolism inside the new regenerate. The dotted line represents the control group and the filled line represents the G-CSF group. (C) In the G-CSF group, the mean ratio peaks at D20 compared to D7 (p = 0.007) and drops significantly at the end (p = 0.0001). (D) In the control group, a peak at D20 is also shown compared to D7 (p = 0.003) but only there is only a drop at D24 compared to D20 (p = 0.05). A PET study was performed on 6 control animals and 4 G-CSF animals. a, b, c: if two means share the same letter, no statistical differences were found. formula image 
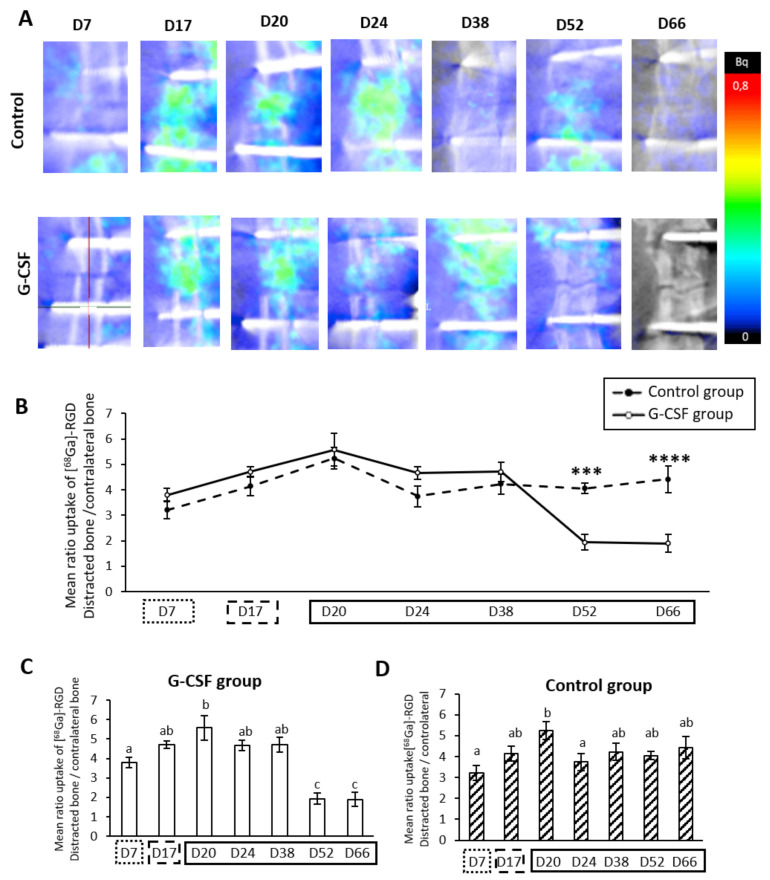
represent the latency period, the distraction phase is represented by formula image, and formula image the consolidation phase. *** p < 0.01, **** p < 0.001.
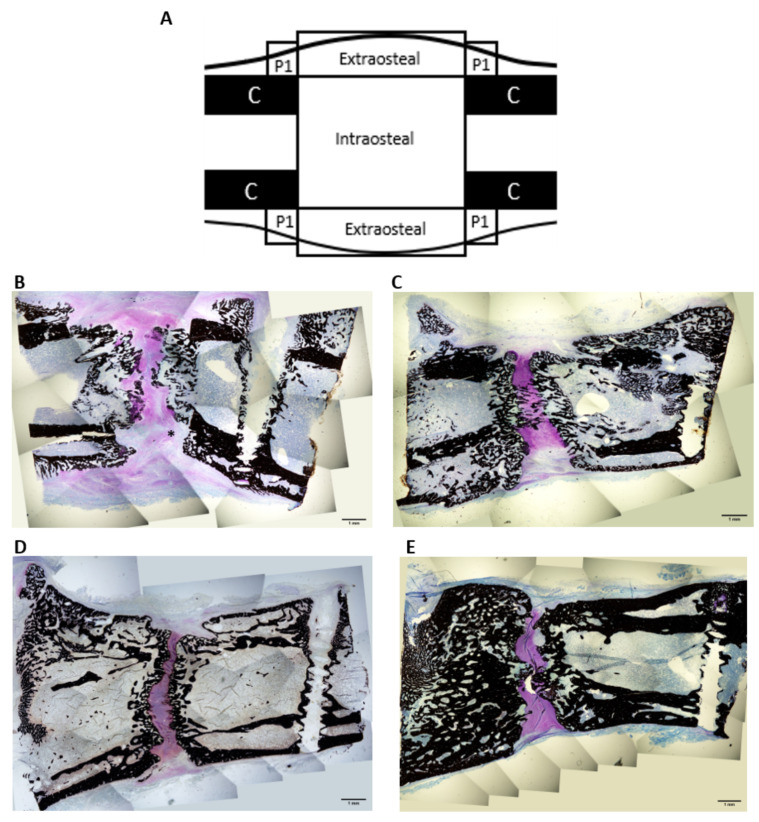
Figure 4
Figure 4
Histological images of the distracted callus at low magnification (×4) 31 days post-surgery (B,C) and 66 days post-surgery (D,E) in control group (B,D) and G-CSF group (C,E). (A) Region of interest (ROI) diagrams for histomorphometry analyses. (B) In the intraosteal region, fibrous tissue is still present. Note that the trabecular network visible is thinner and less connected than in the G-CSF group. In the central zone, the mineralized tissue is mostly composed of calcified cartilage rather than osseous tissue. (C) A bony bridge is apparent inside the intraosteal region. An intense cartilaginous zone is seen in between the two fronts of mineralization. The trabecular network is more developed and thicker. (D) The gap between the two osteotomized femur extremities is filled with cartilaginous tissue. No bridging is observed. In the periosteal zone, the double cortices are separated by a large medullary space. (E) The two bony ends of the femur are connected by a bony bridge in the center of the gap. In the periosteal zone, the bone marrow fills a small space, the cortices are thick and sometimes merged. Histological analysis was performed on 4 control animals and 4 G-CSF animals at each time. * = fibrous tissue.
Figure 5
Figure 5
TRAP images of the distracted callus at low magnification (×10) 31 days (A,B) and 66 days (C,D) post-surgery in control (AC) and G-CSF groups (BD). At D31, in the control group, osteoclastic activity (arrow) is very high in the newly formed trabeculae (*) behind the mineralization front (dotted line) in the intraosteal area. In this area, in G-CSF animals, osteoclastic activity is restricted to the mineralization front (arrow). At D66, while osteoclastic activity is still significant in the extraosteal zone (arrow), this activity is minimal in this area in G-CSF animals (arrow). TRAP analysis was performed on 2 animals in each group at D31 and D66. C, cortical shaft; G, gap; BM, bone marrow.

Similar articles

Cited by

References

    1. Compton J., Fragomen A., Rozbruch S.R. Skeletal Repair in Distraction Osteogenesis: Mechanisms and Enhancements. JBJS Rev. 2015;3:1. doi: 10.2106/JBJS.RVW.N.00107. - DOI - PubMed
    1. Singh M., Vashistha A., Chaudhary M., Kaur G. Biological Basis of Distraction Osteogenesis—A Review. J. Oral Maxillofac. Surg. Med. and Pathol. 2016;28 doi: 10.1016/j.ajoms.2015.05.006. - DOI
    1. Launay F., Younsi R., Pithioux M., Chabrand P., Bollini G., Jouve J.-L. Fracture Following Lower Limb Lengthening in Children: A Series of 58 Patients. Orthop. Traumatol. Surg. Res. 2013;99:72–79. doi: 10.1016/j.otsr.2012.08.005. - DOI - PubMed
    1. Lascombes P., Popkov D., Huber H., Haumont T., Journeau P. Classification of Complications after Progressive Long Bone Lengthening: Proposal for a New Classification. Orthop. Traumatol. Surg. Res. 2012;98:629–637. doi: 10.1016/j.otsr.2012.05.010. - DOI - PubMed
    1. Marsh D.R., Shah S., Elliott J., Kurdy N. The Ilizarov Method in Nonunion, Malunion and Infection of Fractures. J. Bone Joint Surg. Br. 1997;79:273–279. doi: 10.1302/0301-620X.79B2.0790273. - DOI - PubMed

MeSH terms

Substances

LinkOut - more resources