Review
. 2021 Mar 6;22(5):2657.
doi: 10.3390/ijms22052657.

Label-Free Multiphoton Microscopy: Much More Than Fancy Images

Affiliations
Review

Label-Free Multiphoton Microscopy: Much More Than Fancy Images

Giulia Borile et al. Int J Mol Sci. .

Abstract

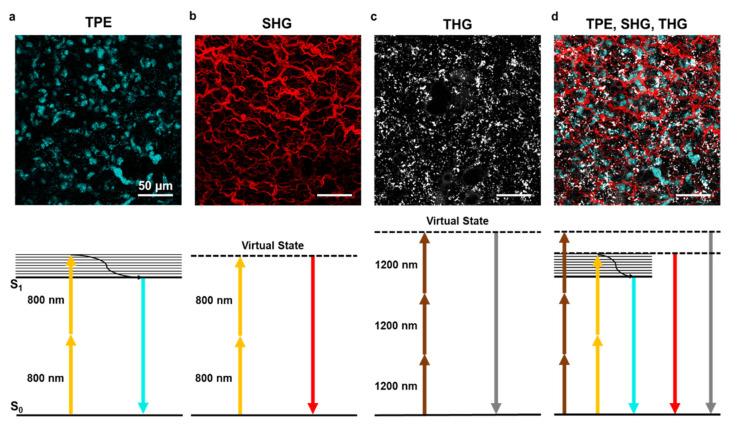
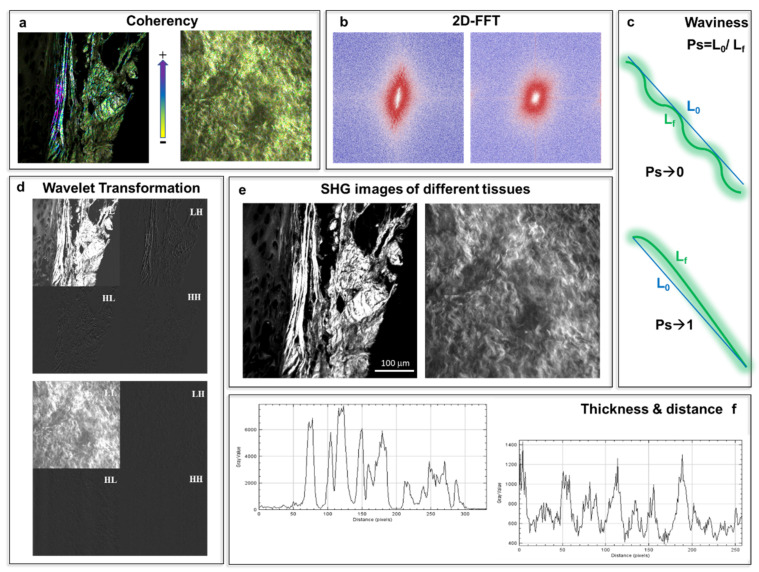
Multiphoton microscopy has recently passed the milestone of its first 30 years of activity in biomedical research. The growing interest around this approach has led to a variety of applications from basic research to clinical practice. Moreover, this technique offers the advantage of label-free multiphoton imaging to analyze samples without staining processes and the need for a dedicated system. Here, we review the state of the art of label-free techniques; then, we focus on two-photon autofluorescence as well as second and third harmonic generation, describing physical and technical characteristics. We summarize some successful applications to a plethora of biomedical research fields and samples, underlying the versatility of this technique. A paragraph is dedicated to an overview of sample preparation, which is a crucial step in every microscopy experiment. Afterwards, we provide a detailed review analysis of the main quantitative methods to extract important information and parameters from acquired images using second harmonic generation. Lastly, we discuss advantages, limitations, and future perspectives in label-free multiphoton microscopy.

Keywords: label-free; multiphoton microscopy; quantitative imaging; second harmonic generation; third harmonic generation.


Conflict of interest statement

The authors declare no conflict of interest.

Figures

Figure 1
Figure 1
Comparison of key parameters of different imaging techniques. Each microscopy technique has strengths and weaknesses that are important to consider before choosing the adequate microscopy approach. We limited the radar plot to five parameters (Resolution, Sample preparation ease, Depth penetration, Molecular species variety, and Sample integrity), although experimental needs may require considering other aspects (i.e., acquisition speed). The relative performance of confocal microscopy (in blue), multiphoton (in red), and label-free multiphoton (in green) are compared with the outer position indicating the best performance for that parameter. The same set-up can be optimized for specific approaches (multiphoton fluorescence vs. label-free multiphoton).
Figure 2
Figure 2
Two-photon excitation, second and third harmonic generation. (a) Example of two-photon excitation (TPE) of DAPI stained nuclei in lung tissue. Bottom panel shows the corresponding Jablonski diagram using 800 nm excitation wavelength. (b) Second harmonic generation (SHG) signal elicited with 800 nm wavelength on lung tissue collagen structure. The bottom panel shows the corresponding Jablonski diagram using 800 nm excitation wavelength. (c) Third harmonic generation (THG) signal of lipid bodies in lung tissue using 1200 nm wavelength. The bottom panel shows the corresponding Jablonski diagram. (d) A combination of TPE, SHG, and THG can be obtained using two laser sources at different wavelengths. Images obtained with the 800 nm source are merged with THG obtained with the 1200 nm source. The scale bar is 50 µm for all images.
Figure 3
Figure 3
Radar plots for first-order statistics (FOS) and second-order statistics (gray level co-occurrence matrix, GLCM). Comparison of the statistical parameters between four categories of typical fibers arrangements: curly and thin (red), high density and uniform (green), random distribution or disoriented and dense (blue), and straight, thick, and uniform (magenta). (a) FOS provides the calculation of five statistical parameters: mean, kurtosis, skewness, integrated density, and standard deviation. Straight and thick fibers (magenta) are associated typically to higher values of mean, integrated density, and standard deviation. Differently, curly and thin fibers (red) are represented with higher kurtosis and skewness parameters, any intermediate situation can be shown by median values of the five FOS parameters (green and blue) [71]. (b) The second-order statistics (GLCM texture) is based on inter-pixel analysis, and the specific parameters are inverse difference moment (IDM), energy, inertia, entropy, and correlation. Correlation and IDM parameters do not show any significant trend according to the specific features of the tissue analyzed. On the other hand, energy shows higher values for curly and thin fibers (red), inertia and entropy are predominant for straight, thick, and uniform texture (magenta), intermediate values are represented by high density and random distribution (green and blue) [71].
Figure 4
Figure 4
Analysis of SHG images of native and decellularized tissue (e) using ImageJ software. (a) Coherency analysis showing different values between 0 and 1 with 1 indicating a highly orientated structure. (b) Two-dimensional Fast Fourier Transformation (2D-FFT) images indicating a textural feature of the tissue show fibers with the same alignment. (c) The straightness parameter Ps quantifies the waviness of fibers and is bounded between 0 and 1. A bundle with Ps = 1 indicates a straight fiber; in contrast, Ps converges to zero when the fibers get very wavy. (d) Wavelet transform analysis applies a decomposition of the images (e), into four sub-images: low–low (LL), low–high (LH), high–low (HL), and high–high (HH) frequencies. LH, HL, and HH are three high-frequency sub-images that are horizontal, vertical, and oblique, respectively. LL is the low frequency sub-image that contains the main information of the decomposed image. (f) Plots profile generation, distances between the peaks can be associated with the distance between the fibers, and similarly, the widths of the peaks may give the thickness of them.

Similar articles

Cited by

References

    1. Zipfel W.R., Williams R.M., Webb W.W. Nonlinear magic: Multiphoton microscopy in the biosciences. Nat. Biotechnol. 2003;21:1369–1377. doi: 10.1038/nbt899. - DOI - PubMed
    1. Lefort C. A review of biomedical multiphoton microscopy and its laser sources. J. Phys. D Appl. Phys. 2017;50 doi: 10.1088/1361-6463/aa8050. - DOI
    1. Huff J. The Airyscan detector from ZEISS: Confocal imaging with improved signal-to-noise ratio and super-resolution. Nat. Methods. 2015 doi: 10.1038/nmeth.f.388. - DOI
    1. Carriles R., Sheetz K.E., Hoover E.E., Squier J.A., Barzda V. Simultaneous multifocal, multiphoton, photon counting microscopy. Opt. Express. 2008;16:10364. doi: 10.1364/OE.16.010364. - DOI - PubMed
    1. Moneron G., Hell S.W. Two-photon excitation STED microscopy. Opt. Express. 2009 doi: 10.1364/OE.17.014567. - DOI - PubMed

LinkOut - more resources