. 2021 Mar 6;22(5):2660.
doi: 10.3390/ijms22052660.

Spectroscopic Signature of Red Blood Cells in a D-Galactose-Induced Accelerated Aging Model

Affiliations

Spectroscopic Signature of Red Blood Cells in a D-Galactose-Induced Accelerated Aging Model

Aneta Blat et al. Int J Mol Sci. .

Abstract

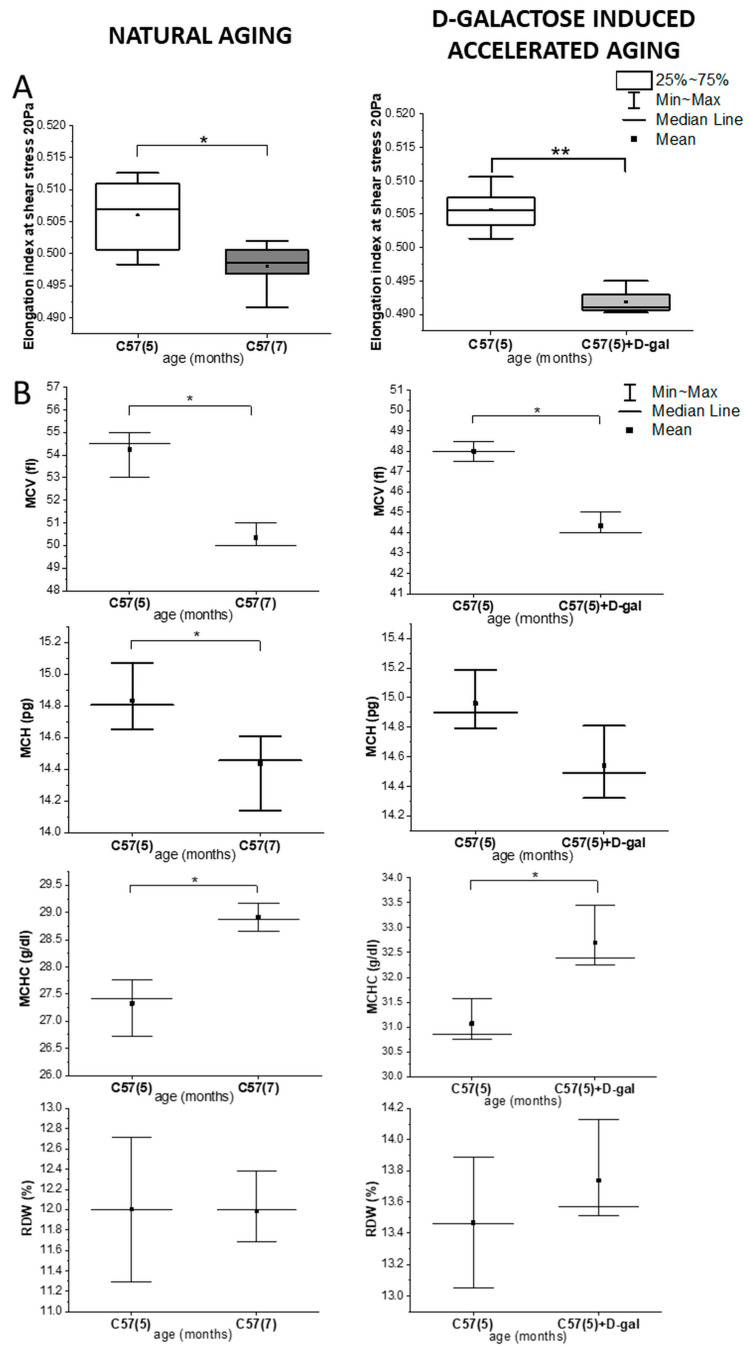
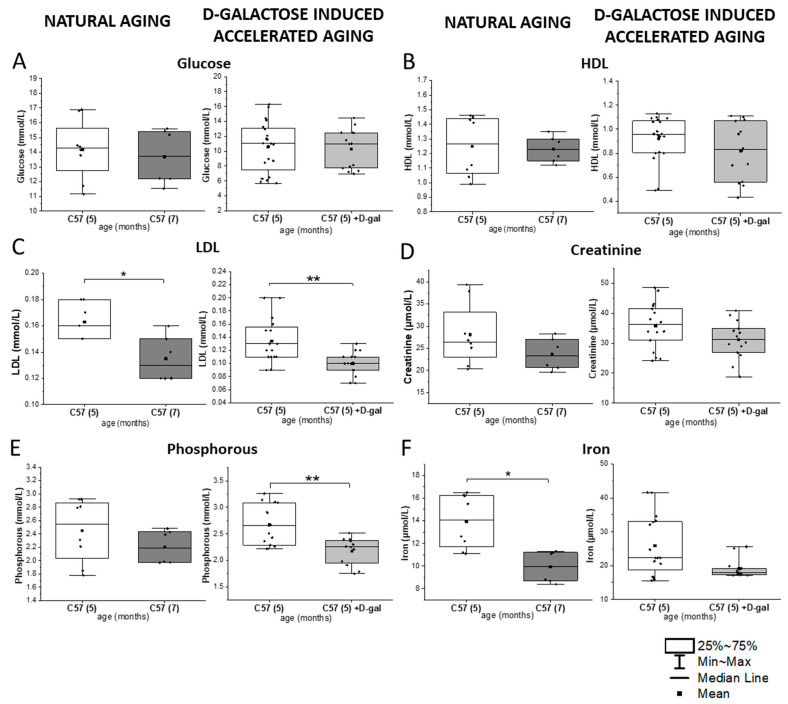
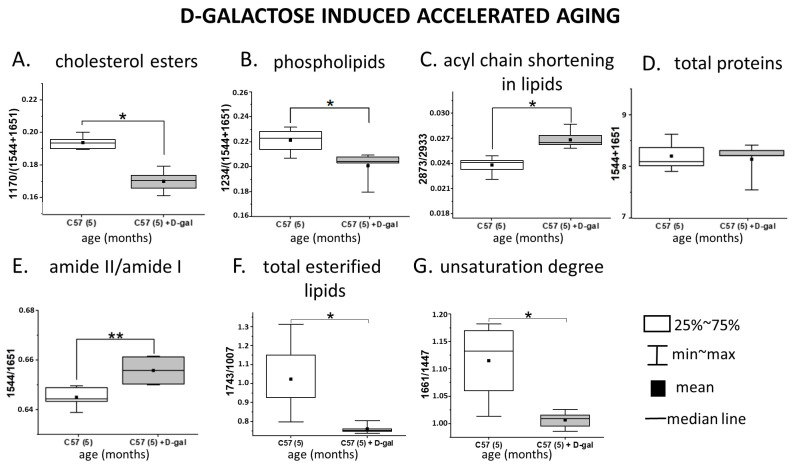
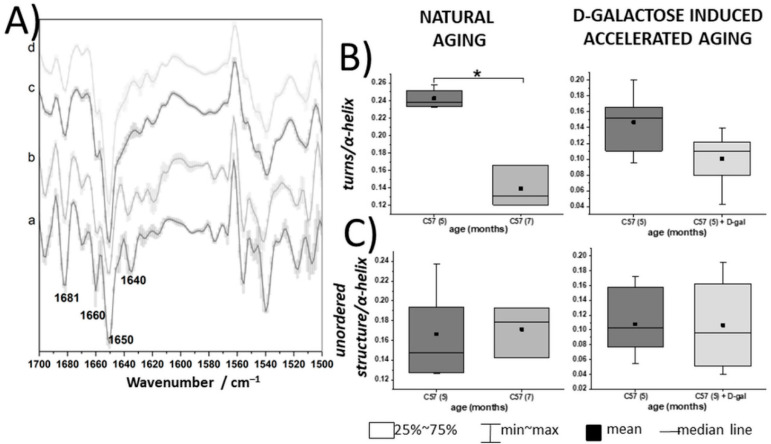
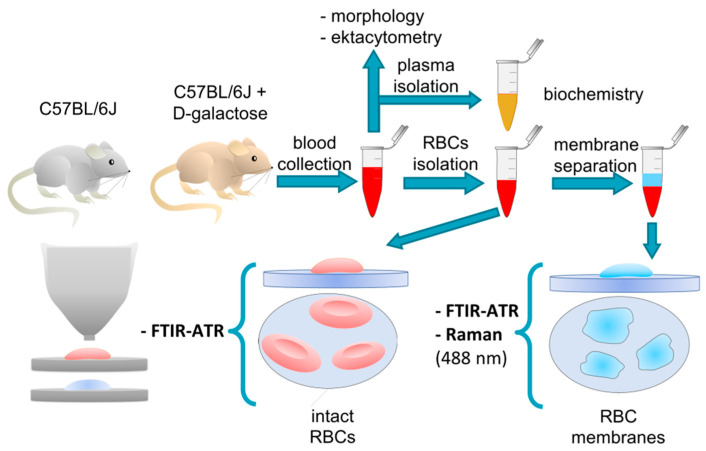
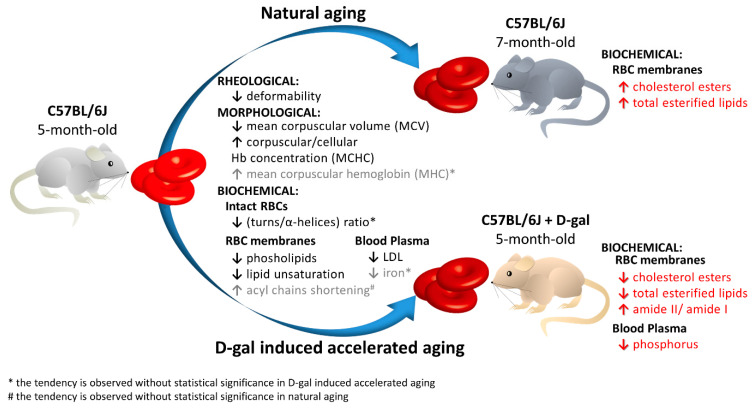
This work presents a semi-quantitative spectroscopic approach, including FTIR-ATR and Raman spectroscopies, for the biochemical analysis of red blood cells (RBCs) supported by the biochemical, morphological and rheological reference techniques. This multi-modal approach provided the description of the RBC alterations at the molecular level in a model of accelerated aging induced by administration of D-galactose (D-gal), in comparison to natural aging. Such an approach allowed to conclude that most age-related biochemical RBC membrane changes (a decrease in lipid unsaturation and the level of phospholipids, or an increase in acyl chain shortening) as well as alterations in the morphological parameters and RBC deformability are well reflected in the D-gal model of accelerated aging. Similarly, as in natural aging, a decrease in LDL level in blood plasma and no changes in the fraction of glucose, creatinine, total cholesterol, HDL, iron, or triglycerides were observed during the course of accelerated aging. Contrary to natural aging, the D-gal model led to an increase in cholesterol esters and the fraction of total esterified lipids in RBC membranes, and evoked significant changes in the secondary structure of the membrane proteins. Moreover, a significant decrease in the phosphorous level of blood plasma was specific for the D-gal model. On the other hand, natural aging induced stronger changes in the secondary structures of the proteins of the RBCs' interior. This work proves that research on the aging mechanism, especially in circulation-related diseases, should employ the D-gal model with caution. Nonetheless, the D-gal model enables to imitate age-related rheological alterations in RBCs, although they are partially derived from different changes observed in the RBC membrane at the molecular level.

Keywords: D-galactose-induced accelerated aging mouse model; Fourier transform infrared spectroscopy–attenuated total reflectance (FTIR–ATR); RBC membranes; Raman spectroscopy; aging; red blood cells (RBCs); vibrational spectroscopy.


Conflict of interest statement

The authors declare no conflict of interest. The funders had no role in the design of the study; in the collection, analyses, or interpretation of data; in the writing of the manuscript, or in the decision to publish the results.

Figures

Figure 1
Figure 1
Rheological and morphological changes in the red blood cells (RBCs) in natural aging and the D-galactose (D-gal) model. (A) Changes in the elongation index at a shear stress of 20 Pa; and (B) the red blood cell indices, mean corpuscular volume (MCV), mean corpuscular hemoglobin (MCH), mean corpuscular hemoglobin concentration (MCHC), red cell distribution width (RDW), in naturally aging C57BL/6J mice (5- and 7-month-old male C57BL/6J mice, n = 4 and n = 3, respectively) and the D-galactose-induced accelerated aging mouse model (5 month-old C57BL/6J male mice, n = 3) with the control group (5 month-old C57BL/6J male mice, n = 3). Data distribution is presented as box plots (median and interquartile range, min–max whiskers) and interval plot (mean value, median, min-max whiskers). Statistical significance of the obtained values was tested with a Mann–Whitney test (* p < 0.05; ** p < 0.01).
Figure 2
Figure 2
Biochemical parameters in the blood plasma in natural aging and the D-gal model. (A) Glucose, (B) HDL, (C) LDL, (D) creatinine, (E) phosphorous, and (F) iron levels in 5- and 7-month-old male C57BL/6J mice (n = 4 and n = 3, respectively) in natural aging and 5-month-old male C57BL/6J mice in the D-galactose-induced aging model (n=7) compared with the control group (n = 10). The data distribution is presented as boxes (median and interquartile range, min-max whiskers). The statistical significance of the obtained values was tested with a Mann–Whitney test (* p < 0.05; ** p < 0.01).
Figure 3
Figure 3
Spectroscopically derived biochemical profile of the RBC membranes in natural aging and the D-gal model. Ratios calculated for the integral absorbances of the ATR–FTIR spectra (AE) and integral intensities of the Raman spectra (F,G), showing alterations in the biochemical composition of the RBC membranes due to the D-galactose-induced accelerated aging (n = 3, 5-month-old D-galactose-fed C57BL/6J male mice) in comparison to control mice (n = 3, 5-month-old C57BL/6J male mice). Integration regions for IR bands: amide I—1651 cm−1 (1687–1605 cm−1); amide II—1544 cm−1 (1560–1502 cm−1); CH2 symmetric stretch—2933 cm−1 (2863–2847 cm−1); CH3 asymmetric stretch—2873 cm−1 (2965–2936 cm−1); PO2 asymmetric stretch—1236 cm−1 (1261–1214 cm−1); –CO–O–C stretch—1167 cm−1 (1191–1144 cm−1); amide I—1651 cm−1 (1687–1605 cm−1); amide II—1544 cm−1 (1560–1502 cm−1). Integration regions for the Raman bands: symmetric stretch of C=O—1743 cm−1 (1715–1764 cm−1) symmetric stretch C=C—1661 cm−1 (1655–1670 cm−1), scissoring and bending vibrations of CH2 and CH3—1447 cm−1 (1420–1480 cm−1), aromatic ring breathing mode–phenylalanine—1007 cm−1 (990–1015 cm−1). Changes in the RBC membranes in natural aging are presented in Figure S4. Normality was assessed using the Shapiro–Wilk test. The data are expressed as box plots (median and interquartile range) and the significance was calculated using the Mann–Whitney test (* p < 0.05, ** p < 0.01).
Figure 4
Figure 4
Spectroscopically derived biochemical profile of intact RBCs in natural aging and the D-gal model. (A) Second derivative FTIR–ATR spectra (with SD) of unfixed, intact RBCs taken from 5- and 7-month-old C57BL/6J mice (a and b, respectively) (n = 3–4) and 5-month-old C57BL/6J mice (n = 3) and treated with D-galactose (c and d, respectively) (n = 3), displayed in the 1700–1500 cm−1 spectral region; (B,C) ratios of the integral absorbances at 1660/1650 and 1640/1650 cm−1, respectively, comparing natural aging and a model of D-galactose-induced accelerated aging, in terms of alterations in the secondary structures of the RBC proteins, i.e., turns to α-helices and unordered conformations to α-helices, respectively. Normality was assessed using the Shapiro–Wilk test. The data are expressed as box plots (median and interquartile range) and the significance was calculated using a Mann–Whitney test (* p < 0.05).
Figure 5
Figure 5
A schematic of the performed experiment.
Figure 6
Figure 6
Schematic diagram of the RBC changes during natural aging compared with accelerated aging induced by D-galactose.

References

    1. Finkel T., Holbrook N.J. Oxidants, oxidative stress and the biology of ageing. Nature. 2000;408:239–247. doi: 10.1038/35041687. - DOI - PubMed
    1. Flores M., Leonart M., Nascimento A. Oxidative process in erythrocytes of individuals with hemoglobin S. Hematology. 2008;13:187–192. - PubMed
    1. Dybas J., Bulat K., Blat A., Mohaissen T., Wajda A., Mardyla M., Kaczmarska M., Franczyk-Zarow M., Malek K., Chlopicki S., et al. Age-related and atherosclerosis-related erythropathy in ApoE/LDLR-/- mice. Biochim. Biophys. Acta Mol. Basis Dis. 2020:165972. doi: 10.1016/j.bbadis.2020.165972. - DOI - PubMed
    1. Smith J.E. Erythrocyte Membrane: Structure, Function, and Pathophysiology. Vet. Pathol. 1987;24:471–476. doi: 10.1177/030098588702400601. - DOI - PubMed
    1. Cooper R.A., Arner E.C., Wiley J.S., Shattil S.J. Modification of red cell membrane structure by cholesterol-rich lipid dispersions. A model for the primary spur cell defect. J. Clin. Invest. 1975;55:115–126. doi: 10.1172/JCI107901. - DOI - PMC - PubMed

MeSH terms

LinkOut - more resources