. 2021 Mar 6;10(3):584.
doi: 10.3390/cells10030584.

Asymmetrical Forces Dictate the Distribution and Morphology of Platelets in Blood Clots

Affiliations

Asymmetrical Forces Dictate the Distribution and Morphology of Platelets in Blood Clots

Tatiana A Kovalenko et al. Cells. .

Abstract

Primary hemostasis consists in the activation of platelets, which spread on the exposed extracellular matrix at the injured vessel surface. Secondary hemostasis, the coagulation cascade, generates a fibrin clot in which activated platelets and other blood cells get trapped. Active platelet-dependent clot retraction reduces the clot volume by extruding the serum. Thus, the clot architecture changes with time of contraction, which may have an important impact on the healing process and the dissolution of the clot, but the precise physiological role of clot retraction is still not completely understood. Since platelets are the only actors to develop force for the retraction of the clot, their distribution within the clot should influence the final clot architecture. We analyzed platelet distributions in intracoronary thrombi and observed that platelets and fibrin co-accumulate in the periphery of retracting clots in vivo. A computational mechanical model suggests that asymmetric forces are responsible for a different contractile behavior of platelets in the periphery versus the clot center, which in turn leads to an uneven distribution of platelets and fibrin fibers within the clot. We developed an in vitro clot retraction assay that reproduces the in vivo observations and follows the prediction of the computational model. Our findings suggest a new active role of platelet contraction in forming a tight fibrin- and platelet-rich boundary layer on the free surface of fibrin clots.

Keywords: clot retraction; computational modeling; fibrin; hemostasis; platelet; thrombosis.


Conflict of interest statement

The authors declare no conflict of interest.

Figures

Figure 1
Figure 1
Platelets accumulate in the periphery of human coronary thrombi. (AD) Sections (4 μm) of human coronary thrombi stained with an antibody against CD42b. Four different examples of thrombi with a platelet-rich periphery are shown. (E) The surface area occupied by platelets was determined, and clots were classified into five different categories based on the platelet density. The number of clots with and without platelet accumulation in the periphery for each category is shown; n = 84 clots.
Figure 2
Figure 2
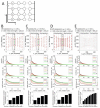
Computational modeling of platelet distributions in a one-dimensional, unconstrained clot. (A) Schematic representation of the modeled system. Platelets are depicted as circles, connected by elastic springs. Fi,j is the force exerted on a platelet i by a neighboring platelet j pulling on the adjacent fibrin stands. Ffibi,j is the force exerted on a platelet i by the compressed fibrin gel. The forces change with the distance between platelets (|xj − xi|) according to Hooke’s law. (BE) The modeling approach simulates platelet distributions after contraction. Black ovals—initial state of platelet distribution. Blue ovals—platelet distribution after contraction, indicating that the platelets are located uniformly in the retracted clot. Simulations of platelet velocities (upper graphs), net forces (the vector sum of forces that act on a platelet; middle graphs), and total forces (the algebraic sum of all forces that act on a platelet; lower graphs) are shown for different platelet concentrations, different viscosities of the fibrin network (µ), or different clot sizes as indicated at the top of panels B-E. For all conditions, platelets at the border of the thrombus move faster than platelets in the center. The platelet velocity decreases exponentially with time of contraction. Net forces that act on the peripheral platelets are higher than net forces in the center of the clot. In contrast, total forces are higher in the center than in the periphery. Forces are not influenced by the viscosity of the fibrin network and the platelet concentration. Velocities decrease when the viscosity of the fibrin network increases.
Figure 3
Figure 3
Platelets are homogenously distributed in an unconstrained retracting clot. Platelet-rich plasma (PRP) was either recalcified (A) or not (B) before induction of clot formation by the addition of thrombin (final concentration of 2.5 U/mL). Clots were fixed after 60 min of retraction at RT, and 14 μm sections were stained to detect the position of platelets using an antibody against αIIb integrins present on the platelet surface; scale bar, 100 μm.
Figure 4
Figure 4
Computational modeling of platelet distributions in a two-dimensional, constrained clot. (A) Schematic representation of the modeled system. Platelets are depicted as circles, connected by elastic springs. Holders are modeled as stiff rods. The connection between a platelet and a holder is modeled as an elastic spring. (BE) Upper panels: the modeling approach simulates the non-uniform distribution of platelets within the clot after contraction for different platelet concentrations, different viscosities of the fibrin network (µ), or different clot sizes as indicated on top of the panels (BE). Black ovals—initial state of platelet distribution. Red ovals—platelet distribution after contraction. For the central part of the system (numbered platelets in the black box), platelets accumulate at the free periphery of the clot, while the distance between central platelets remains large. Middle panels: simulation of platelet velocities (first graph), net forces (the vector sum of forces that act on a platelet; second graph), and total forces (the algebraic sum of all forces that act on a platelet; third graph). Platelets at the free periphery of the thrombus move faster than platelets in the center. The platelet velocity decreases exponentially with time of contraction. Net forces that act on the peripheral platelets are higher than net forces in the center of the clot. For peripheral platelets, net forces are directed towards the center of the clot. For central platelets, forces acting in opposite directions are balanced and net force is close to zero. In contrast, total forces are higher in the center than in the periphery. Forces are not influenced by the viscosity (µ) of the fibrin network and the platelet concentration. Velocities decrease when the viscosity of the fibrin network increases. Lower graphs: the calculation of distances between pairs of platelets in the central column (platelets in the black box in upper panels of (BE)) shows that the distance between platelets at the border (bar 1) is significantly smaller than the distances between platelets in the center (bar 4 or 9).
Figure 5
Figure 5
Platelets accumulate in the clot periphery after clot contraction under isometric tension. Alexa 488-labeled fibrinogen was added to PRP before the induction of clot formation in tubes containing two holders (see Supplementary Figure S1B). Clots were fixed after 3 h of retraction at 37 °C, and sections were stained for αIIb integrins. Left image shows integrin staining (red), and right image shows fibrin fibers (green); scale bar, 100 μm (A). Higher-resolution images show that platelets are more compact in the clot periphery (B) than in the clot center (C); scale bar, 10 μm.
Figure 5
Figure 5
Platelets accumulate in the clot periphery after clot contraction under isometric tension. Alexa 488-labeled fibrinogen was added to PRP before the induction of clot formation in tubes containing two holders (see Supplementary Figure S1B). Clots were fixed after 3 h of retraction at 37 °C, and sections were stained for αIIb integrins. Left image shows integrin staining (red), and right image shows fibrin fibers (green); scale bar, 100 μm (A). Higher-resolution images show that platelets are more compact in the clot periphery (B) than in the clot center (C); scale bar, 10 μm.
Figure 6
Figure 6
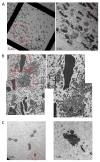
Transmission electron microscopy of clot sections. (A) Overview of clot sections, left panel (red arrows indicate undeformed erythrocytes closer to the clot center), and enlargement of the clot periphery as indicated by the red rectangle, right panel (red circle indicates a typical platelet cut approximately in its center; red ellipse indicates a typical compressed erythrocyte cut approximately in its center). (B) Enlargement of periphery, left panel, and higher magnification of the same image as indicated by the red rectangles. (C) Enlargement of the clot center, left panel, and higher magnification of the same image as indicated by the red square.

References

    1. Leon C., Eckly A., Hechler B., Aleil B., Freund M., Ravanat C., Jourdain M., Nonne C., Weber J., Tiedt R., et al. Megakaryocyte-restricted MYH9 inactivation dramatically affects hemostasis while preserving platelet aggregation and secretion. Blood. 2007;110:3183–3191. doi: 10.1182/blood-2007-03-080184. - DOI - PubMed
    1. Kim O.V., Litvinov R.I., Alber M.S., Weisel J.W. Quantitative structural mechanobiology of platelet-driven blood clot contraction. Nat. Commun. 2017;8:1274. doi: 10.1038/s41467-017-00885-x. - DOI - PMC - PubMed
    1. Samson A.L., Alwis I., MacLean J.A.A., Priyananda P., Hawkett B., Schoenwaelder S.M., Jackson S.P. Endogenous fibrinolysis facilitates clot retraction in vivo. Blood. 2017;130:2453–2462. doi: 10.1182/blood-2017-06-789032. - DOI - PubMed
    1. Cines D.B., Lebedeva T., Nagaswami C., Hayes V., Massefski W., Litvinov R.I., Rauova L., Lowery T.J., Weisel J.W. Clot contraction: Compression of erythrocytes into tightly packed polyhedra and redistribution of platelets and fibrin. Blood. 2014;123:1596–1603. doi: 10.1182/blood-2013-08-523860. - DOI - PMC - PubMed
    1. Muthard R.W., Diamond S.L. Blood clots are rapidly assembled hemodynamic sensors: Flow arrest triggers intraluminal thrombus contraction. Arterioscler. Thromb. Vasc. Biol. 2012;32:2938–2945. doi: 10.1161/ATVBAHA.112.300312. - DOI - PMC - PubMed

Publication types

LinkOut - more resources