. 2021 Mar 6;8(3):36.
doi: 10.3390/bioengineering8030036.

Saccharomyces cerevisiae Concentrates Subtoxic Copper onto Cell Wall from Solid Media Containing Reducing Sugars as Carbon Source

Affiliations

Saccharomyces cerevisiae Concentrates Subtoxic Copper onto Cell Wall from Solid Media Containing Reducing Sugars as Carbon Source

Lavinia L Ruta et al. Bioengineering (Basel). .

Abstract

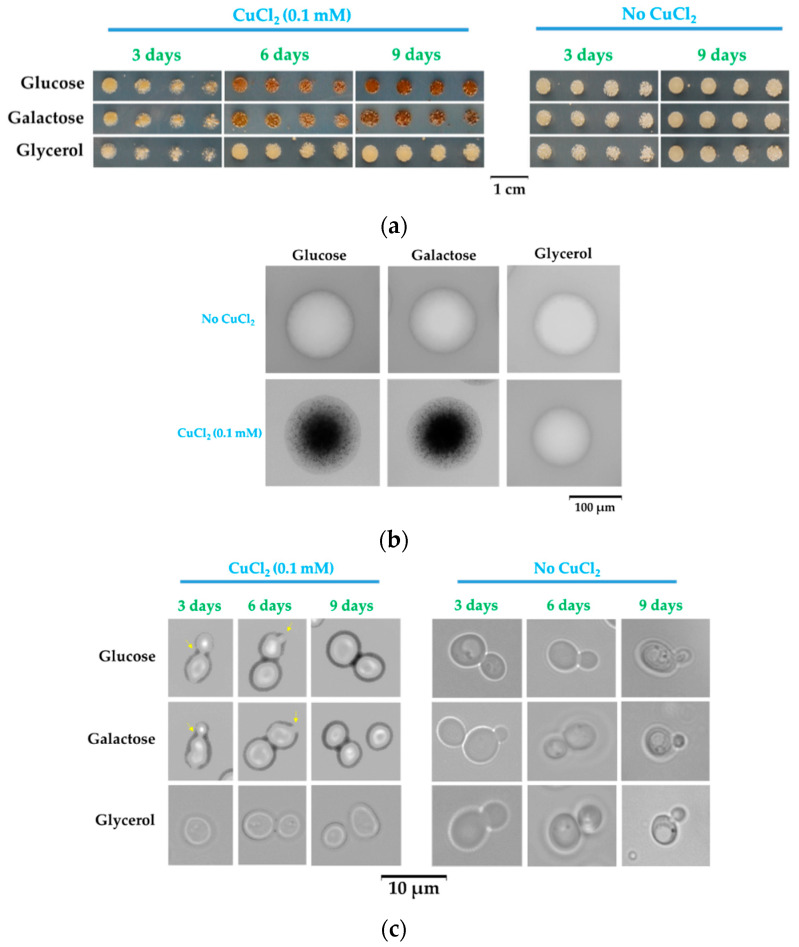
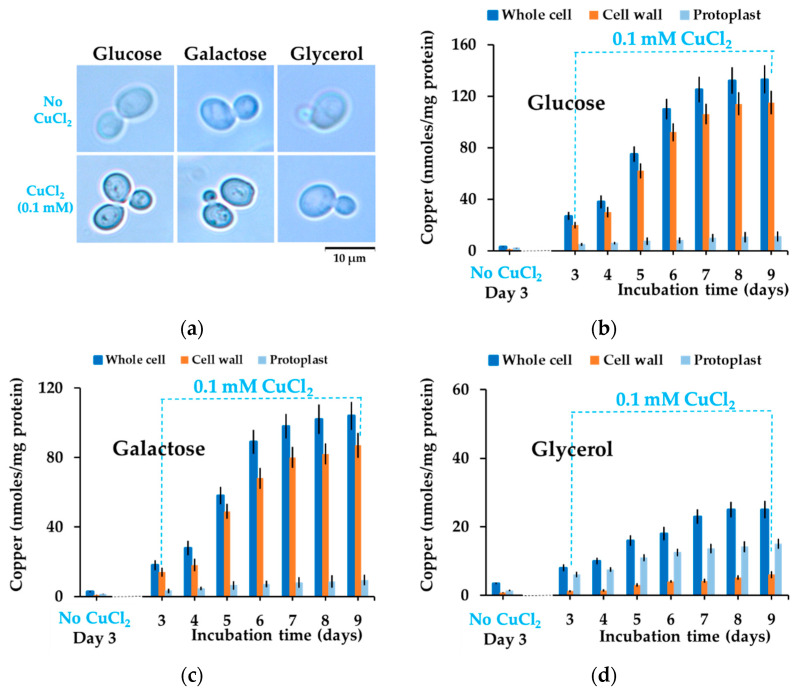
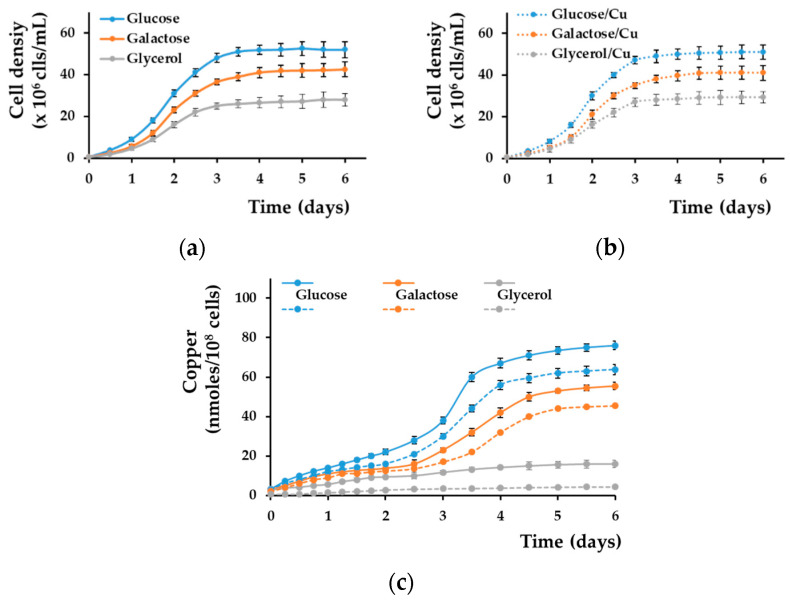
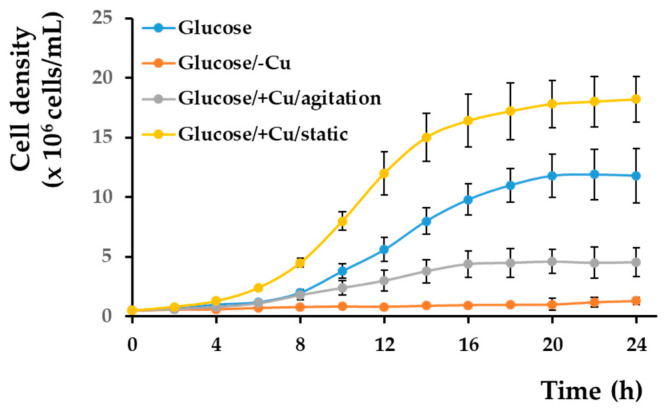
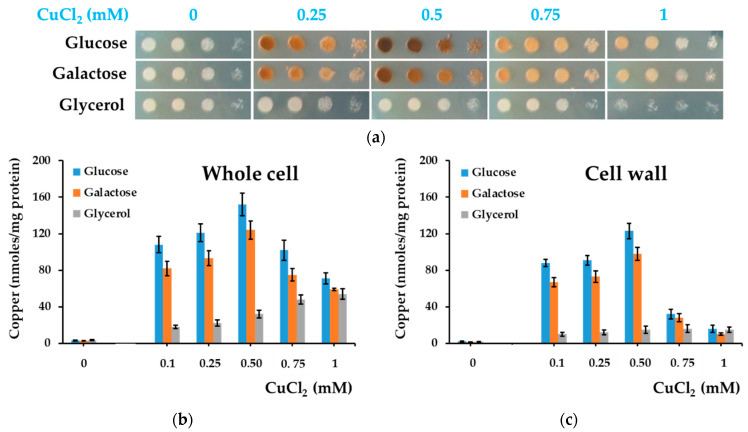
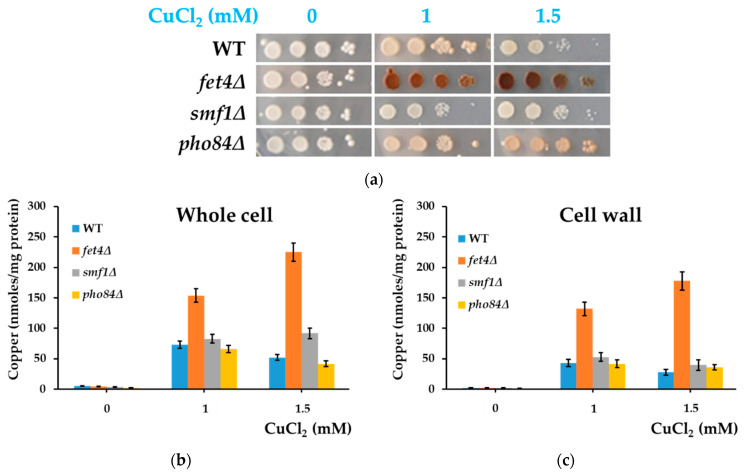
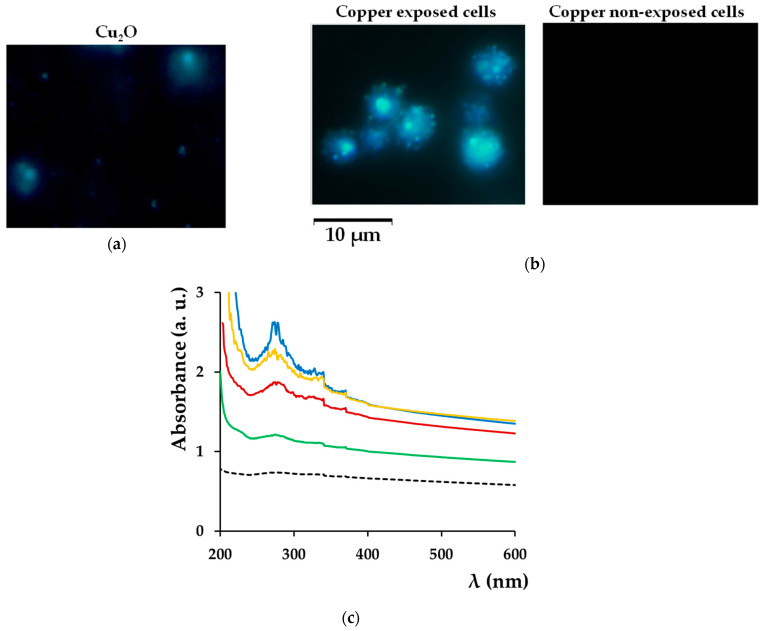
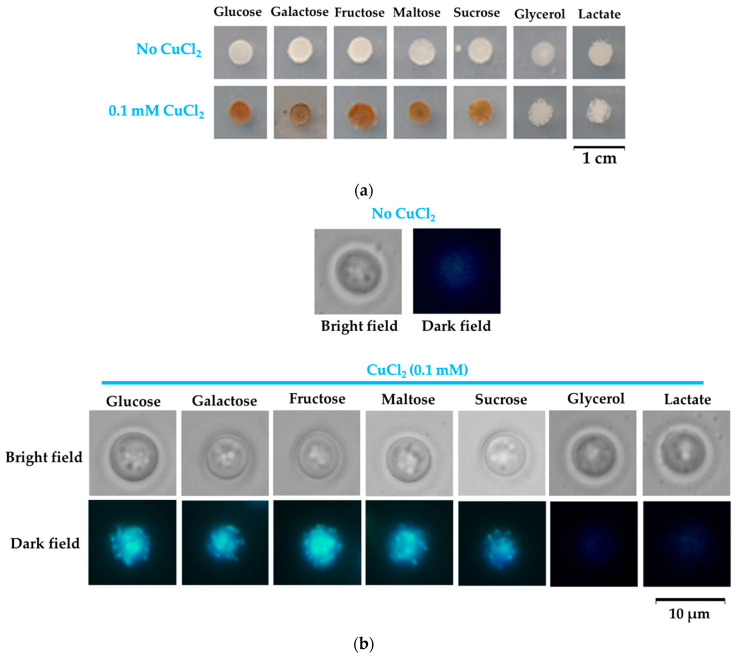
Copper is essential for life, but it can be deleterious in concentrations that surpass the physiological limits. Copper pollution is related to widespread human activities, such as viticulture and wine production. To unravel aspects of how organisms cope with copper insults, we used Saccharomyces cerevisiae as a model for adaptation to high but subtoxic concentrations of copper. We found that S. cerevisiae cells could tolerate high copper concentration by forming deposits on the cell wall and that the copper-containing deposits accumulated predominantly when cells were grown statically on media prepared with reducing sugars (glucose, galactose) as sole carbon source, but not on media containing nonreducing carbon sources, such as glycerol or lactate. Exposing cells to copper in liquid media under strong agitation prevented the formation of copper-containing deposits at the cell wall. Disruption of low-affinity copper intake through the plasma membrane increased the potential of the cell to form copper deposits on the cell surface. These results imply that biotechnology problems caused by high copper concentration can be tackled by selecting yeast strains and conditions to allow the removal of excess copper from various contaminated sites in the forms of solid deposits which do not penetrate the cell.

Keywords: Saccharomyces cerevisiae; carbon source; coloration; copper; extracellular deposit.


Conflict of interest statement

The authors declare no conflict of interest.

Figures

Figure 1
Figure 1
Coloration of Saccharomyces cerevisiae grown on copper-containing medium. (a) Cell suspensions of strain BY4741 were spotted in serial dilution on minimal defined media (MM)/Glc (Glucose), MM/Gal (Galactose), or MM/Gly (Glycerol) media with or without additional CuCl2. Plates were observed daily and photographed at various times. (b) Microscopic images of yeast colonies grown from one single cell for 9 days on MM with or without 0.1 mM CuCl2. (c) Microscopic images of yeast cells grown on media enriched with 0.1 mM CuCl2. Cells were picked from duplicate plates shown in (a). Grey images are shown, for clarity, in (b,c).
Figure 2
Figure 2
Accumulation of copper by Saccharomyces cerevisiae cells exposed to CuCl2 on solid media. Exponentially growing cells of wild-type strain BY4741 were spotted (5 μL of 1 × 10⁶ cells/mL suspensions) on agar plates containing MM/Glc (Glucose), MM/Gal (Galactose), or MM/Gly (Glycerol) with or without 0.1 mM CuCl2. (a) Visualization of copper bound to yeast cell surface. Cells grown on agar plates for 6 days were suspended in 5 µL of buffer containing 0.1 mM bathocuproine disulfonate (BCS) directly on microscope slide. Cells were visualized in bright field 10 minutes after BCS staining. (bd) Copper accumulation by cells grown statically on solid agar media and its distribution between cell wall and protoplasts. Cell suspensions were spotted on agar plates as in (a) and incubated in a dark incubator. Starting from day 3, cell patches were harvested and processed for copper assay, as described in Section 2. Cells from the same batch in MM/Glc (b), MM/Gal (c), or MM/Gly (d), were used to determine whole-cell copper, cell wall copper, or copper accumulated in protoplasts. Values were normalized to cell total proteins in the corresponding intact cells. Values are mean ± SEM of triplicate determinations done on three biological repeats.
Figure 3
Figure 3
Copper accumulation by yeast cell grown statically in MM liquid media. Cell suspensions of wild-type strain BY4741 were inoculated (5 × 10⁵ cells/mL) in MM/Glc (Glucose), MM/Gal (Galactose), or MM/Gly (Glycerol), and cell proliferation was determined spectrophotometrically (OD660) in the absence (a) or presence (b) of 0.1 mM CuCl2. (c) Copper associated with whole cells (full lines) or with cell walls (dotted lines) was determined as described in Section 2. Values are mean ± SEM of triplicate determinations done on three biological repeats.
Figure 4
Figure 4
Growth of copper-loaded and copper-starved cells in copper-deficient medium. Wild-type strain BY4741 was pre-grown for 16 h in liquid MM/Glc (Glucose), MM/Glc without Cu (glucose/–Cu), or MM/Glc with 0.1 mM CuCl2 under agitation (Glucose/+Cu/agitation) or for 3 days statically in MM/Glc with 0.1 mM CuCl2 (Glucose/+Cu/static) before being washed and shifted to MM/Glc/–Cu at density 5 × 10⁵ cells/mL. Cell proliferation was determined spectrophotometrically (OD660) as described in Section 2. Values are mean ± SEM of triplicate determinations done on three biological repeats.
Figure 5
Figure 5
Coloration of Saccharomyces cerevisiae and accumulation of copper at higher copper concentrations. (a) Cell suspensions of strain BY4741 were spotted in serial dilution onto MM/Glc (Glucose), MM/Gal (Galactose), or MM/Gly (Glycerol) media with various concentrations of CuCl2. Plates shown were photographed after 6 days of incubation at 28 °C. (b) Copper accumulation by cells grown statically on MM agar media. Cell suspensions were spotted on agar plates (approximately 106 cells/5 µL spot) and incubated at 28 °C. (c) Copper associated with cell walls. Cell patches were harvested after 6 days of incubation and processed for copper assay, as described in Section 2. The cells used to determine whole-cell copper, cell wall copper, and total cell protein used for normalization belonged to the same batch. Values are mean ± SEM of triplicate determinations done on three biological repeats.
Figure 6
Figure 6
Coloration and accumulation of copper by Saccharomyces cerevisiae strains with defects in low-affinity transport of copper across the plasma membrane. (a) Cell suspensions of strain BY4741 (WT) and of isogenic strains fet4Δ, smf1Δ, and pho84Δ were spotted in serial dilution onto MM/Glc (Glucose) media with various concentrations of CuCl2. Plates shown were photographed after 6 days of incubation at 28 °C. (b) Copper accumulation by cells grown statically on MM/Glc agar media. Cell suspensions were spotted on agar plates (approximately 106 cells/5 µL spot) and incubated at 28 °C. Cell patches were harvested after 6 days of incubation and processed for copper assay, as described in Section 2. (c) Copper associated with cell walls. The cells used to determine whole-cell copper, cell wall copper, and total cell protein used for normalization belong to the same batch. Values are mean ± SEM of triplicate determination done on three biological repeats.
Figure 7
Figure 7
Optical properties of copper-exposed cells. Light scattering by Cu2O particles (a) or by cells exposed to copper (b). BY4741 cells were grown for 6 days on MM/Glc with or without 0.1 mM CuCl2 before being observed microscopically in dark field. (c) UV–Vis spectra. Cells were processed as described in Section 2. Spectra correspond to cells grown for 6 days on solid MM/Glc (blue line), MM/Gal (Yellow), or MM/Gly (green) containing 0.1 mM CuCl2 or in MM/Glc without CuCl2 (black dotted line). Spectrum of Cu2O particles (red line) was included as control.
Figure 8
Figure 8
Influence of carbon source on copper deposition on the Saccharomyces cerevisiae cells. (a) Cell suspensions of strain BY4741 were spotted (5 μL containing approximately 104 cells initially) onto MM/Glc (Glucose), MM/Gal (Galactose), MM/Fru (Fructose), MM/Mal (Maltose), MM/Suc (Sucrose), MM/Gly (Glycerol), or MM/Lac (Lactate) media with or without 0.1 mM CuCl2. Plates were photographed after 6 days of incubation at 28 °C. (b) Microscopic images of yeast cells isolated from cell population shown in (a). Cells were picked by a sterile loop, washed gently, and suspended in 5 μL water directly in the microscope slide. For bright-field images, automatic time exposure was used (an average of 1 ms). For dark-field images, exposure time was 1 s.

Similar articles

Cited by

References

    1. Culotta V. Cell biology of copper. J. Biol. Inorg. Chem. 2010;15:1–2. doi: 10.1007/s00775-009-0601-x. - DOI - PubMed
    1. Nevitt T., Ohrvik H., Thiele D.J. Charting the travels of copper in eukaryotes from yeast to mammals. Biochim. Biophys. Acta. 2012;1823:1580–1593. doi: 10.1016/j.bbamcr.2012.02.011. - DOI - PMC - PubMed
    1. Guengerich F.P. Introduction to metals in biology 2018: Copper homeostasis and utilization in redox enzymes. J. Biol. Chem. 2018;293:4603–4605. doi: 10.1074/jbc.TM118.002255. - DOI - PMC - PubMed
    1. Valko M., Morris H., Cronin M.T. Metals, toxicity and oxidative stress. Curr. Med. Chem. 2005;12:1161–1208. doi: 10.2174/0929867053764635. - DOI - PubMed
    1. Uriu-Adams J.Y., Keen C.L. Copper, oxidative stress, and human health. Mol. Aspects Med. 2005;26:268–298. doi: 10.1016/j.mam.2005.07.015. - DOI - PubMed

LinkOut - more resources