Identification of Chlorophyll Metabolism- and Photosynthesis-Related Genes Regulating Green Flower Color in Chrysanthemum by Integrative Transcriptome and Weighted Correlation Network Analyses
- PMID: 33801035
- PMCID: PMC8004015
- DOI: 10.3390/genes12030449
Identification of Chlorophyll Metabolism- and Photosynthesis-Related Genes Regulating Green Flower Color in Chrysanthemum by Integrative Transcriptome and Weighted Correlation Network Analyses
Abstract
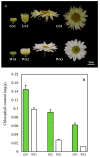
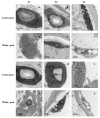
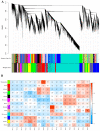
Green chrysanthemums are difficult to breed but have high commercial value. The molecular basis for the green petal color in chrysanthemum is not fully understood. This was investigated in the present study by RNA sequencing analysis of white and green ray florets collected at three stages of flower development from the F1 progeny of the cross between Chrysanthemum × morifolium "Lüdingdang" with green-petaled flowers and Chrysanthemum vistitum with white-petaled flowers. The chlorophyll content was higher and chloroplast degradation was slower in green pools than in white pools at each developmental stage. Transcriptome analysis revealed that genes that were differentially expressed between the two pools were enriched in pathways related to chlorophyll metabolism and photosynthesis. We identified the transcription factor genes CmCOLa, CmCOLb, CmERF, and CmbHLH as regulators of the green flower color in chrysanthemum by differential expression analysis and weighted gene co-expression network analysis. These findings can guide future efforts to improve the color palette of chrysanthemum flowers through genetic engineering.
Keywords: chlorophyll metabolism; florist’s chrysanthemum; green ray floret; photosynthesis; segregating population; transcriptome; weighted gene co-expression network analysis (WGCNA).
Conflict of interest statement
The authors declare no conflict of interest. The funders had no role in the design of the study; in the collection, analyses, or interpretation of data; in the writing of the manuscript, or in the decision to publish the results.
Figures


Similar articles
-
CmNAC73 Mediates the Formation of Green Color in Chrysanthemum Flowers by Directly Activating the Expression of Chlorophyll Biosynthesis Genes HEMA1 and CRD1.Genes (Basel). 2021 May 8;12(5):704. doi: 10.3390/genes12050704. Genes (Basel). 2021. PMID: 34066887 Free PMC article.
-
Whole-transcriptome analysis of differentially expressed genes in the ray florets and disc florets of Chrysanthemum morifolium.BMC Genomics. 2016 May 25;17:398. doi: 10.1186/s12864-016-2733-z. BMC Genomics. 2016. PMID: 27225275 Free PMC article.
-
Comparative transcriptomics and weighted gene co-expression correlation network analysis (WGCNA) reveal potential regulation mechanism of carotenoid accumulation in Chrysanthemum × morifolium.Plant Physiol Biochem. 2019 Sep;142:415-428. doi: 10.1016/j.plaphy.2019.07.023. Epub 2019 Aug 2. Plant Physiol Biochem. 2019. PMID: 31416008
-
Anthocyanins in Floral Colors: Biosynthesis and Regulation in Chrysanthemum Flowers.Int J Mol Sci. 2020 Sep 7;21(18):6537. doi: 10.3390/ijms21186537. Int J Mol Sci. 2020. PMID: 32906764 Free PMC article. Review.
-
Molecular mechanisms underlying the diverse array of petal colors in chrysanthemum flowers.Breed Sci. 2018 Jan;68(1):119-127. doi: 10.1270/jsbbs.17075. Epub 2018 Feb 17. Breed Sci. 2018. PMID: 29681754 Free PMC article. Review.
Cited by
-
Important Roles of Key Genes and Transcription Factors in Flower Color Differences of Nicotianaalata.Genes (Basel). 2021 Dec 10;12(12):1976. doi: 10.3390/genes12121976. Genes (Basel). 2021. PMID: 34946925 Free PMC article.
-
Chlorophyllase (PsCLH1) and light-harvesting chlorophyll a/b binding protein 1 (PsLhcb1) and PsLhcb5 maintain petal greenness in Paeonia suffruticosa 'Lv Mu Yin Yu'.J Adv Res. 2025 Jul;73:173-185. doi: 10.1016/j.jare.2024.09.003. Epub 2024 Sep 3. J Adv Res. 2025. PMID: 39236974 Free PMC article.
-
CmNAC73 Mediates the Formation of Green Color in Chrysanthemum Flowers by Directly Activating the Expression of Chlorophyll Biosynthesis Genes HEMA1 and CRD1.Genes (Basel). 2021 May 8;12(5):704. doi: 10.3390/genes12050704. Genes (Basel). 2021. PMID: 34066887 Free PMC article.
-
Integrated metabolomic and transcriptomic analysis of the anthocyanin regulatory networks in Lagerstroemia indica petals.BMC Plant Biol. 2025 Mar 12;25(1):316. doi: 10.1186/s12870-025-06350-y. BMC Plant Biol. 2025. PMID: 40075284 Free PMC article.
-
Expression of RsPORB Is Associated with Radish Root Color.Plants (Basel). 2023 Jun 3;12(11):2214. doi: 10.3390/plants12112214. Plants (Basel). 2023. PMID: 37299194 Free PMC article.
References
-
- Chen J.Y. The Origin of Garden Chrysanthemum. 1st ed. Anhui Science and Technology Publishing House; Hefei, China: 2012. pp. 9–11.
-
- Park C.H., Chae S.C., Park S.Y., Kim J.K., Kim Y.J., Chung S.O., Arasu M.V., Al-Dhabi N.A., Park S.U. Anthocyanin and carotenoid contents in different cultivars of chrysanthemum (Dendranthema grandiflorum Ramat.) flower. Molecules. 2015;20:11090–11102. doi: 10.3390/molecules200611090. - DOI - PMC - PubMed
Publication types
MeSH terms
Substances
LinkOut - more resources
Full Text Sources
Other Literature Sources

