

Eicosapentaenoic Acid Inhibits KRAS Mutant Pancreatic Cancer Cell Growth by Suppressing Hepassocin Expression and STAT3 Phosphorylation
- PMID: 33801246
- PMCID: PMC8001293
- DOI: 10.3390/biom11030370
Eicosapentaenoic Acid Inhibits KRAS Mutant Pancreatic Cancer Cell Growth by Suppressing Hepassocin Expression and STAT3 Phosphorylation
Abstract
Background: The oncogenic Kirsten rat sarcoma viral oncogene homolog (KRAS) mutation was reported to be the signature genetic event in most cases of pancreatic ductal adenocarcinoma (PDAC). Hepassocin (HPS/FGL1) is involved in regulating lipid metabolism and the progression of several cancer types; however, the underlying mechanism of HPS/FGL1 in the KRAS mutant PDAC cells undergoing eicosapentaenoic acid (EPA) treatment remains unclear.
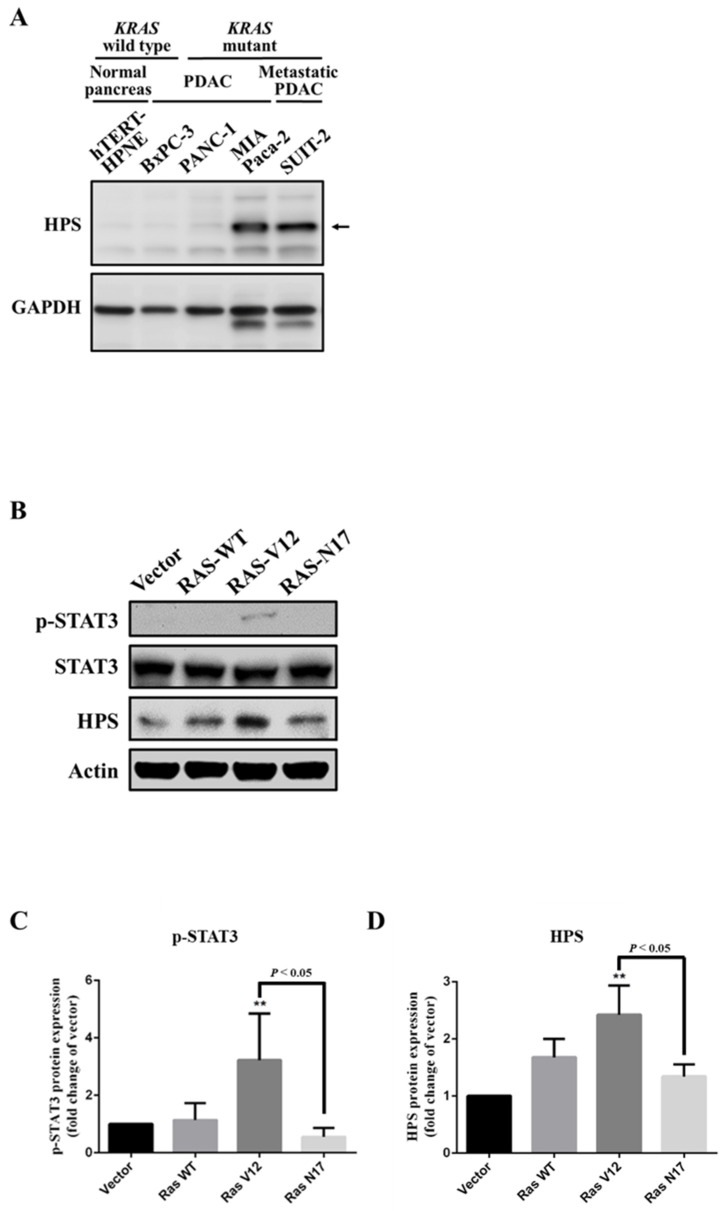
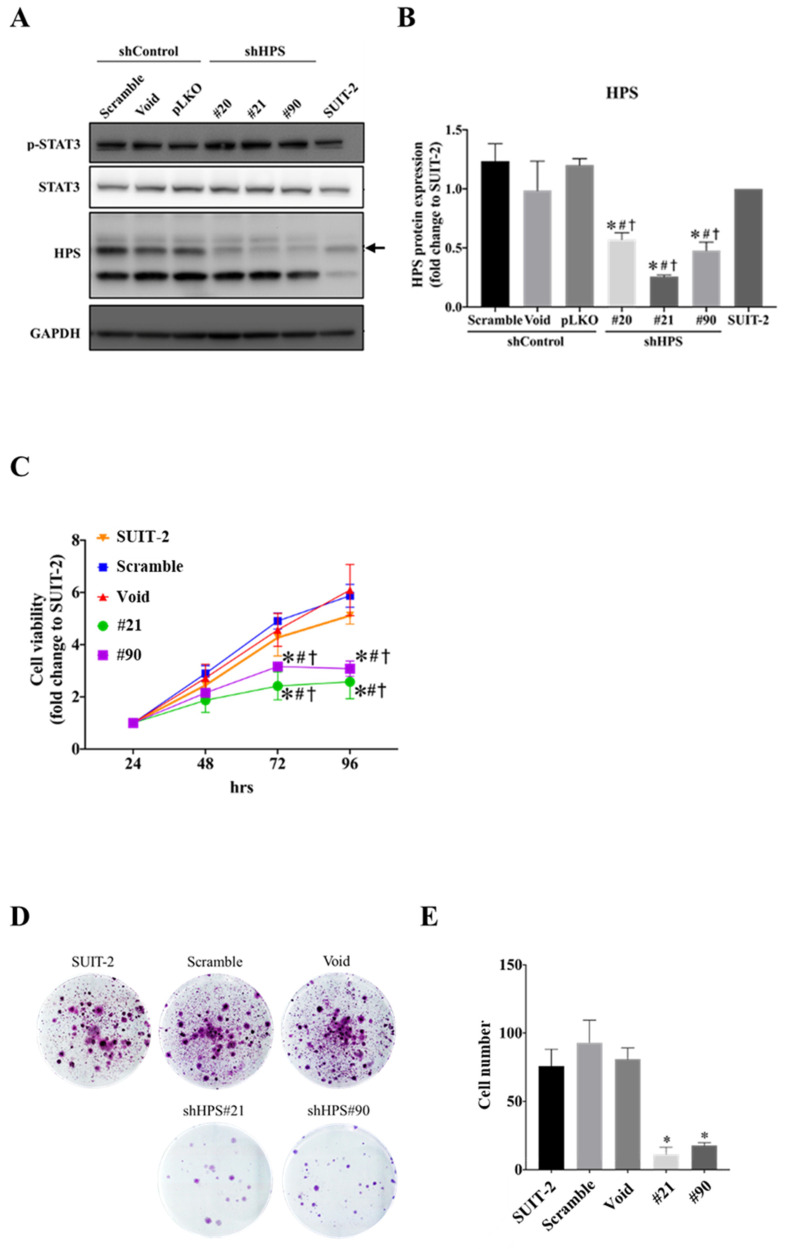
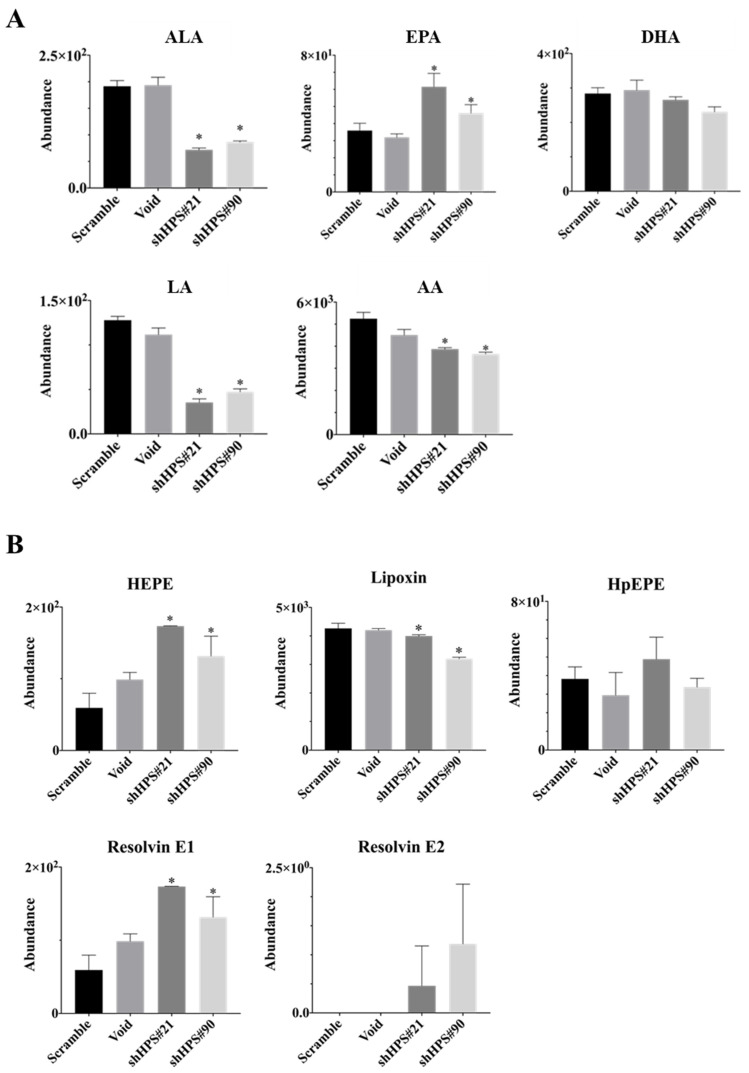
Methods: We measured HPS/FGL1 protein expressions in a human pancreatic ductal epithelial (HPNE) normal pancreas cell line, a KRAS-wild-type PDAC cell line (BxPC-3), and KRAS-mutant PDAC cell lines (PANC-1, MIA PaCa-2, and SUIT-2) by Western blot methods. HEK293T cells were transiently transfected with corresponding KRAS-expressing plasmids to examine the level of HPS expression with KRAS activation. We knocked-down HPS/FGL1 using lentiviral vectors in SUIT-2 cells and measured the cell viability by 3-(4,5-dimethylthiazol-2-yl)-2,5-diphenyltetrazolium bromide (MTT) and clonogenicity assays. Furthermore, a lipidomic analysis was performed to profile changes in lipid metabolism after HPS/FGL1 knockdown.
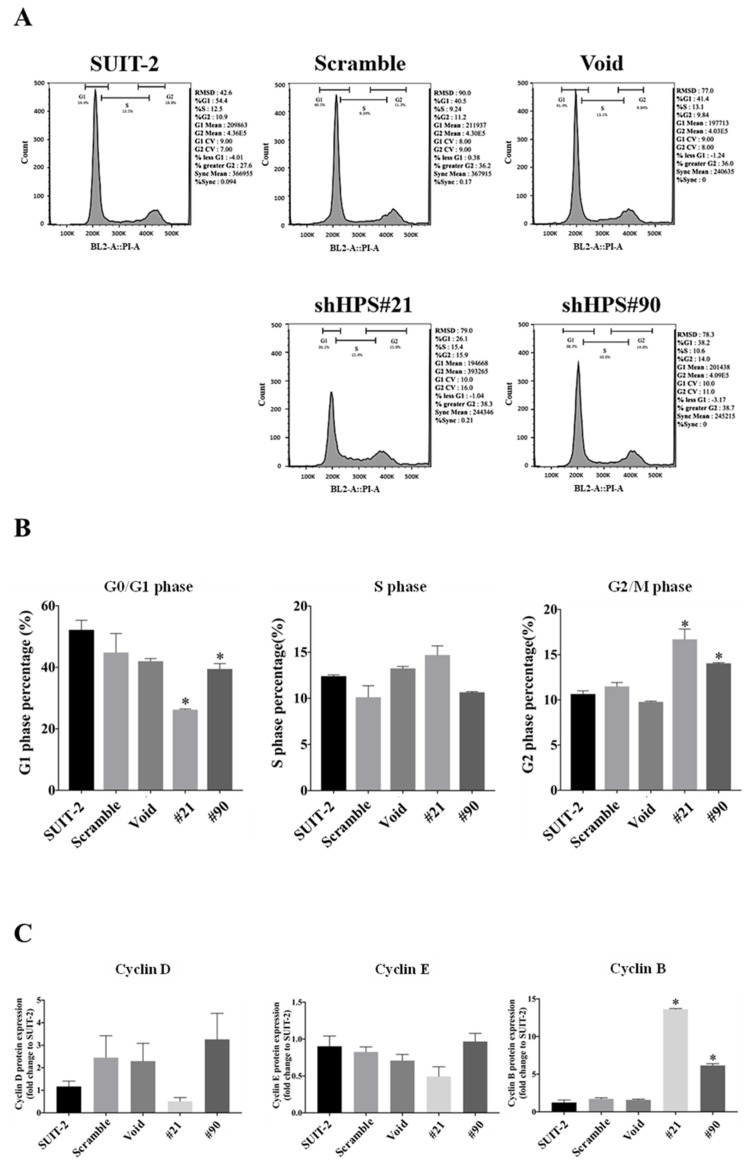
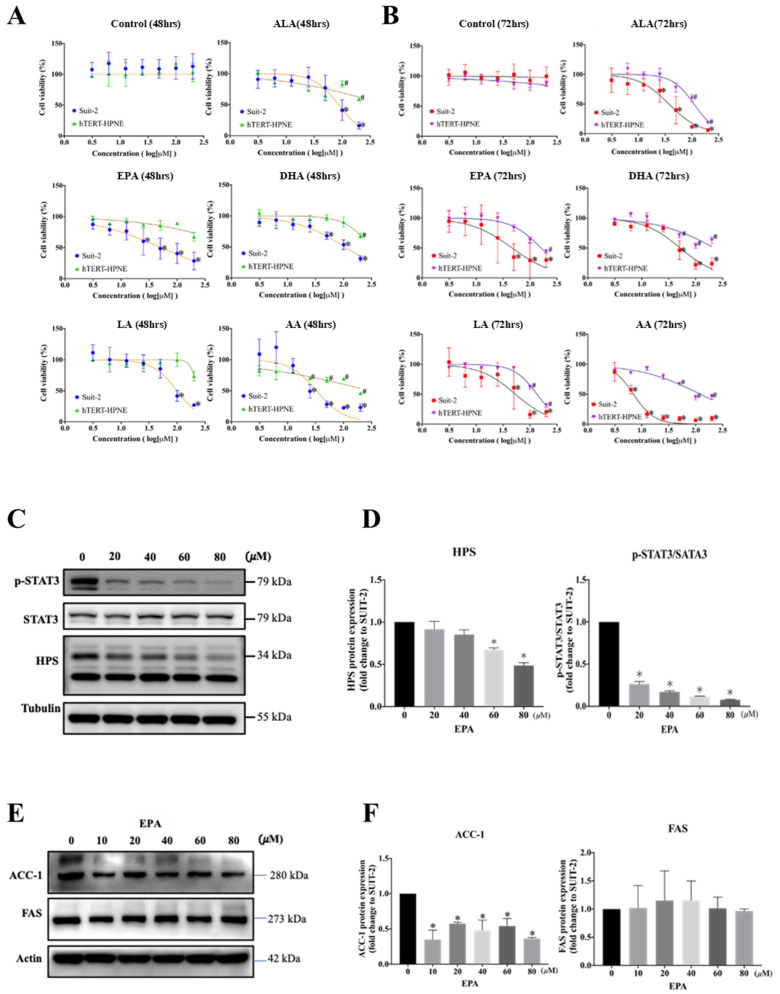
Results: We found that the HPS/FGL1 level was significantly upregulated in KRAS-mutated PDAC cells and was involved in KRAS/phosphorylated (p)-signal transduction and activator of transcription 3 (STAT3) signaling, and the knockdown of HPS/FGL1 in SUIT-2 cells decreased cell proliferation through increasing G2/M cell cycle arrest and cyclin B1 expression. In addition, the knockdown of HPS/FGL1 in SUIT-2 cells significantly increased omega-3 polyunsaturated fatty acids (PUFAs) and EPA production but not docosahexaenoic acid (DHA). Moreover, EPA treatment in SUIT-2 cells reduced the expression of de novo lipogenic protein, acetyl coenzyme A carboxylase (ACC)-1, and decreased p-STAT3 and HPS/FGL1 expressions, resulting in the suppression of cell viability.
Conclusions: Results of this study indicate that HPS is highly expressed by KRAS-mutated PDAC cells, and HPS/FGL1 plays a crucial role in altering lipid metabolism and increasing cell growth in pancreatic cancer. EPA supplements could potentially inhibit or reduce ACC-1-involved lipogenesis and HPS/FGL1-mediated cell survival in KRAS-mutated pancreatic cancer cells.
Keywords: KRAS mutation; eicosapentaenoic acid; hepassocin; pancreatic cancer.
Conflict of interest statement
The authors declare no conflict of interest.
Figures
Similar articles
-
Docosahexaenoic acid inhibits the proliferation of Kras/TP53 double mutant pancreatic ductal adenocarcinoma cells through modulation of glutathione level and suppression of nucleotide synthesis.PLoS One. 2020 Nov 2;15(11):e0241186. doi: 10.1371/journal.pone.0241186. eCollection 2020. PLoS One. 2020. PMID: 33137095 Free PMC article.
-
Ribonucleoprotein HNRNPA2B1 interacts with and regulates oncogenic KRAS in pancreatic ductal adenocarcinoma cells.Gastroenterology. 2014 Oct;147(4):882-892.e8. doi: 10.1053/j.gastro.2014.06.041. Epub 2014 Jul 3. Gastroenterology. 2014. PMID: 24998203
-
Hyperglycemia enhances pancreatic cancer progression accompanied by elevations in phosphorylated STAT3 and MYC levels.PLoS One. 2020 Jul 1;15(7):e0235573. doi: 10.1371/journal.pone.0235573. eCollection 2020. PLoS One. 2020. PMID: 32609742 Free PMC article.
-
Targeting KRAS in pancreatic cancer: new drugs on the horizon.Cancer Metastasis Rev. 2021 Sep;40(3):819-835. doi: 10.1007/s10555-021-09990-2. Epub 2021 Sep 9. Cancer Metastasis Rev. 2021. PMID: 34499267 Free PMC article. Review.
-
Critical role of oncogenic KRAS in pancreatic cancer (Review).Mol Med Rep. 2016 Jun;13(6):4943-9. doi: 10.3892/mmr.2016.5196. Epub 2016 Apr 27. Mol Med Rep. 2016. PMID: 27121414 Review.
Cited by
-
Structure-based discovery and experimental validation of HIT101481851 as a potential PKMYT1 inhibitor for pancreatic cancer.Front Pharmacol. 2025 Jun 18;16:1605741. doi: 10.3389/fphar.2025.1605741. eCollection 2025. Front Pharmacol. 2025. PMID: 40606600 Free PMC article.
-
Fibrinogen-like protein 1 (FGL1): the next immune checkpoint target.J Hematol Oncol. 2021 Sep 15;14(1):147. doi: 10.1186/s13045-021-01161-8. J Hematol Oncol. 2021. PMID: 34526102 Free PMC article. Review.
-
KRAS mutation: The booster of pancreatic ductal adenocarcinoma transformation and progression.Front Cell Dev Biol. 2023 Apr 20;11:1147676. doi: 10.3389/fcell.2023.1147676. eCollection 2023. Front Cell Dev Biol. 2023. PMID: 37152291 Free PMC article. Review.
-
The Proliferative Role of Immune Checkpoints in Tumors: Double Regulation.Cancers (Basel). 2022 Oct 31;14(21):5374. doi: 10.3390/cancers14215374. Cancers (Basel). 2022. PMID: 36358792 Free PMC article. Review.
-
Crosstalk between FTH1 and PYCR1 dysregulates proline metabolism and mediates cell growth in KRAS-mutant pancreatic cancer cells.Exp Mol Med. 2024 Sep;56(9):2065-2081. doi: 10.1038/s12276-024-01300-4. Epub 2024 Sep 18. Exp Mol Med. 2024. PMID: 39294443 Free PMC article.
References
-
- Wang Y.-W., Health Promotion Administration , editor. 2019 Health Promotion Administration Annual Report. Health Promotion Administration; Taipei City, Taiwan: 2019.
Publication types
MeSH terms
Substances
Grants and funding
LinkOut - more resources
Full Text Sources
Other Literature Sources
Medical
Research Materials
Miscellaneous
