. 2021 Mar 2;13(3):184.
doi: 10.3390/toxins13030184.

Aflatoxin B1 and Aflatoxin M1 Induce Compromised Intestinal Integrity through Clathrin-Mediated Endocytosis

Affiliations

Aflatoxin B1 and Aflatoxin M1 Induce Compromised Intestinal Integrity through Clathrin-Mediated Endocytosis

Yanan Gao et al. Toxins (Basel). .

Abstract

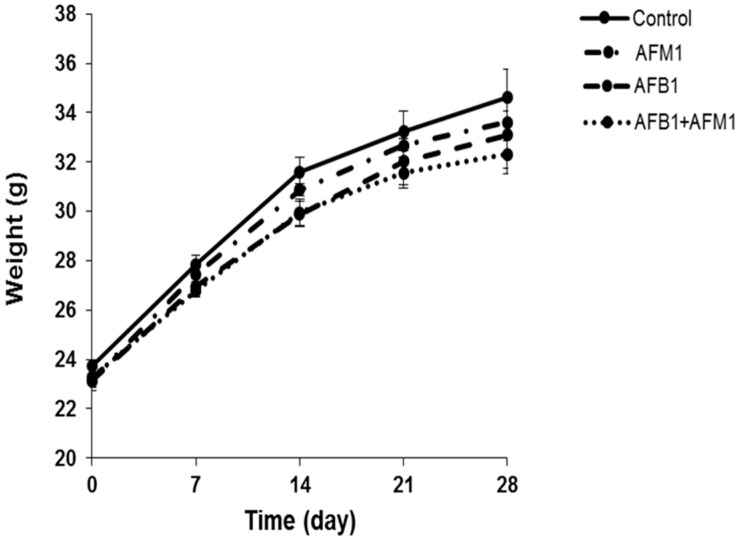
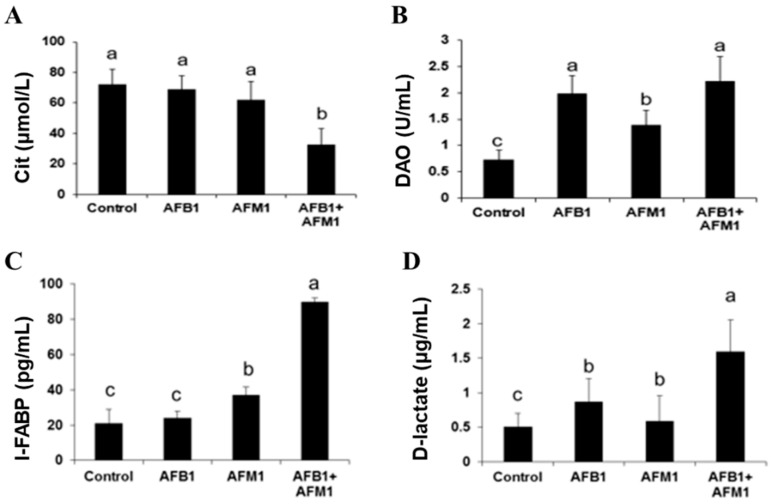
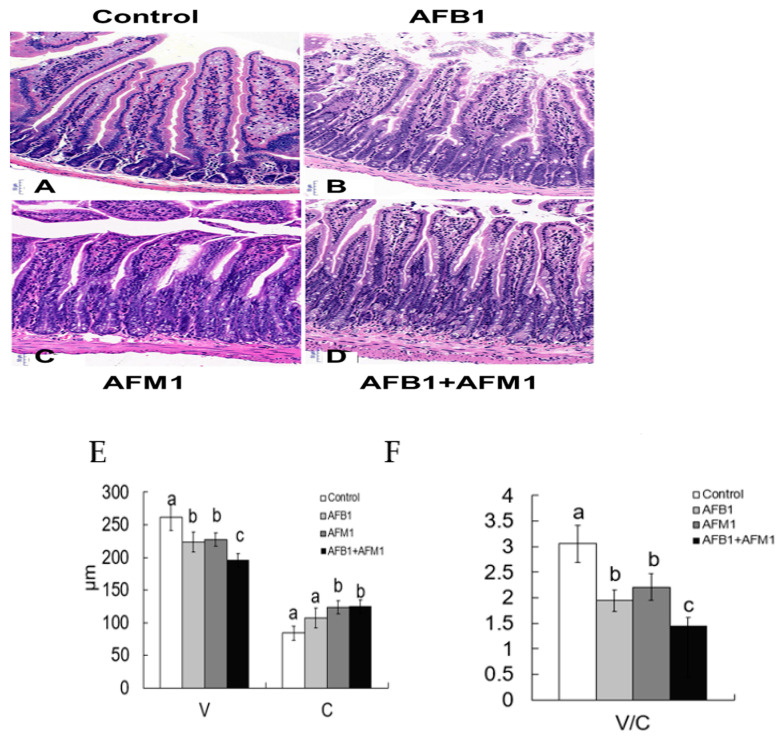
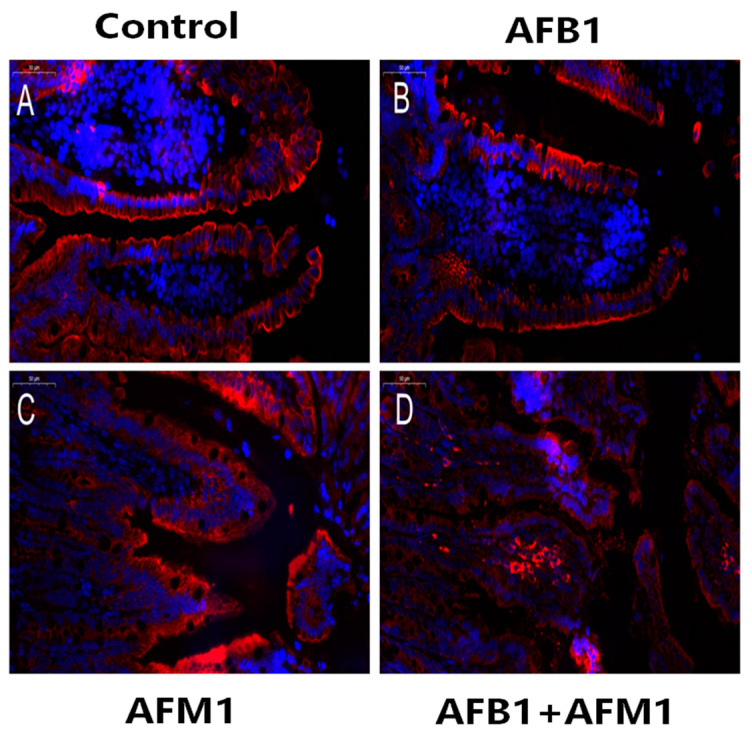
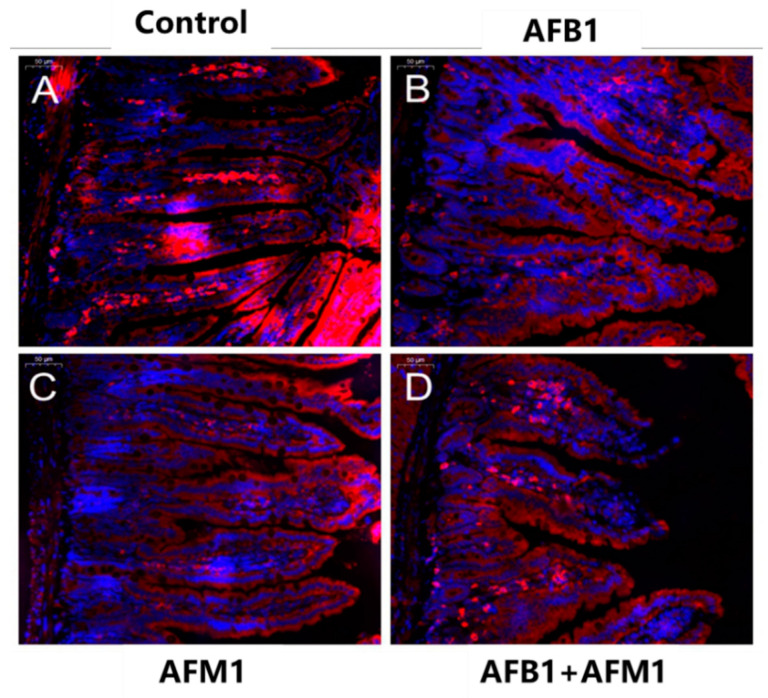
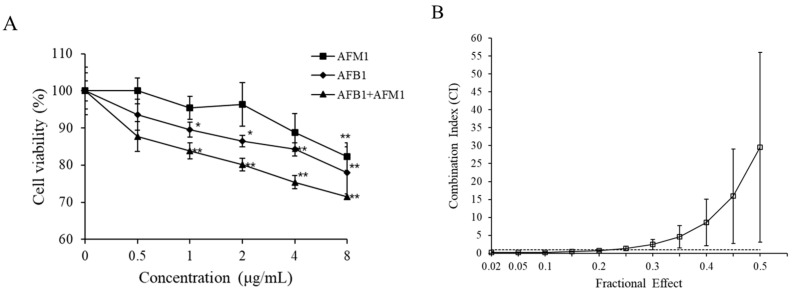
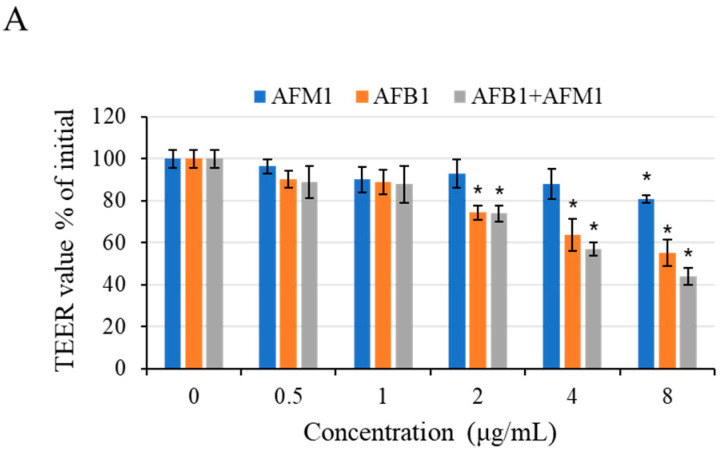
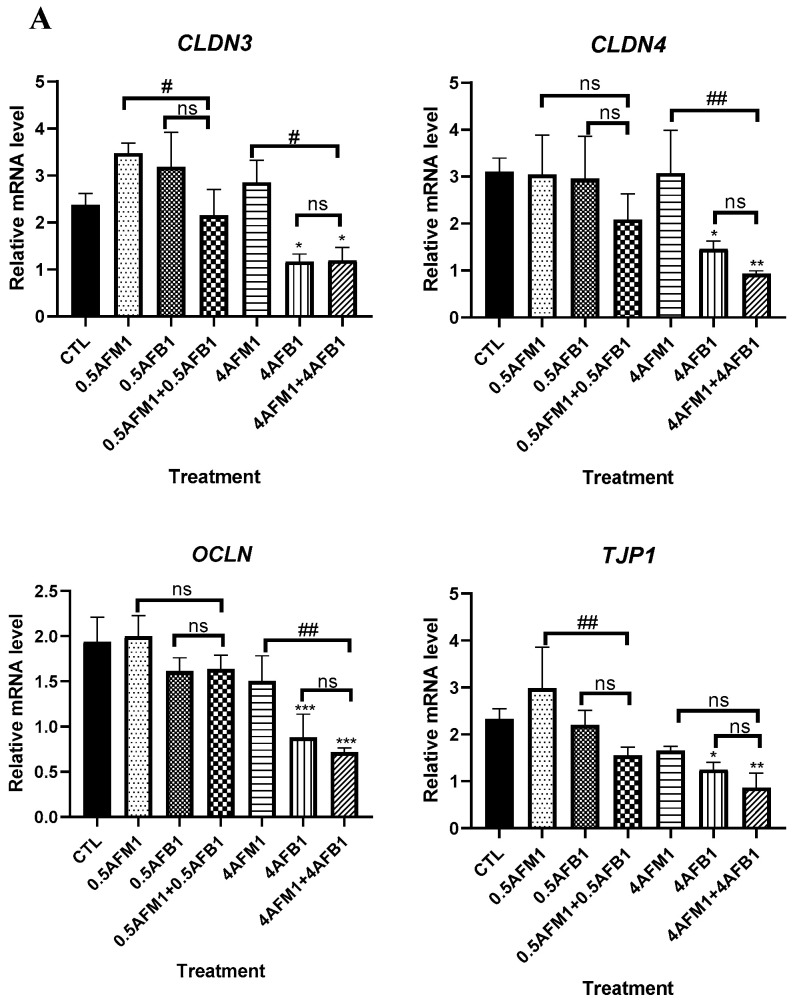
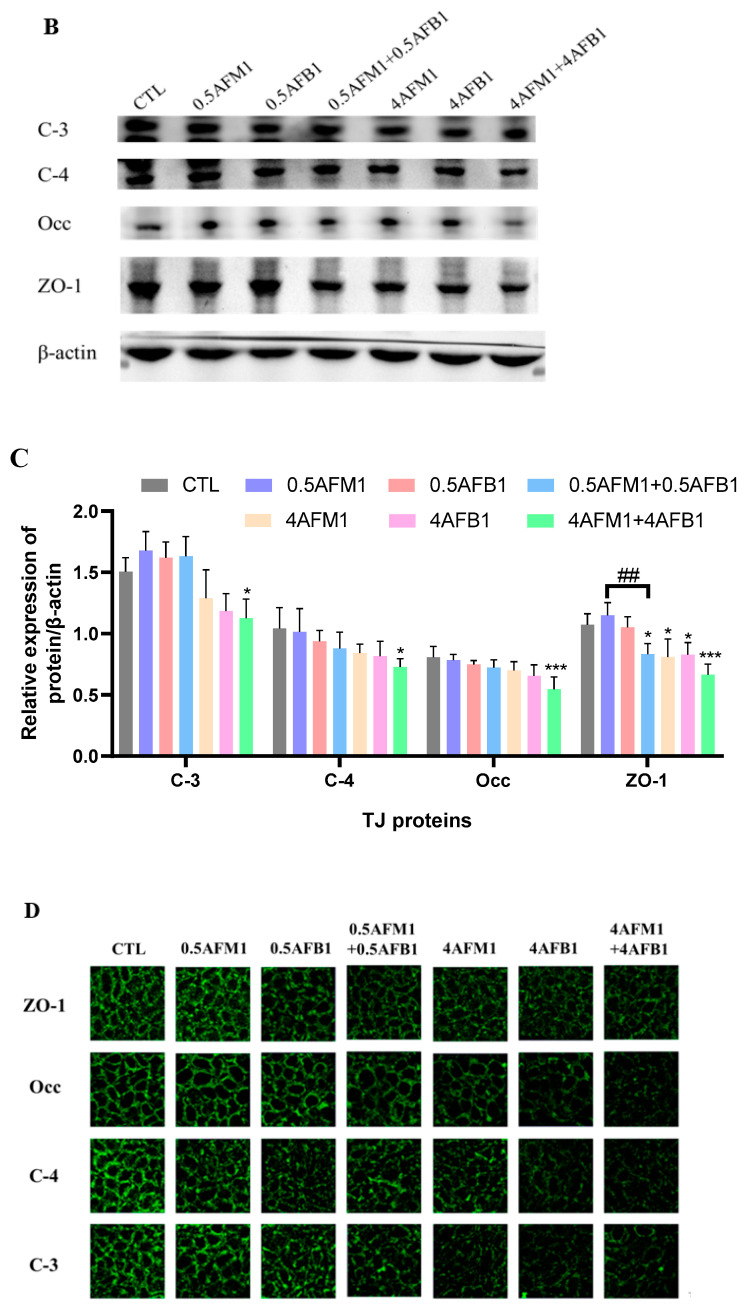
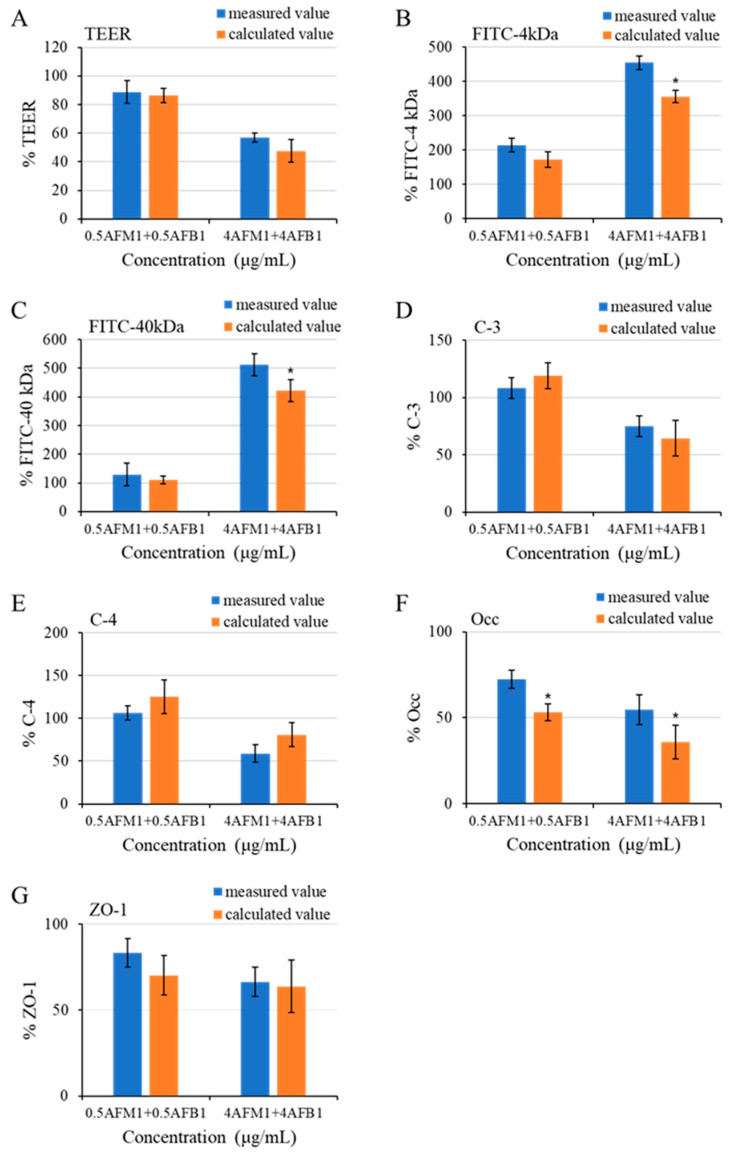
With the growing diversity and complexity of diet, humans are at risk of simultaneous exposure to aflatoxin B1 (AFB1) and aflatoxin M1 (AFM1), which are well-known contaminants in dairy and other agricultural products worldwide. The intestine represents the first barrier against external contaminants; however, evidence about the combined effect of AFB1 and AFM1 on intestinal integrity is lacking. In vivo, the serum biochemical parameters related to intestinal barrier function, ratio of villus height/crypt depth, and distribution pattern of claudin-1 and zonula occluden-1 were significantly affected in mice exposed to 0.3 mg/kg b.w. AFB1 and 3.0 mg/kg b.w. AFM1. In vitro results on differentiated Caco-2 cells showed that individual and combined AFB1 (0.5 and 4 μg/mL) and AFM1 (0.5 and 4 μg/mL) decreased cell viability and trans-epithelial electrical resistance values as well as increased paracellular permeability of fluorescein isothiocyanate-dextran in a dose-dependent manner. Furthermore, AFM1 aggravated AFB1-induced compromised intestinal barrier, as demonstrated by the down-regulation of tight junction proteins and their redistribution, particularly internalization. Adding the inhibitor chlorpromazine illustrated that clathrin-mediated endocytosis partially contributed to the compromised intestinal integrity. Synergistic and additive effects were the predominant interactions, suggesting that these toxins are likely to have negative effects on human health.

Keywords: aflatoxin B1; aflatoxin M1; endocytosis; intestinal epithelial barrier.


Conflict of interest statement

No potential competing interest was reported by the authors.

Figures

Figure 1
Figure 1
Individual and combined effects of aflatoxin B1 (AFB1) and aflatoxin M1 (AFM1) on body weight of mice. Male Institute of Cancer Research (ICR) mice were divided into four groups: control (1% dimethylsulfoxide, DMSO), exposed to individual AFB1 (0.3 mg/kg b.w.), individual AFM1 (3.0 mg/kg b.w.), and combined AFB1 and AFM1 (0.3 + 3.0 mg/kg b.w.). Values represent mean ± SD (n = 10 animals).
Figure 2
Figure 2
Individual and combined effects of AFB1 and AFM1 on serum citrulline (Cit) (A), diamine oxidase (DAO) (B), intestinal fatty acid-binding protein (I-FABP) (C), and D-lactate (D) levels in ICR mice. Values represent mean ± SD (n = 10 animals). Means with a different letter (a, b and c) differ significantly (p < 0.05).
Figure 3
Figure 3
Individual and combined effects of AFB1 and AFM1 on ileum histology. Histology of the ileum after hematoxylin-eosin staining (HE, 10×): control mice (1%DMSO, (A)), AFB1 treated mice (B), AFM1 treated mice (C), and AFB1+AFM1 treated mice (D), villus height and crypt depth (E), and the ratio of villus height/crypt depth (F). Values represent mean ± SD (n = 6 animals). Means with a different letter (a, b and c) differ significantly (p < 0.05).
Figure 4
Figure 4
Individual and combined effects of AFB1 and AFM1 on claudin-1 expression and distribution in the ileum measured by immunofluorescence staining (400×). The ileum of ICR mice in the control group (1% DMSO, (A)) exerted strong homogeneous staining on claudin-1 with a distinct latticed structure. Less intense immunostaining of claudin-1 with an unclear latticed structure occurred in AFB1-treated mice (B), AFM1-treated mice (C), and AFB1+AFM1-treated mice (D). n = 6 animals.
Figure 5
Figure 5
Individual and combined effects of AFB1 and AFM1 on ZO-1 expression and distribution in ileum measured by immunofluorescence staining (200×). Ileum of ICR mice in the control group (1% DMSO, (A)) exerted strong homogeneous staining on ZO-1 with a distinct latticed structure. Less intense immunostaining of ZO-1 with an unclear latticed structure occurred in AFB1-treated mice (B), AFM1-treated mice (C), and AFB1+AFM1-treated mice (D). n = 6 animals.
Figure 6
Figure 6
Cytotoxic effects of AFB1 and AFM1 on differentiated Caco-2 cells. The differentiated Caco-2 cells were exposed to individual and combined AFB1 and AFM1 for 48 h. Viability of Caco-2 cells was detected by CCK-8 kit (A). CI/fa curve based on isobologram analysis using CalcuSyn software (B). Data represent the mean of three independent experiments ± SD (n = 4). * p < 0.05, ** p < 0.01 represent significance, compared with the control group.
Figure 7
Figure 7
Intestinal permeability effects of AFB1 and AFM1 on differentiated Caco-2 cells. Cells were cultured with individual and combined AFB1 and AFM1 at concentrations of 0.5, 1, 2, 4, and 8 μg/mL for 48 h. Trans-epithelial electrical resistance (TEER) assay (A) and fluorescein isothiocyanate (FITC) paracellular permeability (B), (C) were determined. Data represent the mean of three independent experiments ± SD (n = 4). * p < 0.05, ** p < 0.01, *** p < 0.001 represent significance compared with the control group.
Figure 7
Figure 7
Intestinal permeability effects of AFB1 and AFM1 on differentiated Caco-2 cells. Cells were cultured with individual and combined AFB1 and AFM1 at concentrations of 0.5, 1, 2, 4, and 8 μg/mL for 48 h. Trans-epithelial electrical resistance (TEER) assay (A) and fluorescein isothiocyanate (FITC) paracellular permeability (B), (C) were determined. Data represent the mean of three independent experiments ± SD (n = 4). * p < 0.05, ** p < 0.01, *** p < 0.001 represent significance compared with the control group.
Figure 8
Figure 8
Effects of non-toxic AFM1 on AFB1-induced tight junction (TJ) destruction on differentiated Caco-2 cells. Cells were treated with AFB1 (0.5 and 4 μg/mL) and AFM1 (0.5 and 4 μg/mL) individually and collectively for 48 h. mRNA expression measured by quantitative real-time PCR (qRT-PCR) assay (A) and protein expression measured by western blot assay ((B,C)). The distribution of TJ proteins on differentiated Caco-2 cells was visualized (D). Reference gene GAPDH and protein β-actin were used as a control for qRT-PCR and western blot assay, respectively. The images shown are representative of at least 3 regions observed on the same slide, and 3 different sections were analyzed for each condition. Data represent the mean of three independent experiments ± SD (n = 4). * p < 0.05, ** p < 0.01, *** p < 0.001 represent significance compared to the control group. # p < 0.05, ## p < 0.01 represent significance compared with individual AFB1 or AFM1 treatments. ns represents p > 0.05 between two treatments.
Figure 8
Figure 8
Effects of non-toxic AFM1 on AFB1-induced tight junction (TJ) destruction on differentiated Caco-2 cells. Cells were treated with AFB1 (0.5 and 4 μg/mL) and AFM1 (0.5 and 4 μg/mL) individually and collectively for 48 h. mRNA expression measured by quantitative real-time PCR (qRT-PCR) assay (A) and protein expression measured by western blot assay ((B,C)). The distribution of TJ proteins on differentiated Caco-2 cells was visualized (D). Reference gene GAPDH and protein β-actin were used as a control for qRT-PCR and western blot assay, respectively. The images shown are representative of at least 3 regions observed on the same slide, and 3 different sections were analyzed for each condition. Data represent the mean of three independent experiments ± SD (n = 4). * p < 0.05, ** p < 0.01, *** p < 0.001 represent significance compared to the control group. # p < 0.05, ## p < 0.01 represent significance compared with individual AFB1 or AFM1 treatments. ns represents p > 0.05 between two treatments.
Figure 9
Figure 9
Potential mechanisms of the internalization of TJ proteins caused by AFB1 and AFM1 in differentiated Caco-2 cells. Lactate dehydrogenase (LDH) leakage (A) from cells into the culture medium was measured to evaluate the damage of the plasma membrane. TEER values (B) were measured, and the distribution of TJ proteins (C) was assessed after preincubation with 60 μM CP for 60 min, followed by toxins treatment for 48 h. Data represent the mean of three independent experiments ± SD. * p < 0.05, ** p < 0.01, *** p < 0.001 represent significance compared with the control group. # p < 0.05 represents significance compared with individual AFB1 or AFM1 treatments.
Figure 10
Figure 10
Correlation analysis for TEER values, FITC-dextran, and expression of TJ proteins. A heat map was generated with the measured data and was shown as a ladder diagram. As the color key shows, the colors blue, yellow, and red represent a negative correlation, a low correlation, and a positive correlation, respectively. Spearman’s correlations were used to analyze the statistical significance. * p < 0.05, ** p < 0.01.
Figure 11
Figure 11
Interactive effects of combinations of AFB1 and AFM1 on differentiated Caco-2 cells on various measured endpoints (AG). The calculated value represents expected values, and the calculation method is shown in the material method section. Data for measured parameters are expressed in % relative to the control group. * p < 0.05 representing either significant synergistic or antagonist effect.

Similar articles

Cited by

References

    1. Bhat R., Reddy K.R. Challenges and issues concerning mycotoxins contamination in oil seeds and their edible oils: Updates from last decade. Food Chem. 2017;215:425–437. doi: 10.1016/j.foodchem.2016.07.161. - DOI - PubMed
    1. Eskola M., Kos G., Elliott C.T., Hajslova J., Mayar S., Krska R. Worldwide contamination of food-crops with mycotoxins: Validity of the widely cited ‘FAO estimate’ of 25. Crit. Rev. Food Sci. Nutr. 2020;60:2773–2789. doi: 10.1080/10408398.2019.1658570. - DOI - PubMed
    1. Ferri F., Brera C., De Santis B., Fedrizzi G., Bacci T., Bedogni L., Capanni S., Collini G., Crespi E., Debegnach F., et al. Survey on Urinary Levels of Aflatoxins in Professionally Exposed Workers. Toxins. 2017;9:117. doi: 10.3390/toxins9040117. - DOI - PMC - PubMed
    1. Fromme H., Gareis M., Volkel W., Gottschalk C. Overall internal exposure to mycotoxins and their occurrence in occupational and residential settings—An overview. Int. J. Hyg. Environ. Health. 2016;219:143–165. doi: 10.1016/j.ijheh.2015.11.004. - DOI - PubMed
    1. Medina Á., Rodríguez A., Magan N. Climate change and mycotoxigenic fungi: Impacts on mycotoxin production. Curr. Opin. Food Sci. 2015;5:99–104. doi: 10.1016/j.cofs.2015.11.002. - DOI

Publication types

MeSH terms

LinkOut - more resources