. 2021 Mar 2;10(5):1009.
doi: 10.3390/jcm10051009.

Peri-Implant Bone Loss Measurement Using a Region-Based Convolutional Neural Network on Dental Periapical Radiographs

Affiliations

Peri-Implant Bone Loss Measurement Using a Region-Based Convolutional Neural Network on Dental Periapical Radiographs

Jun-Young Cha et al. J Clin Med. .

Abstract

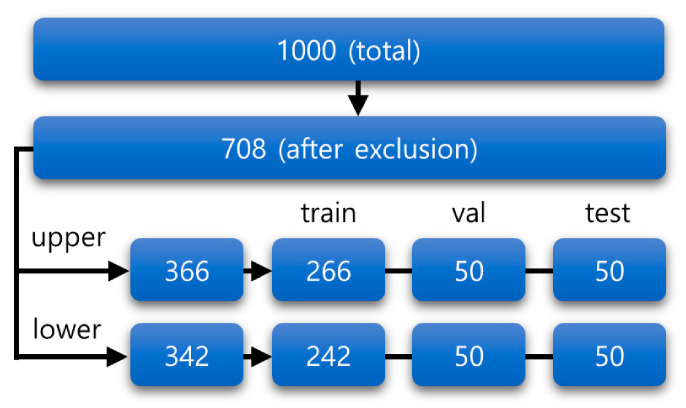
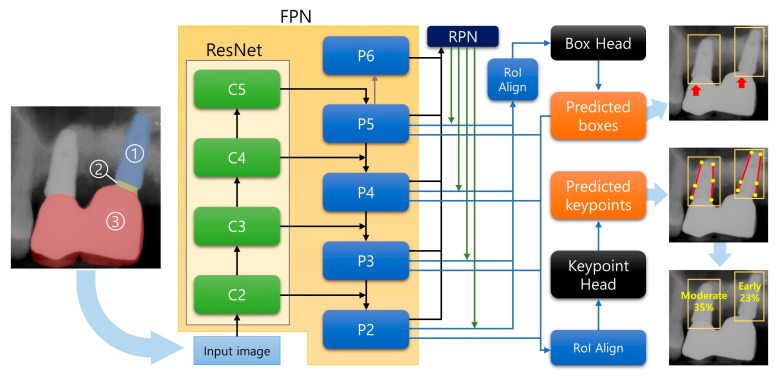
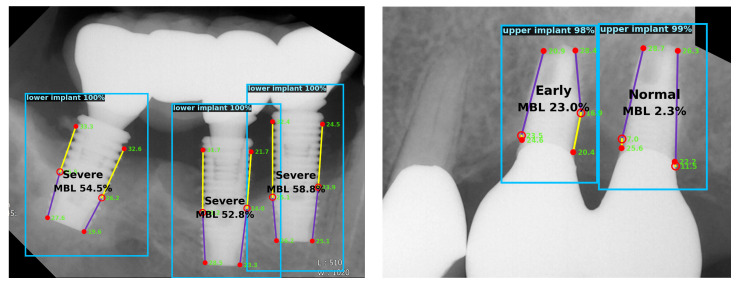
Determining the peri-implant marginal bone level on radiographs is challenging because the boundaries of the bones around implants are often unclear or the heights of the buccal and lingual bone levels are different. Therefore, a deep convolutional neural network (CNN) was evaluated for detecting the marginal bone level, top, and apex of implants on dental periapical radiographs. An automated assistant system was proposed for calculating the bone loss percentage and classifying the bone resorption severity. A modified region-based CNN (R-CNN) was trained using transfer learning based on Microsoft Common Objects in Context dataset. Overall, 708 periapical radiographic images were divided into training (n = 508), validation (n = 100), and test (n = 100) datasets. The training dataset was randomly enriched by data augmentation. For evaluation, average precision, average recall, and mean object keypoint similarity (OKS) were calculated, and the mean OKS values of the model and a dental clinician were compared. Using detected keypoints, radiographic bone loss was measured and classified. No statistically significant difference was found between the modified R-CNN model and dental clinician for detecting landmarks around dental implants. The modified R-CNN model can be utilized to measure the radiographic peri-implant bone loss ratio to assess the severity of peri-implantitis.

Keywords: artificial intelligence; convolutional neural network; deep learning; keypoint detection; machine learning; peri-implant bone level; peri-implantitis; radiographs.


Conflict of interest statement

The authors declare no conflict of interest.

Figures

Figure 1
Figure 1
Overview of the datasets. After excluding the data with the exclusion criteria, remaining data were separated into train, validation, and test datasets. The train dataset was used for training the model, and the validation dataset was used for assessing the overfitting. The test dataset was used for evaluation. Each digit represents the number of periapical radiographs. The upper and lower periapical radiographs are shown separately.
Figure 2
Figure 2
Architecture of the model used in this study. The region proposal network (RPN) takes feature maps from the feature pyramid network (FPN) and proposes region of interest (RoI). The box head further refines the proposals and predicts final bounding boxes (red arrows). In addition, the keypoint head localizes the keypoints (yellow dots shown in the middle of the radiographs on the right) based on the predicted bounding boxes. C2-5 and P2-6 denotes the output feature maps of residual network (ResNet) and FPN, respectively. The upper and lower classification phase is not shown for brevity. Implant (①), Abutment (②) and Superstructure (③) are shown in the left radiograph. Abbreviations: FPN, Feature Pyramid Network; ResNet, Residual Network; RPN, Region Proposal Network; RoI, Region of Interest.
Figure 3
Figure 3
Examples of the keypoint heat maps. The likelihood of each pixel of being a keypoint is mapped into the heat map. Heat maps that combine all keypoints are superimposed on the original radiograph, and individual heat maps for each corresponding keypoint are shown.
Figure 4
Figure 4
Precision–Recall graph for various object keypoint similarity (OKS) thresholds. Each colored graph represents each OKS threshold, and each point in the graph corresponds to a specific confidence score threshold of the model. Left: result of the upper images. Right: result of the lower images.
Figure 5
Figure 5
Examples of the predicted results. Each implant is detected with a bounding box and predicted keypoints are shown within the box. Radiographic bone loss ratio is calculated based on the keypoint locations. Confidence scores of the implant and keypoint detection are also shown.

Similar articles

Cited by

References

    1. De Bruyn H., Vandeweghe S., Ruyffelaert C., Cosyn J., Sennerby L. Radiographic evaluation of modern oral implants with emphasis on crestal bone level and relevance to peri-implant health. Periodontol 2000. 2013;62:256–270. doi: 10.1111/prd.12004. - DOI - PubMed
    1. Lofthag-Hansen S., Huumonen S., Grondahl K., Grondahl H.G. Limited cone-beam CT and intraoral radiography for the diagnosis of periapical pathology. Oral Surg. Oral Med. Oral Pathol. Oral Radiol. Endodontol. 2007;103:114–119. doi: 10.1016/j.tripleo.2006.01.001. - DOI - PubMed
    1. Krizhevsky A., Sutskever I., Hinton G.E. ImageNet classification with deep convolutional neural networks; Proceedings of the 25th International Conference on Neural Information Processing Systems; Lake Tahoe, SN, USA. 3–6 December 2012; pp. 1097–1105.
    1. Russakovsky O., Deng J., Su H., Krause J., Satheesh S., Ma S., Huang Z., Karpathy A., Khosla A., Bernstein M. Imagenet large scale visual recognition challenge. Int. J. Comput. Vis. 2015;115:211–252. doi: 10.1007/s11263-015-0816-y. - DOI
    1. Lakhani P., Sundaram B. Deep Learning at Chest Radiography: Automated Classification of Pulmonary Tuberculosis by Using Convolutional Neural Networks. Radiology. 2017;284:574–582. doi: 10.1148/radiol.2017162326. - DOI - PubMed

LinkOut - more resources