

Pulsed-Focused Ultrasound Slows B16 Melanoma and 4T1 Breast Tumor Growth through Differential Tumor Microenvironmental Changes
- PMID: 33801627
- PMCID: PMC8036693
- DOI: 10.3390/cancers13071546
Pulsed-Focused Ultrasound Slows B16 Melanoma and 4T1 Breast Tumor Growth through Differential Tumor Microenvironmental Changes
Abstract
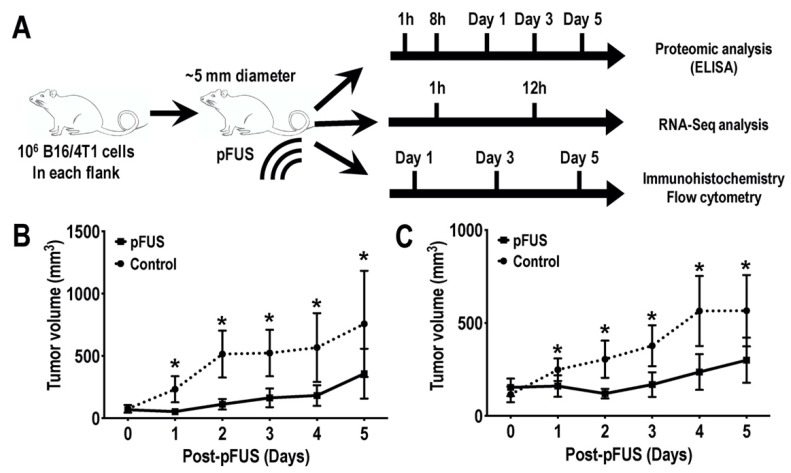
Focused ultrasound (FUS) has shown promise as a non-invasive treatment modality for solid malignancies. FUS targeting to tumors has been shown to initiate pro-inflammatory immune responses within the tumor microenvironment. Pulsed FUS (pFUS) can alter the expression of cytokines, chemokines, trophic factors, cell adhesion molecules, and immune cell phenotypes within tissues. Here, we investigated the molecular and immune cell effects of pFUS on murine B16 melanoma and 4T1 breast cancer flank tumors. Temporal changes following sonication were evaluated by proteomics, RNA-seq, flow-cytometry, and histological analyses. Proteomic profiling revealed molecular changes occurring over 24 h post-pFUS that were consistent with a shift toward inflamed tumor microenvironment. Over 5 days post-pFUS, tumor growth rates were significantly decreased while flow cytometric analysis revealed differences in the temporal migration of immune cells. Transcriptomic analyses following sonication identified differences in gene expression patterns between the two tumor types. Histological analyses further demonstrated reduction of proliferation marker, Ki-67 in 4T1, but not in B16 tumors, and activated cleaved-caspase 3 for apoptosis remained elevated up to 3 days post-pFUS in both tumor types. This study revealed diverse biological mechanisms following pFUS treatment and supports its use as a possible adjuvant to ablative tumor treatment to elicit enhanced anti-tumor responses and slow tumor growth.
Keywords: 4T1 breast cancer; B16 melanoma; focused ultrasound; immune response; tumor microenvironment.
Conflict of interest statement
The authors declare no conflict of interest.
Figures


Similar articles
-
The Impact of Focused Ultrasound in Two Tumor Models: Temporal Alterations in the Natural History on Tumor Microenvironment and Immune Cell Response.Cancers (Basel). 2020 Feb 4;12(2):350. doi: 10.3390/cancers12020350. Cancers (Basel). 2020. PMID: 32033171 Free PMC article.
-
The Proteomic Effects of Pulsed Focused Ultrasound on Tumor Microenvironments of Murine Melanoma and Breast Cancer Models.Ultrasound Med Biol. 2019 Dec;45(12):3232-3245. doi: 10.1016/j.ultrasmedbio.2019.08.014. Epub 2019 Sep 14. Ultrasound Med Biol. 2019. PMID: 31530419 Free PMC article.
-
Cytosolic Ca2+ transients during pulsed focused ultrasound generate reactive oxygen species and cause DNA damage in tumor cells.Theranostics. 2021 Jan 1;11(2):602-613. doi: 10.7150/thno.48353. eCollection 2021. Theranostics. 2021. PMID: 33391495 Free PMC article.
-
Molecular and histological effects of MR-guided pulsed focused ultrasound to the rat heart.J Transl Med. 2017 Dec 13;15(1):252. doi: 10.1186/s12967-017-1361-y. J Transl Med. 2017. PMID: 29237455 Free PMC article.
-
Pulsing of dendritic cells with cell lysates from either B16 melanoma or MCA-106 fibrosarcoma yields equally effective vaccines against B16 tumors in mice.J Surg Oncol. 1998 Jun;68(2):79-91. doi: 10.1002/(sici)1096-9098(199806)68:2<79::aid-jso3>3.0.co;2-h. J Surg Oncol. 1998. PMID: 9624036 Review.
Cited by
-
ATP released by ultrasound targeted microbubble cavitation induces vascular inflammation and improves immune checkpoint blockade efficacy.Theranostics. 2025 Apr 11;15(11):5220-5237. doi: 10.7150/thno.105857. eCollection 2025. Theranostics. 2025. PMID: 40303330 Free PMC article.
-
Latest Advances in the Use of Therapeutic Focused Ultrasound in the Treatment of Pancreatic Cancer.Cancers (Basel). 2022 Jan 27;14(3):638. doi: 10.3390/cancers14030638. Cancers (Basel). 2022. PMID: 35158903 Free PMC article. Review.
-
Pulsed focused ultrasound alters the proteomic profile of the tumor microenvironment in a syngeneic mouse model of glioblastoma.J Neurooncol. 2024 Nov;170(2):347-361. doi: 10.1007/s11060-024-04801-4. Epub 2024 Aug 24. J Neurooncol. 2024. PMID: 39180641 Free PMC article.
-
Natural Products Induce Different Anti-Tumor Immune Responses in Murine Models of 4T1 Mammary Carcinoma and B16-F10 Melanoma.Int J Mol Sci. 2023 Nov 24;24(23):16698. doi: 10.3390/ijms242316698. Int J Mol Sci. 2023. PMID: 38069022 Free PMC article.
-
Synergies between therapeutic ultrasound, gene therapy and immunotherapy in cancer treatment.Adv Drug Deliv Rev. 2021 Nov;178:113906. doi: 10.1016/j.addr.2021.113906. Epub 2021 Jul 30. Adv Drug Deliv Rev. 2021. PMID: 34333075 Free PMC article. Review.
References
-
- Binnewies M., Roberts E.W., Kersten K., Chan V., Fearon D.F., Merad M., Coussens L.M., Gabrilovich D.I., Ostrand-Rosenberg S., Hedrick C.C., et al. Understanding the tumor immune microenvironment (TIME) for effective therapy. Nat. Med. 2018;24:541–550. doi: 10.1038/s41591-018-0014-x. - DOI - PMC - PubMed
Grants and funding
LinkOut - more resources
Full Text Sources
Other Literature Sources
Research Materials
