. 2021 Mar 27;13(7):1548.
doi: 10.3390/cancers13071548.

Overexpression of Human Syndecan-1 Protects against the Diethylnitrosamine-Induced Hepatocarcinogenesis in Mice

Affiliations

Overexpression of Human Syndecan-1 Protects against the Diethylnitrosamine-Induced Hepatocarcinogenesis in Mice

Andrea Reszegi et al. Cancers (Basel). .

Abstract

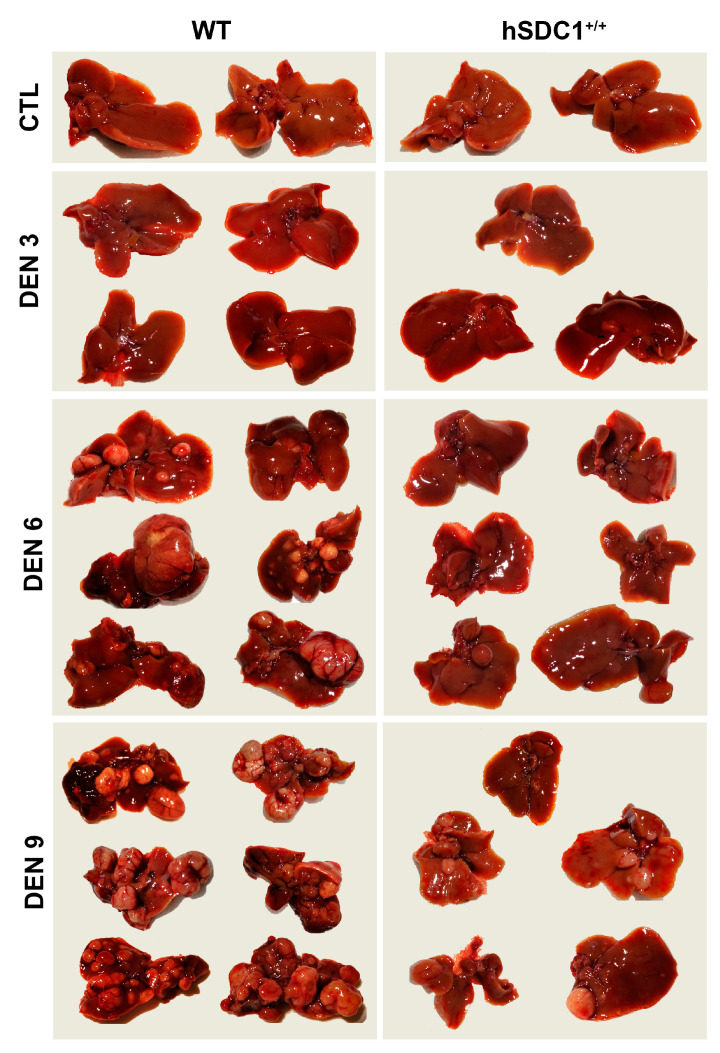
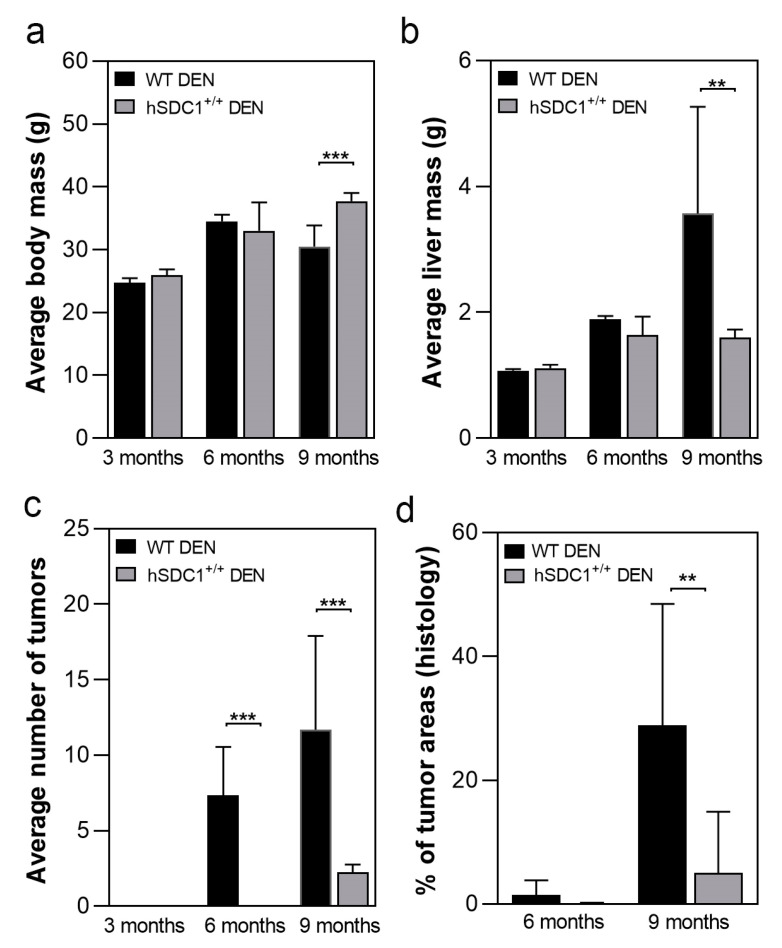
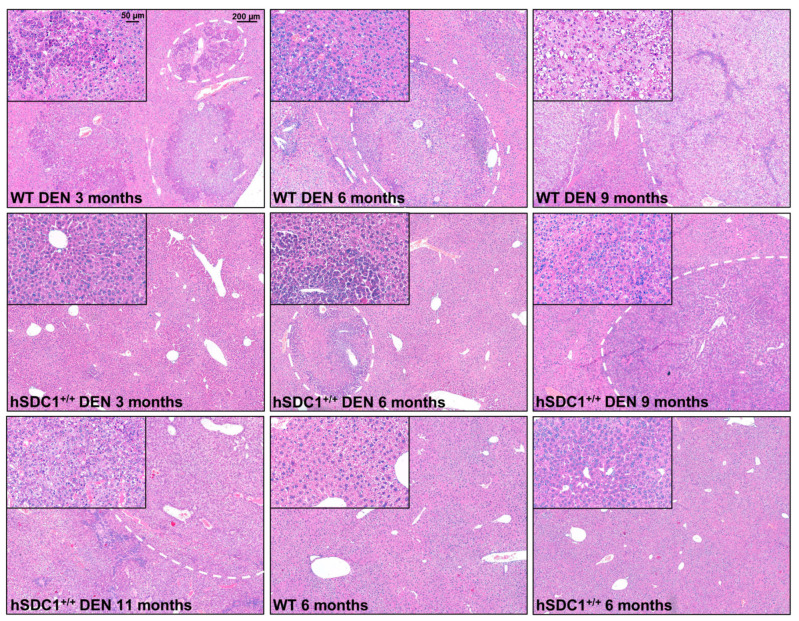
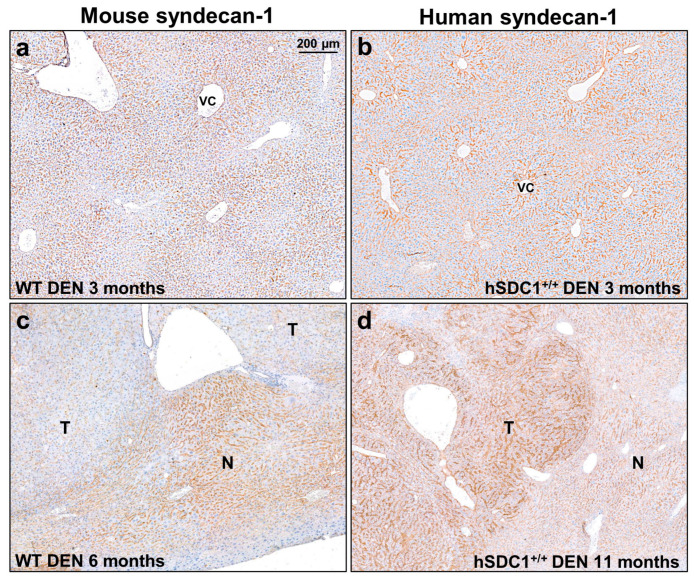
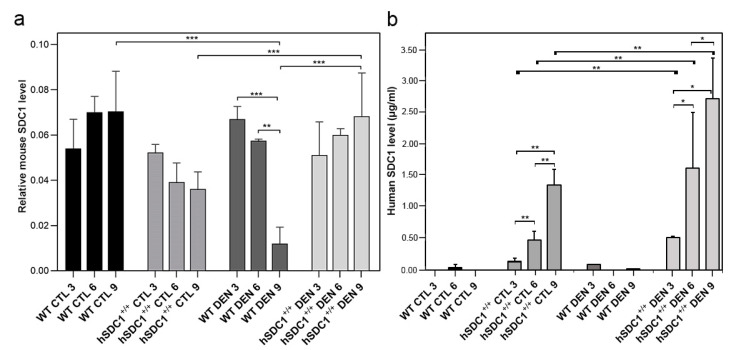
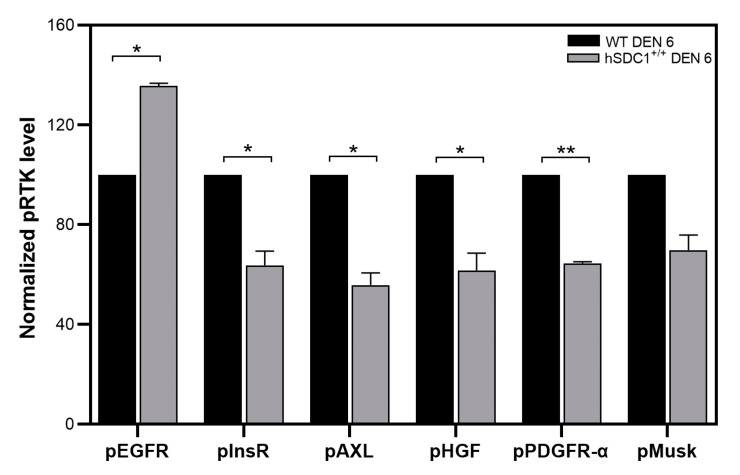
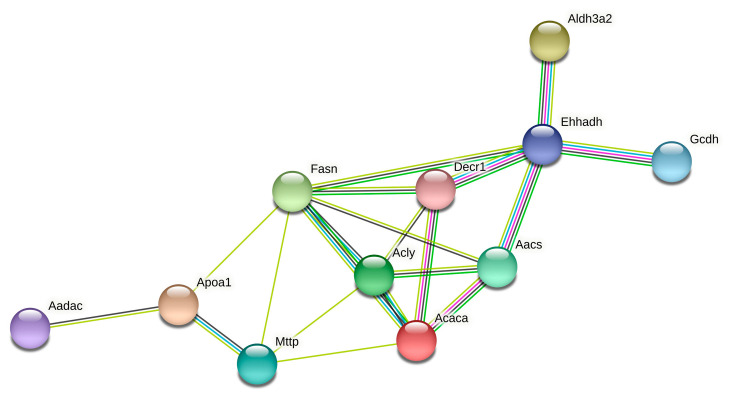
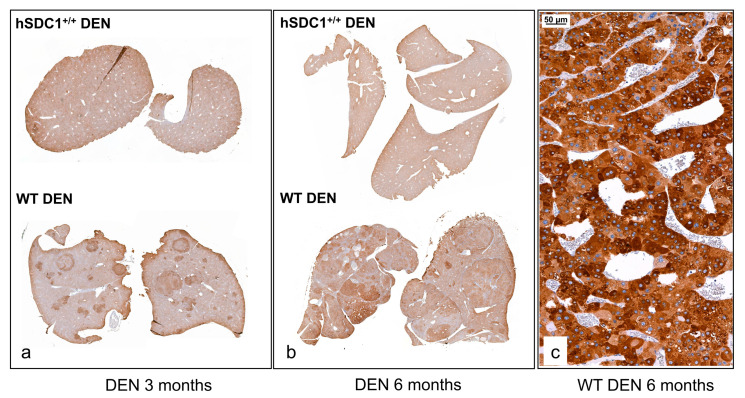
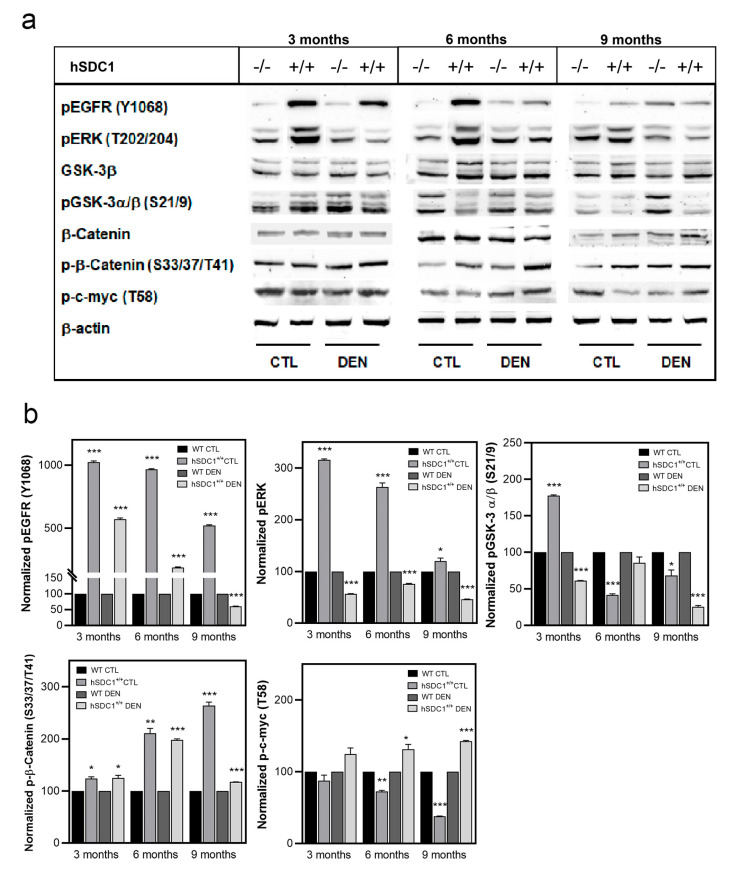
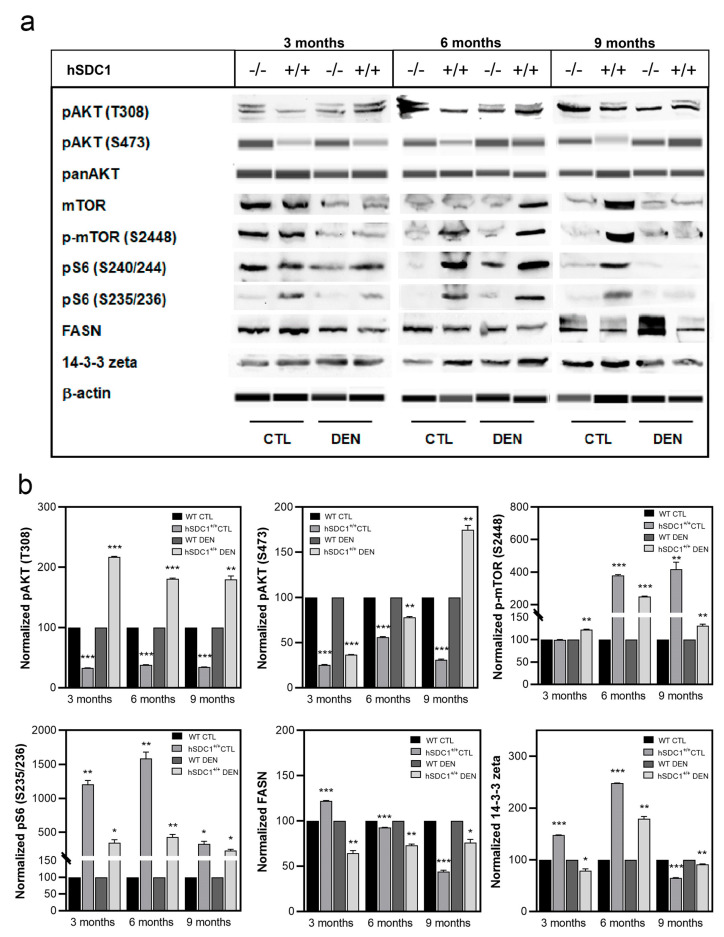
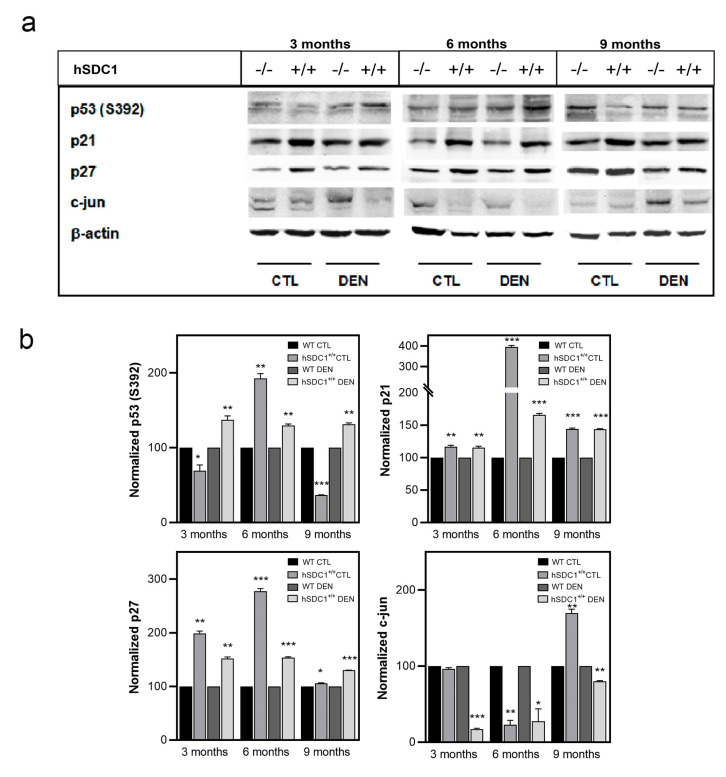
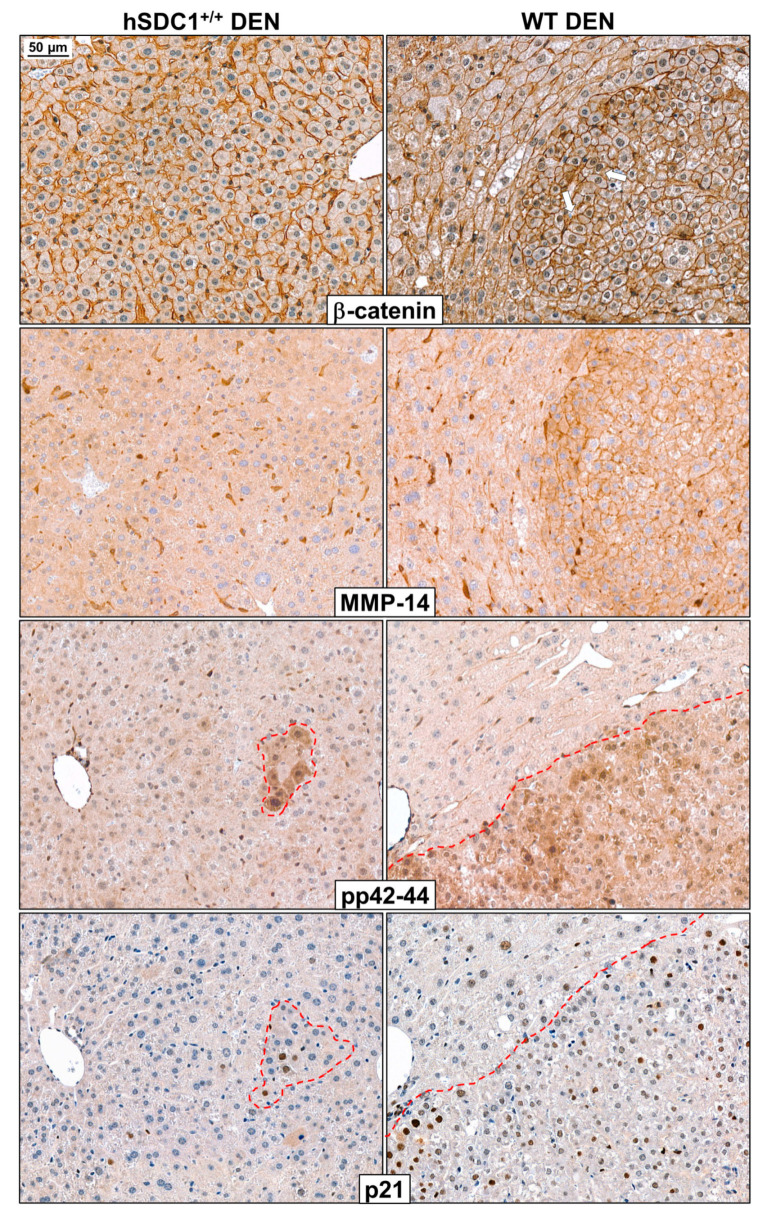
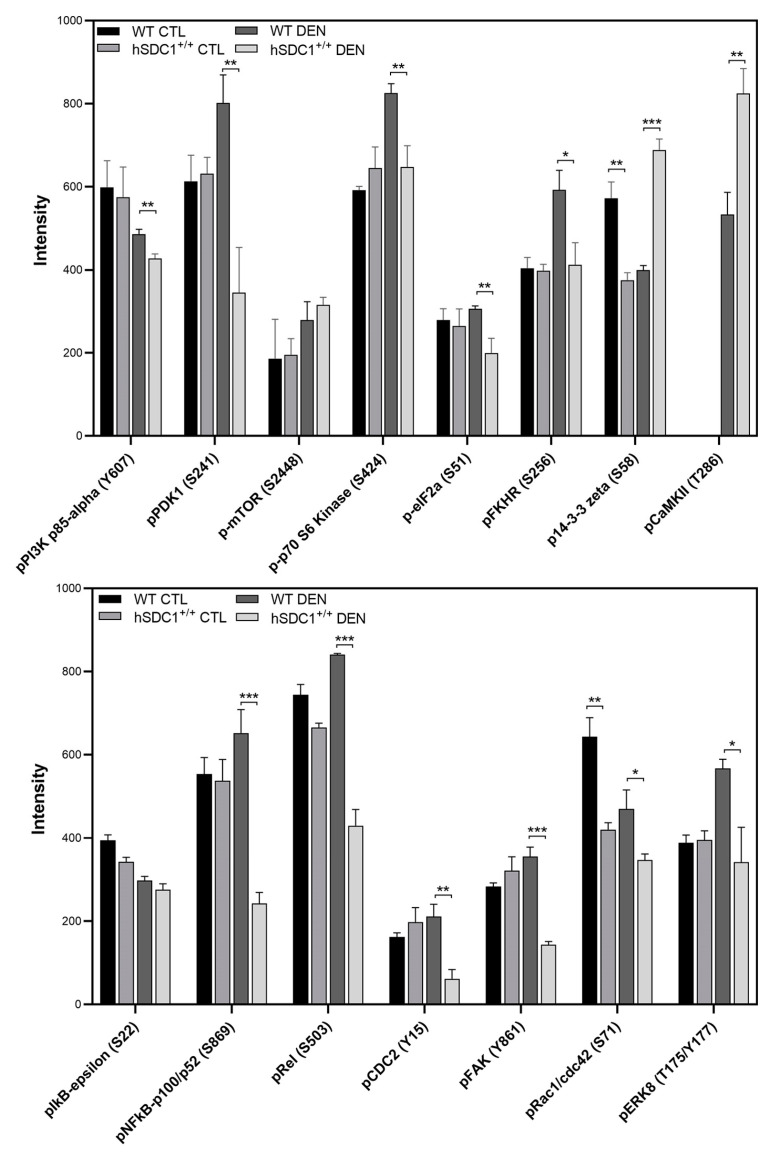
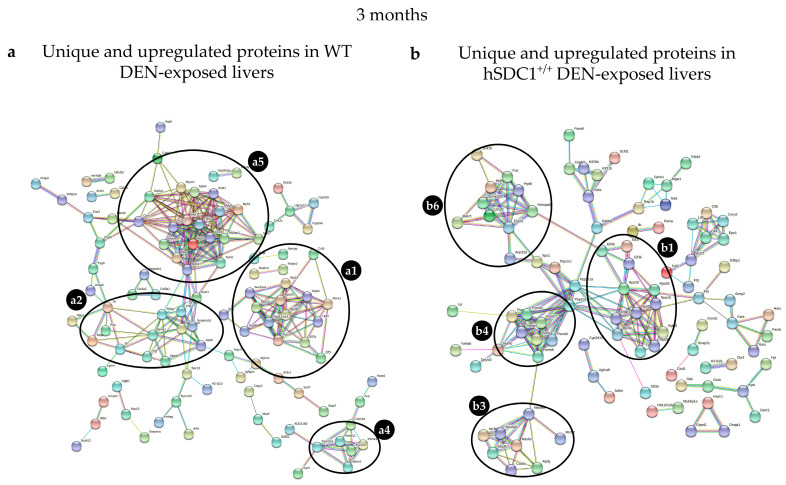
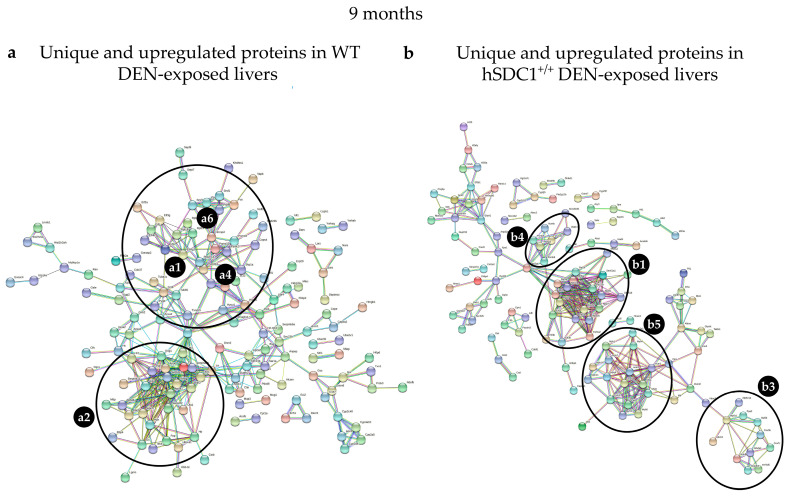
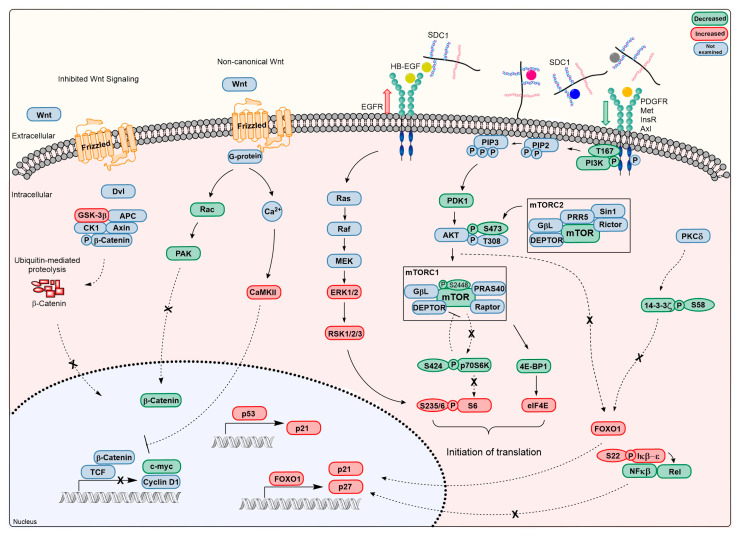
Although syndecan-1 (SDC1) is known to be dysregulated in various cancer types, its implication in tumorigenesis is poorly understood. Its effect may be detrimental or protective depending on the type of cancer. Our previous data suggest that SDC1 is protective against hepatocarcinogenesis. To further verify this notion, human SDC1 transgenic (hSDC1+/+) mice were generated that expressed hSDC1 specifically in the liver under the control of the albumin promoter. Hepatocarcinogenesis was induced by a single dose of diethylnitrosamine (DEN) at an age of 15 days after birth, which resulted in tumors without cirrhosis in wild-type and hSDC1+/+ mice. At the experimental endpoint, livers were examined macroscopically and histologically, as well as by immunohistochemistry, Western blot, receptor tyrosine kinase array, phosphoprotein array, and proteomic analysis. Liver-specific overexpression of hSDC1 resulted in an approximately six month delay in tumor formation via the promotion of SDC1 shedding, downregulation of lipid metabolism, inhibition of the mTOR and the β-catenin pathways, and activation of the Foxo1 and p53 transcription factors that lead to the upregulation of the cell cycle inhibitors p21 and p27. Furthermore, both of them are implicated in the regulation of intermediary metabolism. Proteomic analysis showed enhanced lipid metabolism, activation of motor proteins, and loss of mitochondrial electron transport proteins as promoters of cancer in wild-type tumors, inhibited in the hSDC1+/+ livers. These complex mechanisms mimic the characteristics of nonalcoholic steatohepatitis (NASH) induced human liver cancer successfully delayed by syndecan-1.

Keywords: lipid metabolism; liver carcinogenesis; mouse; syndecan-1.


Conflict of interest statement

The author (L.S.) is the founder of Szilak Laboratories Bioinformatics and Molecule-Design Ltd. This founder provided the syndecan-1 constructs taking part in the design of the study. The author (P.T.) is employed by Solvo Biotechnology. The funder (Solvo Biotechnology) provided support in the form of author’s salaries for the author (P.T.), but did not have any additional role in the design of the study; in the collection, analyses, or interpretation of data; in the writing of the manuscript, or in the decision to publish the results. The remaining authors declare no conflict of interest.

Figures

Figure 1
Figure 1
The homozygous presence of hSDC1 DNA by PCR from the tails of 12 C57 Black offspring. -CTL: non-template control; +CTL: parental transgenic animal.
Figure 2
Figure 2
Diethylnitrosamine (DEN)-induced cancer development is delayed in hSDC1+/+ livers. Wild-type (WT) livers displayed several tumor nodules six months after DEN exposure, whereas only a single preneoplastic nodule was detected in one of the hSDC1+/+ livers. At 9 months, the livers of WT animals were largely occupied by cancer nodules and they started to die at this time. A comparable number of cancer nodules developed in hSDC1+/+ livers only by 11 months.
Figure 3
Figure 3
Macroscopic and histologic outcomes of DEN-induced carcinogenesis in WT and hSDC1+/+ mice. (a) Comparison of body mass of WT and hSDC1+/+ mice showed a difference only at 9 months, indicating weight loss of WT mice due to tumorous wasting. (b) At 9 months, significantly increased liver mass was measured in WT livers compared to hSDC1+/+, reflecting a large number of cancer nodules. (c) No macroscopically visible cancer was found in hSDC1+/+ livers at 6 months. At 9 months, hSDC1 livers contained, on average, 3–4-fold fewer tumor nodules compared to WT. (d) Histological examination revealed a few small tumor nodules at 6 months in hSDC1+/+ livers. The area occupied by tumors increased to 30% in WT but only 10% in hSDC1+/+ by month 9. Data points represent the mean ± standard deviation (SD), n of hSDC1+/+ DEN = 22, n of WT DEN = 14, ** p < 0.01; *** p < 0.001.
Figure 4
Figure 4
Liver histology of WT and hSDC1+/+ mice. The first row demonstrates cancer progression in WT DEN-treated livers. Preneoplastic foci already appeared at month 3, and their number increased by month 6 along with the emergence of overtly cancerous nodules. At month 9, WT livers were almost completely obliterated by cancer. The second row shows hSDC1+/+ livers at the same time points. No foci were seen at month 3. The first foci appeared at month 6; these grew further by month 9, and a few small neoplastic nodules developed. The left panel in the third row shows a representative DEN-treated hSDC1+/+ liver at month 11 with a high number of cancer nodules. Both WT and hSDC1+/+ were similar in histology with round-shaped polymorphic nuclei, clear cytoplasm, and frequent cell divisions. Untreated WT and hSDC1+/+ livers were essentially indistinguishable by histology. No sign of liver fibrosis or cirrhosis was detected. Representative images are at 50× (main pictures) and 200× (insets) magnification with scale bars of 200 μm and 50 μm, respectively. Representative scale bars are inserted into the first pictures.
Figure 5
Figure 5
The immunolocalization of mouse and human syndecan-1 in WT and hSDC1+/+ livers. (a,b) Three months following DEN exposure, mouse syndecan-1 (mSDC1) as well as hSDC1 were concentrated around the central veins, with decreasing intensity toward the portal area. hSDC1 was more abundantly expressed compared to endogenous mSDC1. (c) At month 6, the expression of mSdc1 decreased in the tumorous areas compared to the normal parenchyma, in contrast with the hSDC1+/+ livers (d) where cancer nodules (shown at month 11) displayed upregulation of hSCD1. Representative images are at 50× magnification; scale bar: 200 μm. T, tumorous area; N, normal tissue; VC, vena centralis.
Figure 6
Figure 6
Shedding of mSDC1 and hSDC1 in control and DEN-exposed livers of WT vs. hSDC1+/+ mice. (a) The amount of mSDC1 released from WT control livers remained largely stable throughout the experimental period. Following DEN exposure, the shedding of mSDC1 became significantly downregulated in WT livers by month 9. In untreated hSDC1+/+ mice, the amount of shed mSDC1 and hSDC1 changed in opposite directions. In control mice, (a) shedding of mSDC1 decreased, (b) whereas shedding of hSDC1 increased. Shedding of both mSDC1 and hSDC1 increased over time in DEN-exposed hSDC1+/+ mice. Bars show mean ± SD, n = 3; * p < 0.05; ** p < 0.01; *** p < 0.001.
Figure 7
Figure 7
Receptor tyrosine kinase activation in WT and hSDC1+/+ livers 6 months after DEN exposure. Except for pMusk, significant inhibition of all receptors was detected in hSDC1+/+ livers. Heparan sulfate (HS) binding epidermal growth factor (EGF) establishes heterodimer with shed hSDC1 binding together to EGFR and facilitate the activation of the receptor. Data points represent the mean ± SD, n = 3; * p < 0.05; ** p < 0.01.
Figure 8
Figure 8
Connectedness graph of 11 proteins overexpressed in WT DEN livers. Edge weights represent the strength of co-regulation.
Figure 9
Figure 9
Fasn immunostaining in WT DEN and hSDC1+/+ DEN livers. (a,b) A low amount of homogenously distributed cytoplasmic reaction was seen in hSDC1+/+ DEN livers at month 3 and month 6. In WT livers, elevated immunostaining was detected in the preneoplastic foci at month 3 as well as in tumors at month 6. © At high magnification, intense cytoplasmic Fasn immunostaining was observed in the cytoplasm of cancer cells in WT DEN tumors. Representative image at 200× magnification, scale bar: 50 μm.
Figure 10
Figure 10
Western blot analysis of selected components of EGFR and β-catenin signaling. (a) Immunoblots and (b) corresponding densitometry graphs. Data points represent mean ± SD, n = 3; * p < 0.05; ** p < 0.01; *** p < 0.001.
Figure 11
Figure 11
Western blot analysis of selected components of the Akt/mTOR pathway. (a) Immunoblots and (b) corresponding densitometry graphs. Data points represent mean ± SD, n = 3; * p < 0.05; ** p < 0.01; *** p < 0.001.
Figure 12
Figure 12
Western blot analysis of the cell cycle regulators p53, p21, p27, and c-jun. (a) Immunoblots and (b) corresponding densitometry graphs. Data points represent mean ± SD, n = 3; * p < 0.05; ** p < 0.01; *** p < 0.001.
Figure 13
Figure 13
Immunostaining of β-catenin, MMP-14 (MT-MMP1), pp42-44 (pERK1/2), and p21 in WT DEN and hSDC1+/+ DEN livers at month 3. In hSDC1+/+ DEN livers with retained structure and devoid of premalignant foci, β-catenin was localized exclusively to the cell surface of hepatocytes. In the preneoplastic foci of WT DEN livers, polymorphic cells already displayed nuclear β-catenin positivity. In the same foci, strong immunostaining of MMP14, a metalloprotease known to be implicated in SDC1 shedding, was seen on cell surfaces, whereas only perisinusoidal cells but no normal hepatocytes expressed MMP14 in hSDC1+/+ DEN livers. In WT DEN livers, preneoplastic foci were extensively marked by pp42-44 positivity, whereas only small islets of cells displayed high pERK1/2 in hSDC1+/+ DEN. Areas with high pERK1/2 exhibited concomitant activation of the cyclin-dependent kinase inhibitor p21. White arrows show the nuclear β-catenin in the tumor area. Images are at 200× magnification, scale bar: 50 μm.
Figure 14
Figure 14
hSDC1-related alterations in cancer pathways revealed by the Full Moon Phospho Array. Data points represent the mean ± SD, n = 3; * p < 0.05; ** p < 0.01; *** p < 0.001.
Figure 15
Figure 15
STRING analysis of (a) WT DEN and (b) hSDC1+/+ DEN liver proteomes at month 3. Labels: (a1) ribosomal proteins; (a2) apoproteins, serine proteases, and fetuin; (a4) proteasomal proteins; (a5) motor proteins differentially regulated in WT DEN; (b1) ribosomal proteins; (b3) mitochondrial respiratory chain proteins; (b4) proteasomal proteins; (b6) miscellaneous, including splicing related factors, RNA binding protein, nuclear RNP helicase, and nucleocytoplasmic transport molecules, differentially regulated in hSDC1+/+ DEN.
Figure 16
Figure 16
STRING analysis of (a) WT DEN and (b) hSDC1+/+ DEN liver proteomes at month 9. Labels: (a1) ribosomal proteins; (a4) proteasomal proteins; (a6) splicing factors (all forming a single cluster); and (a2) apoproteins and lipid metabolism proteins (forming a separate cluster) differentially regulated in WT DEN; (b1) ribosomal proteins; (b3) respiratory chain proteins; (b4) proteasomal proteins; and (b5) motor proteins differentially regulated in hSDC1+/+ DEN.
Figure 17
Figure 17
Overview of signaling pathways affected by hSDC1 overexpression in DEN-induced hepatocarcinogenesis. EGF interacts with shed SDC1 through binding to HS to create a ternary complex with EGFR that triggers its activation. Decreased activity of receptor tyrosine kinases such as MET, PDGFR, insulin receptor, and AXL, and most likely of Wnt, may result from increased SDC1 shedding, as growth factors bound to the HS chains of SDC1 are removed from the vicinity of their receptors. Consequently, the activities of PIKC3, PDK1, and Akt are downregulated. Although the mechanism of Akt pSer473 downregulation by mTORC2 requires further investigation, downregulation of insulin receptors or PDGFR are likely candidates. Impaired activity of Akt is indicated by decreased inactivating phosphorylation of GSK3, Foxo1 and IkB. The mTOR pathway is further inhibited via feedback phosphorylation of mTOR by pS6K. Upregulation of CaMKII and decrease in Rac interferes with the noncanonical pathway of β-catenin. Besides their implication in cell metabolism, both Foxo1 and p53 upregulate the CDK inhibitors p21 and p27. Together with the downregulation of c-myc and cyclinD1, the overall outcome of these events is the inhibition of cell proliferation.

Similar articles

Cited by

References

    1. Lambaerts K., Van Dyck S., Mortier E., Ivarsson Y., Degeest G., Luyten A., Vermeiren E., Peers B., David G., Zimmermann P. Syntenin, a syndecan adaptor and an Arf6 phosphatidylinositol 4,5-bisphosphate effector, is essential for epiboly and gastrulation cell movements in zebrafish. J. Cell Sci. 2012;125:1129–1140. doi: 10.1242/jcs.089987. - DOI - PMC - PubMed
    1. Cheng B., Montmasson M., Terradot L., Rousselle P. Syndecans as Cell Surface Receptors in Cancer Biology. A Focus on their Interaction with PDZ Domain Proteins. Front. Pharm. 2016;7:10. doi: 10.3389/fphar.2016.00010. - DOI - PMC - PubMed
    1. Couchman J.R., Gopal S., Lim H.C., Nørgaard S., Multhaupt H.A. Fell-Muir Lecture: Syndecans: From peripheral coreceptors to mainstream regulators of cell behaviour. Int. J. Exp. Pathol. 2015;96:1–10. doi: 10.1111/iep.12112. - DOI - PMC - PubMed
    1. Beauvais D.M., Rapraeger A.C. Syndecans in tumor cell adhesion and signaling. Reprod. Biol. Endocrinol. 2004;2:3. doi: 10.1186/1477-7827-2-3. - DOI - PMC - PubMed
    1. Gopal S., Søgaard P., Multhaupt H.A., Pataki C., Okina E., Xian X., Pedersen M.E., Stevens T., Griesbeck O., Park P.W., et al. Transmembrane proteoglycans control stretch-activated channels to set cytosolic calcium levels. J. Cell Biol. 2015;210:1199–1211. doi: 10.1083/jcb.201501060. - DOI - PMC - PubMed

LinkOut - more resources